Factors Affecting Stopping Distance (Edexcel GCSE Physics): Revision Note
Exam code: 1PH0
Factors Affecting Braking Distance
The braking distance is defined as:
The distance travelled by a car under the braking force - i.e. whilst it is slowing down
The main factor affecting the braking distance of a car is its speed
The greater the speed, the greater the braking distance will be
There are additional factors which affect the braking distance, such as:
Vehicle condition - e.g. worn tyres or poor brakes
Road condition - wet or icy roads make it harder to decelerate
Vehicle mass - a heavy vehicle, such as a lorry, takes longer to stop
The smoother the road conditions, for example when they are wet and icy, the less friction there is between the tyres and the road surface so there would be a greater braking distance
The braking distance is the ratio of the kinetic energy of the car and the braking force
This is because the work done in bringing a car to rest is the transfer of all its kinetic energy into other forms (thermal, sound)
The kinetic energy is equal to
KE = ½mv2
This means the braking distance is proportional to the velocity squared
If the velocity doubles, the braking distance increases by (2)2 , 4 times!

Factors Affecting Thinking Distance
The thinking distance is defined as:
The distance travelled by a car from when a driver realises they need to brake to when they apply the brakes
The reaction distance is equal to:
Reaction Distance = Speed of the car × Driver’s reaction time
The main factor that affects the thinking distance is the car’s speed, however additional factors can affect the thinking distance
It is increased by:
Tiredness
Distractions (e.g. using a mobile phone)
Intoxication (i.e. consumption of alcohol or drugs)
Since these factors can affect the driver's reaction time, they directly affect the thinking distance
Worked Example
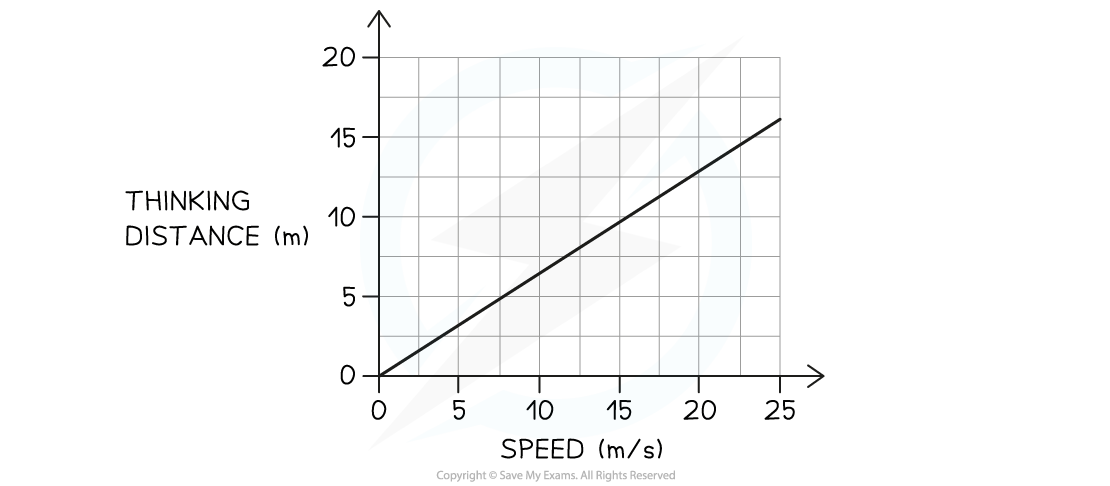
The graph below shows how the thinking distance of a driver depends on the speed of the car.

(a) Describe the connection between thinking distance and speed.
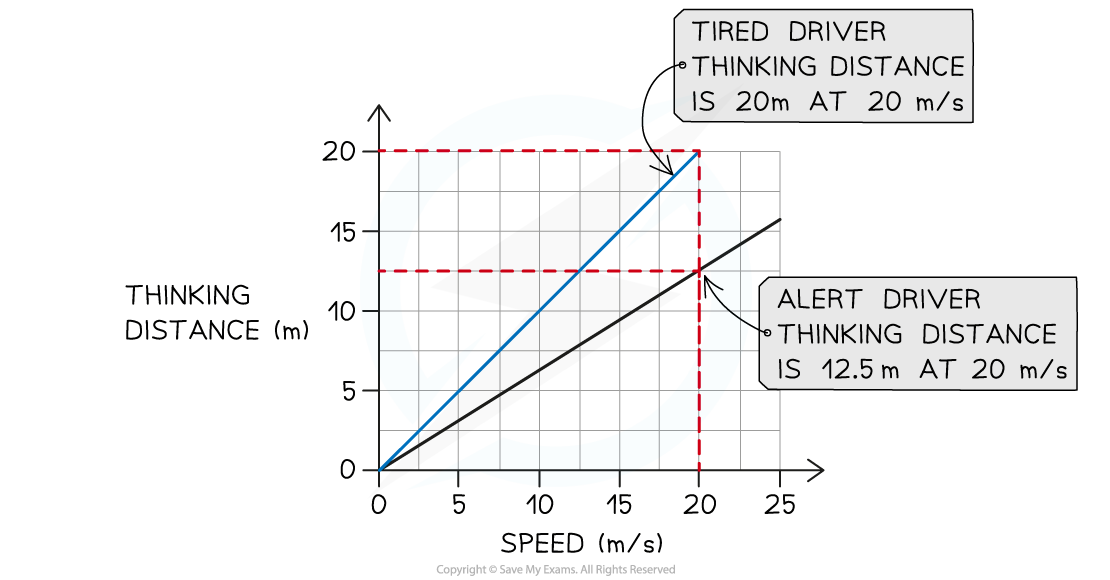
(b) Some people drive when they are tired, despite warnings against doing so. Draw a new line on the graph to show how thinking distance varies with speed for a tired driver.
Answer:
Part (a)
Step 1: Check if the line is straight and if it goes through the origin
The graph shows a straight line through the origin
The graph shows that when speed is doubled, thinking distance is also doubled
Therefore, the thinking distance is directly proportional to the speed of the car
Part (b)
Step 1: Recall the factors which affect the thinking distance
Three additional factors that affect the thinking distance (as they affect human reaction time) are:
Tiredness
Distractions
Intoxication
Hence, a tired driver's reaction time is greater (i.e. it takes longer for them to react)
Step 2: Draw a line that shows greater thinking distance for the same speed
At the same speed, a tired driver's thinking distance will be greater than an alert driver
This means a line should be drawn with a steeper gradient, as shown below:


Unlock more, it's free!
Did this page help you?