Probability Tree Diagrams (Edexcel GCSE Maths): Revision Note
Exam code: 1MA1
Did this video help you?
Tree diagrams
How do I draw a tree diagram?
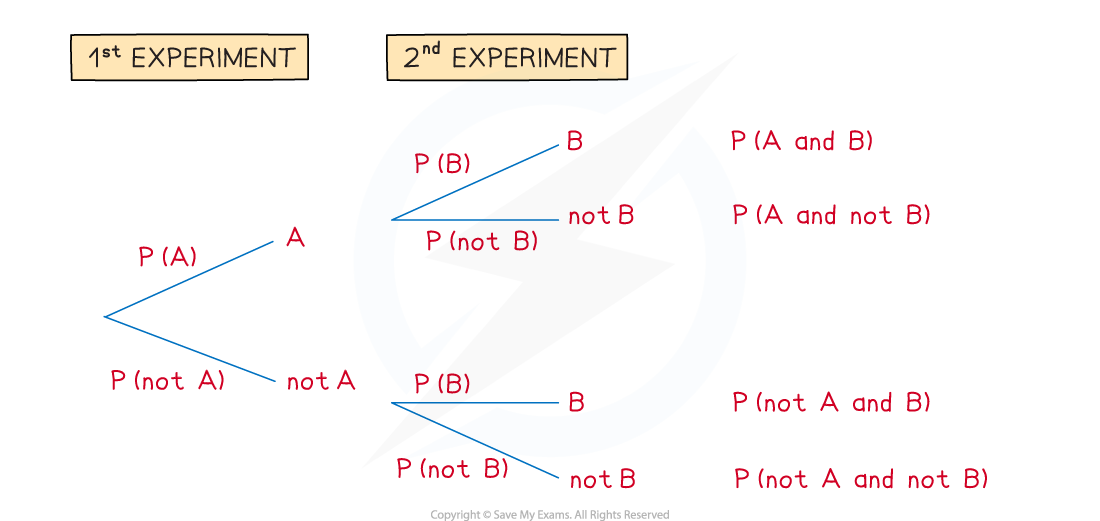
Tree diagrams can be used for repeated experiments with two outcomes
The 1st experiment has outcome A or not A
The 2nd experiment has outcome B or not B
Read the tree diagram from left to right along its branches
For example, the top branches give A followed by B
This is called A and B

How do I find probabilities from tree diagrams?
Write the probabilities on each branch
Remember that P(not A) = 1 - P(A)
Probabilities on each pair of branches add to 1
Multiply along the branches from left to right
This gives P(1st outcome and 2nd outcome)
Add between the separate cases
For example
P(AA or BB) = P(AA) + P(BB)
The probabilities of all possible cases add to 1
If asked to find the probability of at least one outcome, it is quicker to do 1 - P(none)
How do I use tree diagrams with conditional probability?
Probabilities that depend on a particular thing having happened first in a tree diagram are called conditional probabilities
For example, the probability that a team wins a game may depend on whether they won or lost the previous game
The probabilities for 'win' on the first set of branches may be different to those for 'win' on the second set of branches
Another example of conditional probabilities is "without replacement" scenarios
e.g. two items are drawn from a bag of different coloured items without the first item drawn being replaced
The probabilities on the second set of branches will change depending on which branch has been followed on the first set of branches
The denominators in the probabilities for the second set of branches will be one less than those on the first set of branches
The numerators on the second set of branches will also change
Conditional probability questions are sometimes introduced by the expression 'given that...'
e.g. 'Find the probability that the team win their next game given that they lost their previous game'
The notation
is often used for conditional probabilities
That is read as 'the probability of A given B'
e.g.
is the probability a team wins, given that they lost the previous game
Examiner Tips and Tricks
When multiplying along branches with fractions, don't cancel fractions in your working.
Having the same denominator makes them easier to add together.
Worked Example
A worker drives through two sets of traffic lights on their way to work.
Each set of traffic lights has only two options: green or red.
The probability of the first set of traffic lights being on green is .
The probability of the second set of traffic lights being on green is .
(a) Draw and label a tree diagram. Show the probabilities of every possible outcome.
Answer:
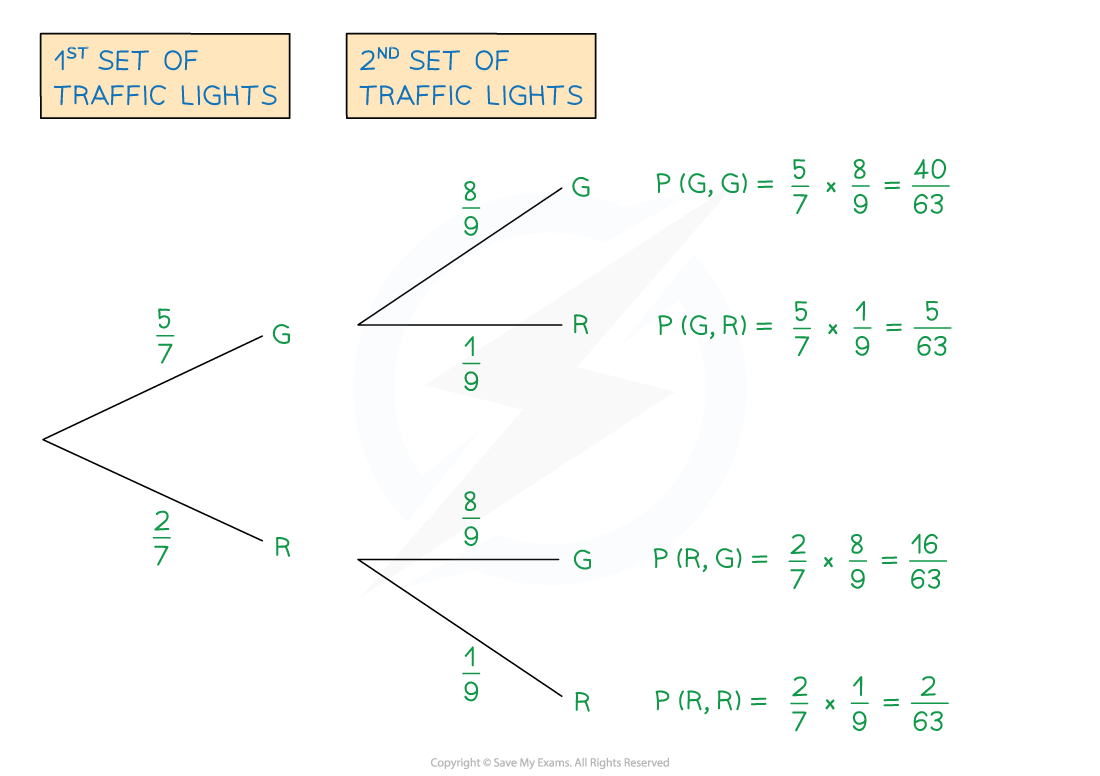
Work out the probabilities of each set of traffic lights being on red, R
Use P(red) = 1 - P(green)
Draw the branches (with a label of G or R on the ends)
Write the probabilities above each branch
Calculate probabilities of each outcome by multiplying along the branches from left to right

(b) Find the probability that both sets of traffic lights are on red.
Answer:
This is the answer for P(R, R) from the tree diagram
(c) Find the probability that at least one set of traffic lights are on red.
Answer:
Method 1
This means the 1st is green and the 2nd is red
Or the 1st is red and the 2nd is green
Or the 1st is red and the 2nd is red ('at least one' could mean both)
Add between the separate cases
Method 2
At least one red means all the possible cases shown except two greens
So P(at least 1 red) = 1 - P(two greens)
Worked Example
Liana has 10 pets. She has 7 guinea pigs (G) and 3 rabbits (R).
Liana is choosing two pets to feature in her latest online video.
First she is going to choose one of the pets at random. Once she has carried that pet to her video studio she is going to go back and choose a second pet at random to also feature in the video.
(a) Draw and label a tree diagram including the probabilities of all possible outcomes.
Answer:
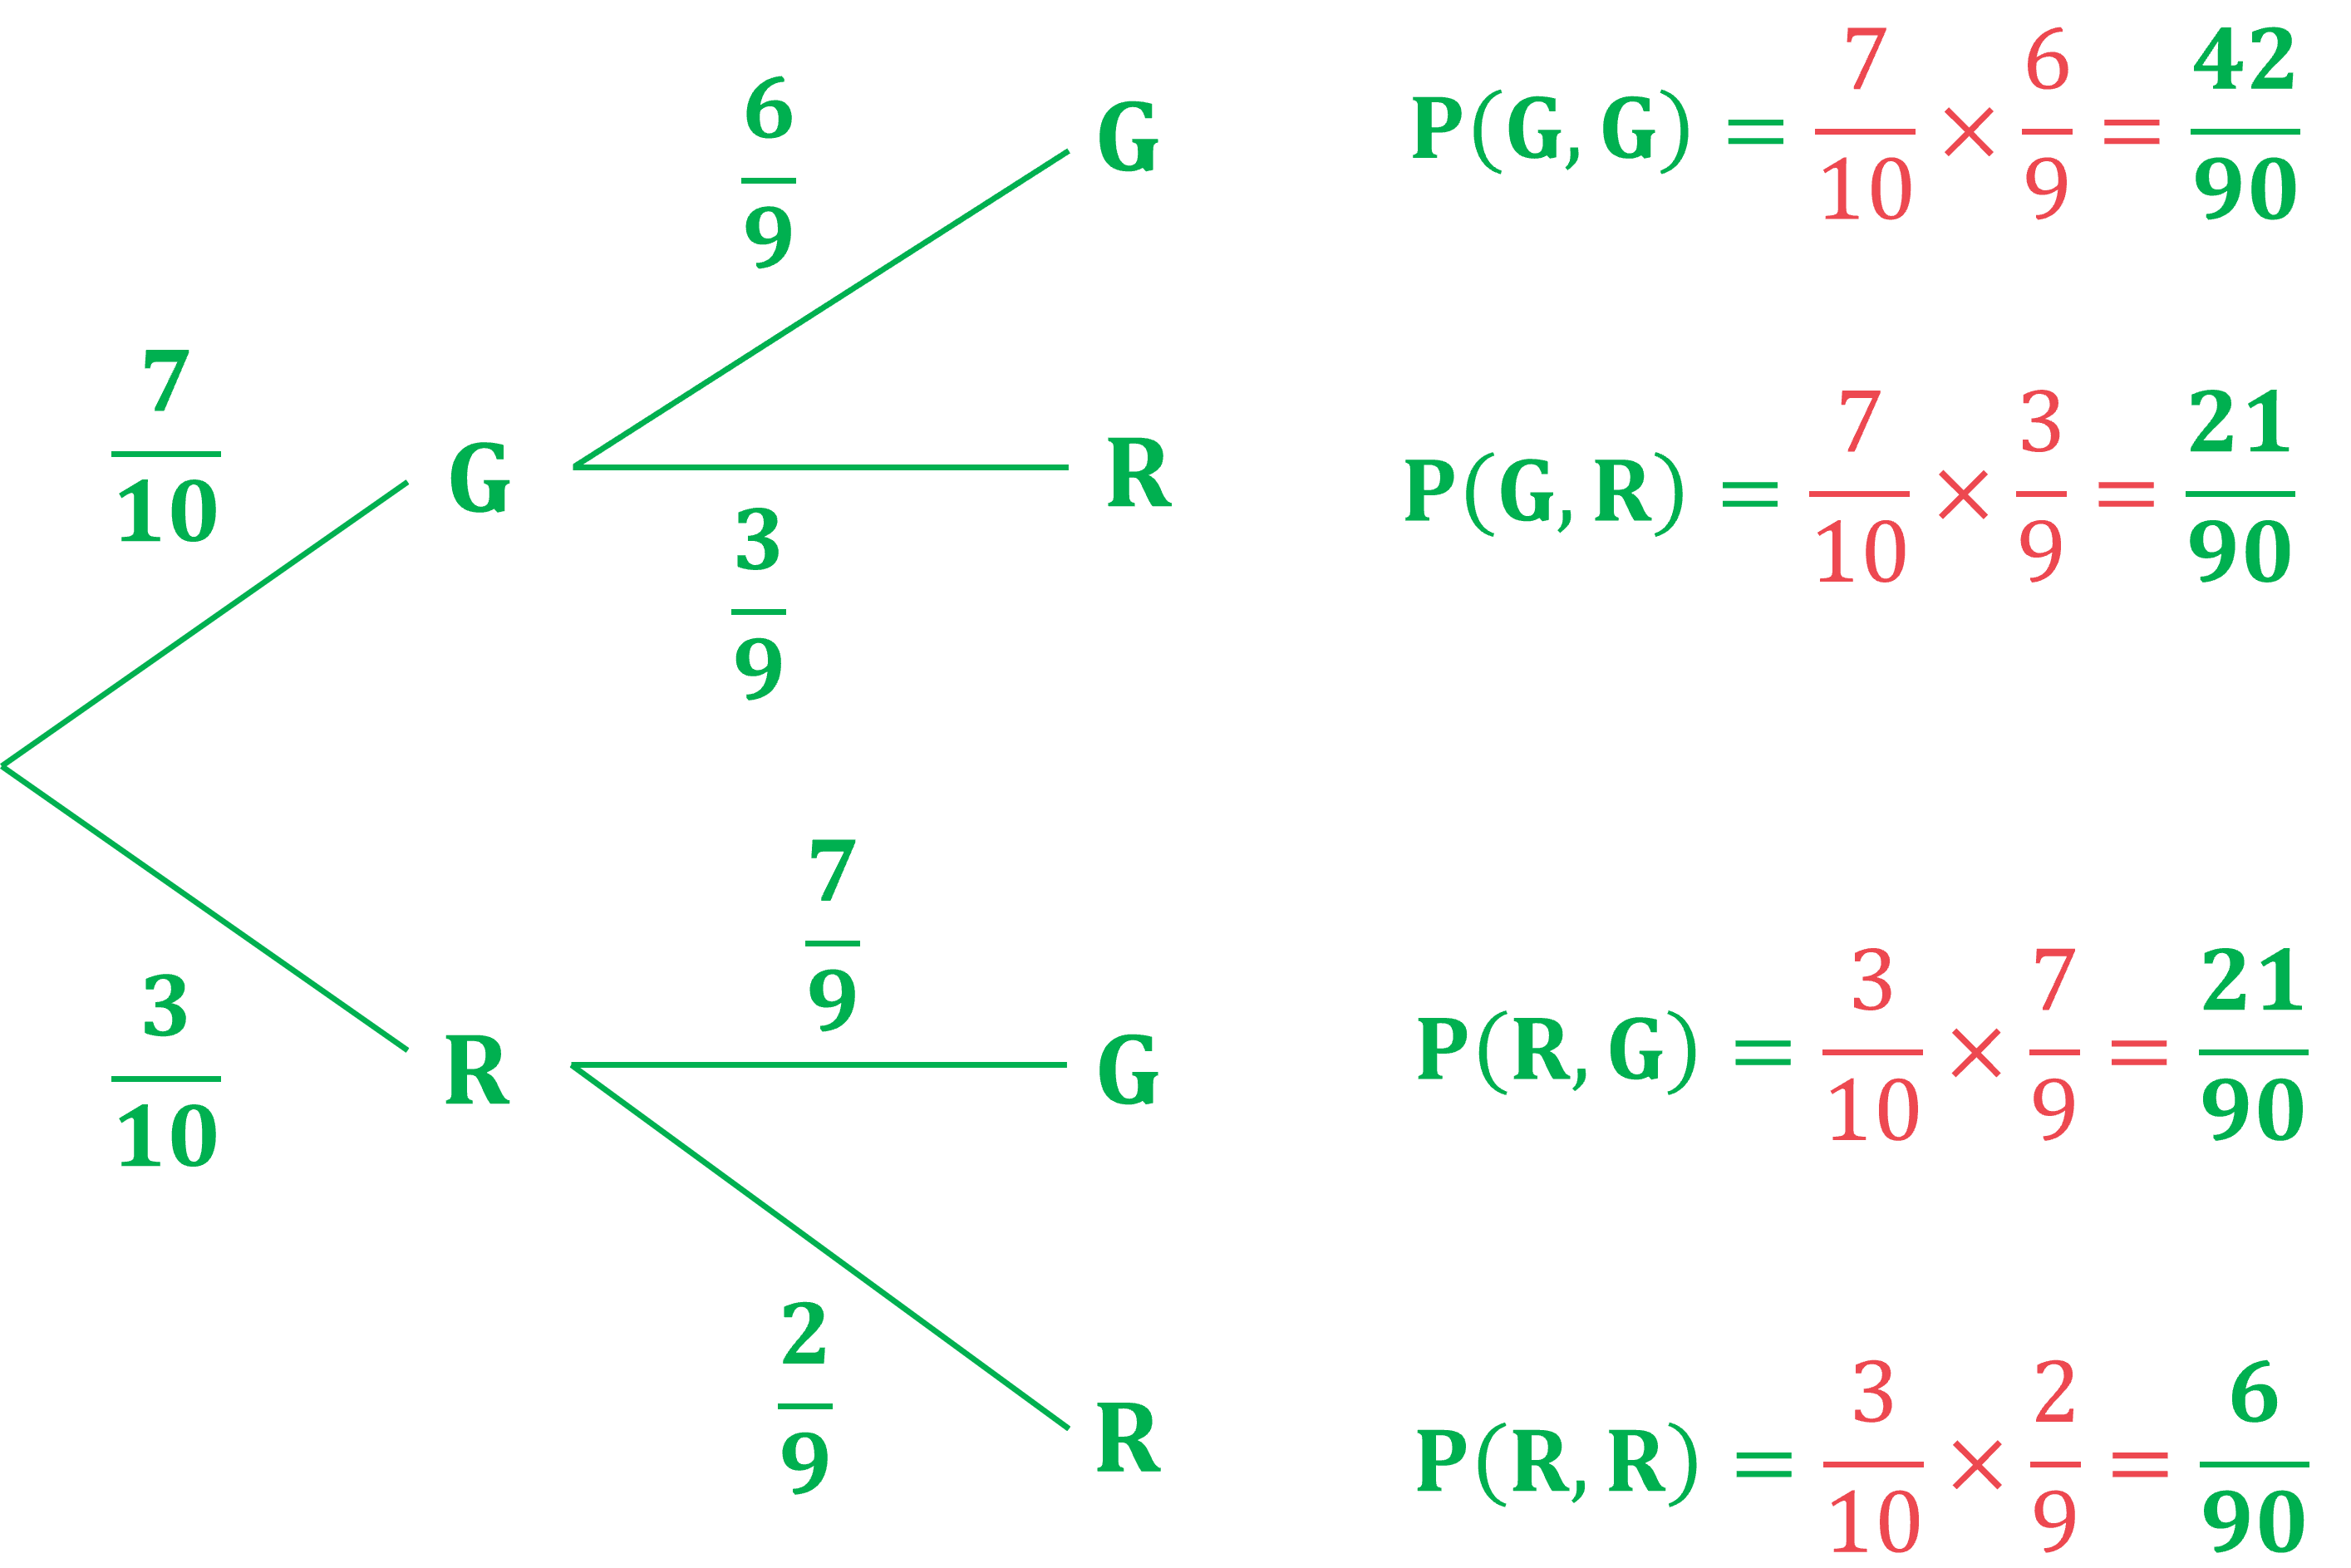
For the 1st pet chosen, there will be a 7/10 probability of choosing a guinea pig, and a 3/10 probability of choosing a rabbit.
If the first pet is a guinea pig, there will only be 6 guinea pigs and 3 rabbits left (9 animals total)
So for the second pet the probability of choosing a guinea pig would be 6/9, and probability of choosing a rabbit would be 3/9
If the first pet is a rabbit, there will only be 7 guinea pigs and 2 rabbits left (9 animals total)
So for the second pet the probability of choosing a guinea pig would be 7/9, and probability of choosing a rabbit would be 2/9
Put these probabilities into the correct places on the tree diagram, and then multiply along the branches to find the probabilities for each outcome

(b) Find the probability that Liana chooses two rabbits.
Answer:
As we have already calculated this probability in the table, we can just write the answer down
(c) Find the probability that Liana chooses two different kinds of animal.
Answer:
This would be "G AND R" OR "R AND G" so we need to add two of the final probabilities

Unlock more, it's free!
Did this page help you?