Scatter Graphs & Correlation (Edexcel GCSE Maths): Revision Note
Exam code: 1MA1
Correlation
What is correlation?
Correlation describes how two quantities are related to each other
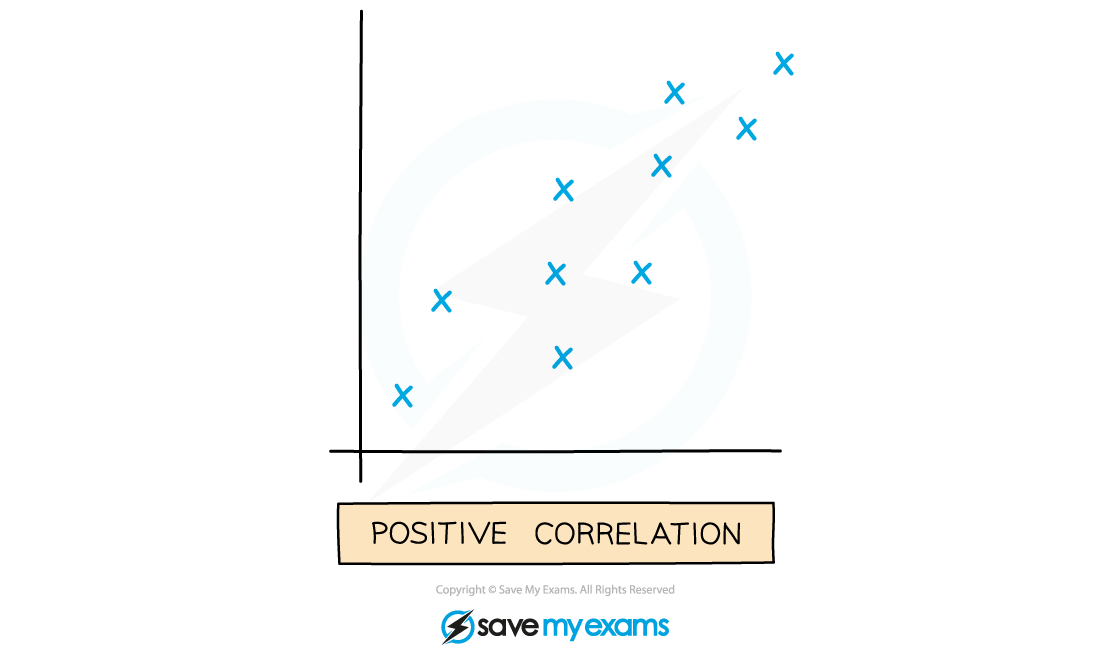
Positive correlation is when one quantity increases and the other quantity increases
For example, as temperature increases, sales of cold drinks increase
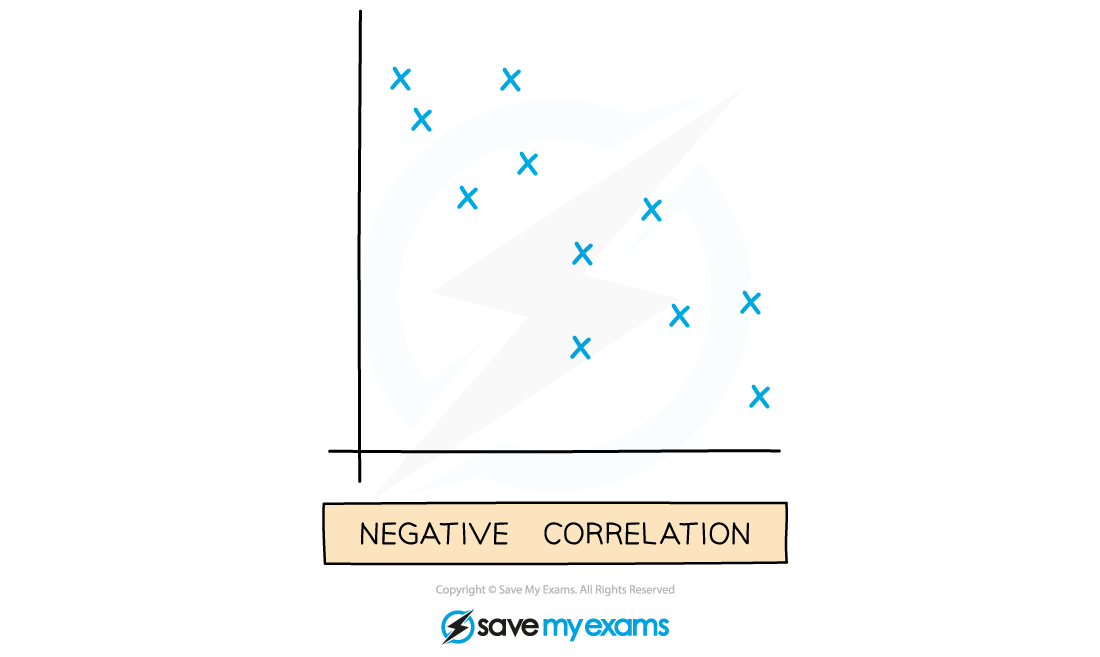
Negative correlation is when one quantity decreases while the other quantity increases
For example, the value of a car decreases as its age increases
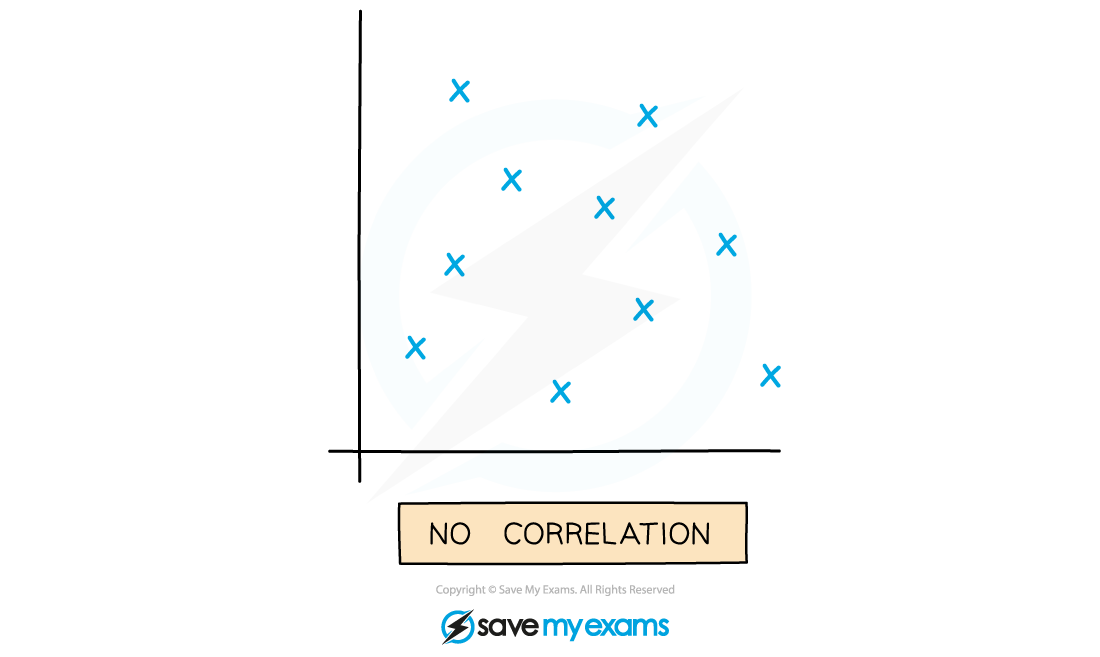
No (zero) correlation is where there is no apparent relationship
For example, the masses of snails and scores in an exam
What does the phrase "correlation does not imply causation" mean?
If two quantities correlate, it does not mean that the first causes the second
For example, each day you record the height of a sunflower and the weight of a puppy
As the height of the sunflower increases, the weight of the puppy increases
This is a positive correlation
But you cannot claim that:
If you want your puppy to weigh more, make your sunflower taller!
Sunflowers grow better when puppies are heavier!
Both quantities may be increasing due to another reason
In this case, time
Scatter graphs
What are scatter graphs?
Scatter graphs (or scatter diagrams) are used to plot pairs of data
For example, students' Maths grades against their Physics grades
The vertical and horizontal axes represent the two quantities being measured
Points are plotted as crosses, ×
They are not joined up
The general shape formed by the points shows the type of correlation
Positive correlation goes from bottom left to top right
A positive gradient
Negative correlation goes from top left to bottom right
A negative gradient
No (zero) correlation looks like a cloud of points
Correlations can be weak or strong
The stronger the correlation, the closer to a straight line the data points lie


Unlock more, it's free!
Did this page help you?