Straight Line Graphs y = mx + c (Edexcel GCSE Maths: Foundation)

Revision Note

Test yourself
Mark

Author

Mark

Last updated

Finding Equations of Straight Lines

What is the equation of a straight line?

  • The general equation of a straight line is y  = mx  + c  where
    • m  is the gradient
      • The slope of the line
    • c  is the y-intercept
      • The value where it cuts the y-axis
  • y  = 5x  + 2  is a straight line with
    • gradient 5
    • y-intercept 2
  • y  = 3 - 4x  is a straight line with
    • gradient -4
    • y-intercept 3

How do I find the equation of a straight line from a graph?

  • Find the gradient by drawing a triangle and using
    • gradient equals rise over run
      • Positive for uphill lines, negative for downhill
  • Read off the y-intercept from the graph
    • Where it cuts the y-axis
  • Substitute these values into y  = mx  + c 

What if no y-intercept is shown?

  • If you can't read off the y-intercept
    • Find any point on the line
    • Substitute it into the equation
    • Solve to find c 
  • For example, a line with gradient 6 passes through (2, 15)
    • The y-intercept is unknown
      • Write y  = 6x  + c
    • Substitute in x  = 2 and y  = 15
      • 15 = 6 × 2 + c
      • 15 = 12 + c
    • Solve for c
      • = 3
    • The equation is = 6x  + 3

What are the equations of horizontal and vertical lines?

  • A horizontal line has the equation y  = c
    • c  is the y-intercept
  • A vertical line has the equation = k
    •  k  is the x-intercept
  • For example
    • y = 4
    • x = -2

Worked example

(a)
Find the equation of the straight line shown in the diagram below.
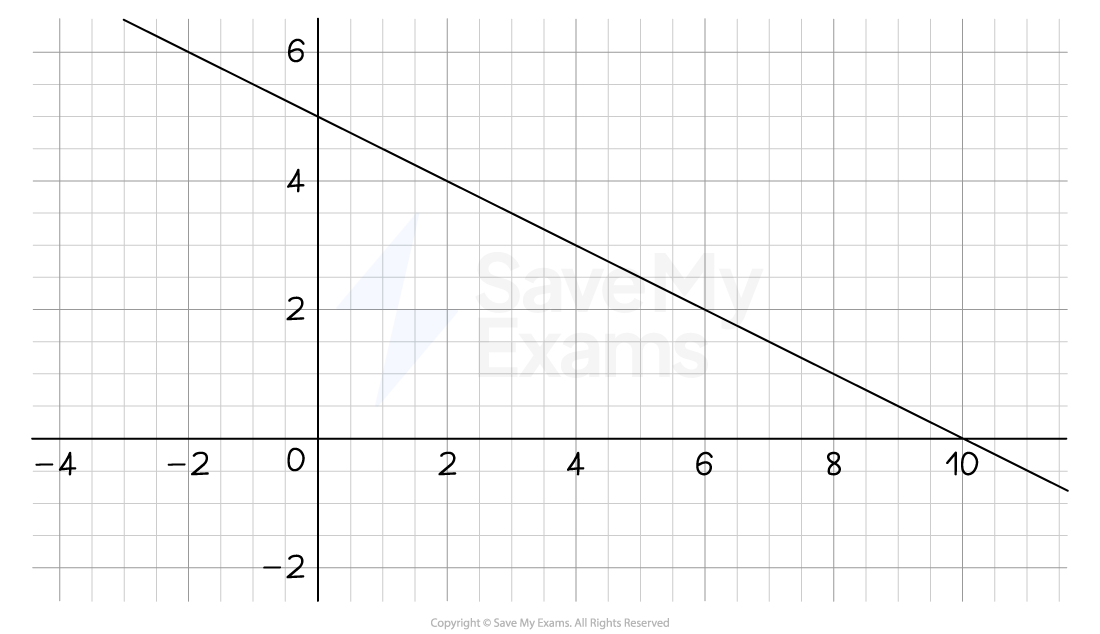
 
Graph of a straight line with negative gradient


Find m, the gradient
Identify any two points the line passes through and work out the rise and run

Line passes through (2, 4) and (10, 0)
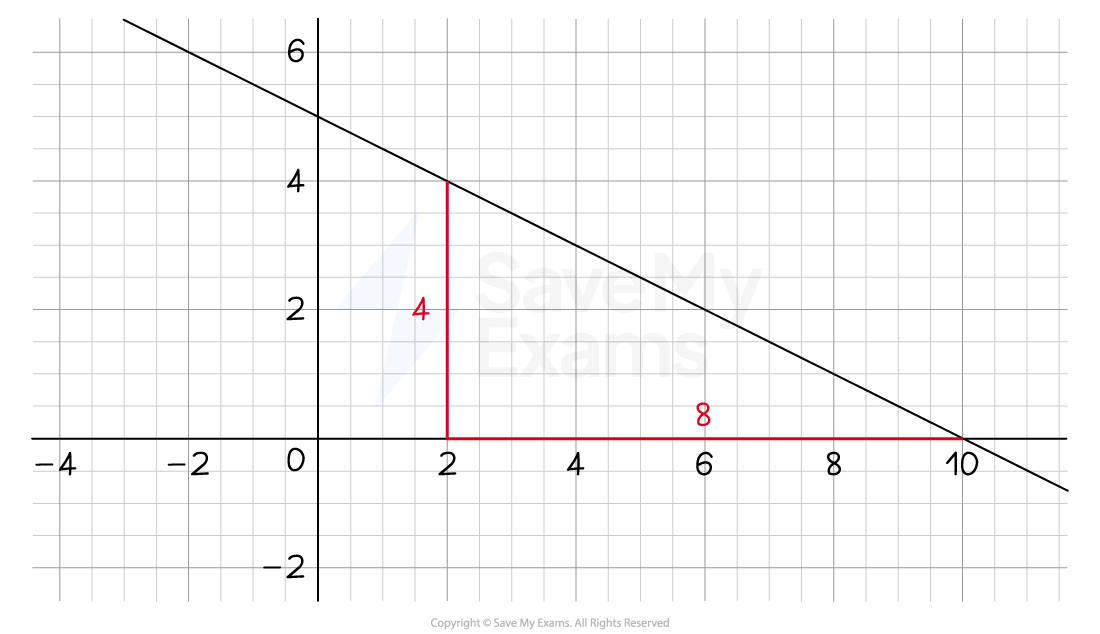
Finding the equation of a straight line from a graph

The rise is 4
The run is 8

Calculate the fraction rise over run

rise over run equals 4 over 8 equals 1 half

The slope is downward (downhill), so it is a negative gradient

gradient, m equals negative 1 half

Now find the y-intercept
The line cuts the y-axis at 5
y-intercept,  table row c equals 5 end table
 

Substitute the gradient, m, and the y-intercept, c, into = mx  + c

bold italic y bold equals bold minus bold 1 over bold 2 bold italic x bold plus bold 5


(b)

Find the equation of the straight line with a gradient of 3 that passes through the point (5, 4).

Substitute = 3 into y  = mx  + c
Leave c  as an unknown letter

y equals 3 x plus c

Substitute = 5 and = 4 into the equation
Solve the equation to find c


table row 4 equals cell 3 cross times 5 plus c end cell row 4 equals cell 15 plus c end cell row cell negative 11 end cell equals c end table


You now know c
Replace c  with −11 to complete the equation of the line

y  = 3 − 11

Drawing Linear Graphs

How do I draw a straight line from a table of values?

  • You may be given a table of values with no equation
  • Use the and values to form a point with coordinates (x , y )
    • Then plot these points
    • Use a ruler to draw a straight line through them 
      • All points should lie on the line
  • For example 
    • The points below are (-3, 0),  (-2, 2), ... etc
x -3 -2 -1 0 1 2 3
y 0 2 4 6 8 10 12

How do I draw a straight line using y  = mx  + c?

  • Use the equation to create your own table of values
    • Choose points that are spread out across the axes given
  • For example, plot y  = 2x  + 1 on axes from x  = 0 to x  = 10
    • Substitute in x  = 0, x  = 5 and x  = 10 to get y  coordinates
      • Then plot those points
x 0 5 10
y 1 11 21

How do I draw a straight line without using a table of values?

  • Start at the y-intercept, c
  • Then, for every 1 unit to the right, go up units
    • where is the gradient
    • If m  is negative, go down
  • This creates a sequence of points which you can then join up
    • Be careful of counting squares if axes have different scales
      • 1 unit might not be 1 square

Examiner Tip

  • Always plot at least 3 points (just in case one of your end points is wrong!)

Worked example

On the same set of axes, draw the graphs of y equals 3 x minus 1 and y equals negative 3 over 5 x plus 3.


For y equals 3 x minus 1, create a table of values
 

x 0 1 2
y -1 2 5


Plot the points (0, -1), (1, 2) and (2, 5)
Connect with a straight line
(Alternatively, start at the y-intercept and add 3 for every 1 unit to the right)

For y equals negative 3 over 5 x plus 3, create a table of values
Because of the fraction, = 5 is a good point to include
 

x 0 3 5
y 3 1.2 0

Plot both lines on the same set of axes

Plotting two straight lines on the same axes

You've read 0 of your 10 free revision notes

Unlock more, it's free!

Join the 100,000+ Students that ❤️ Save My Exams

the (exam) results speak for themselves:

Did this page help you?

Mark

Author: Mark

Expertise: Maths

Mark graduated twice from the University of Oxford: once in 2009 with a First in Mathematics, then again in 2013 with a PhD (DPhil) in Mathematics. He has had nine successful years as a secondary school teacher, specialising in A-Level Further Maths and running extension classes for Oxbridge Maths applicants. Alongside his teaching, he has written five internal textbooks, introduced new spiralling school curriculums and trained other Maths teachers through outreach programmes.