Reflections of Graphs (OCR GCSE Maths)

Revision Note

Mark Curtis

Written by: Mark Curtis

Reviewed by: Dan Finlay

Updated on

Reflections of Graphs

What are reflections of graphs?

  • Reflections of graphs are a type of transformation where the curve is reflected about one of the axes
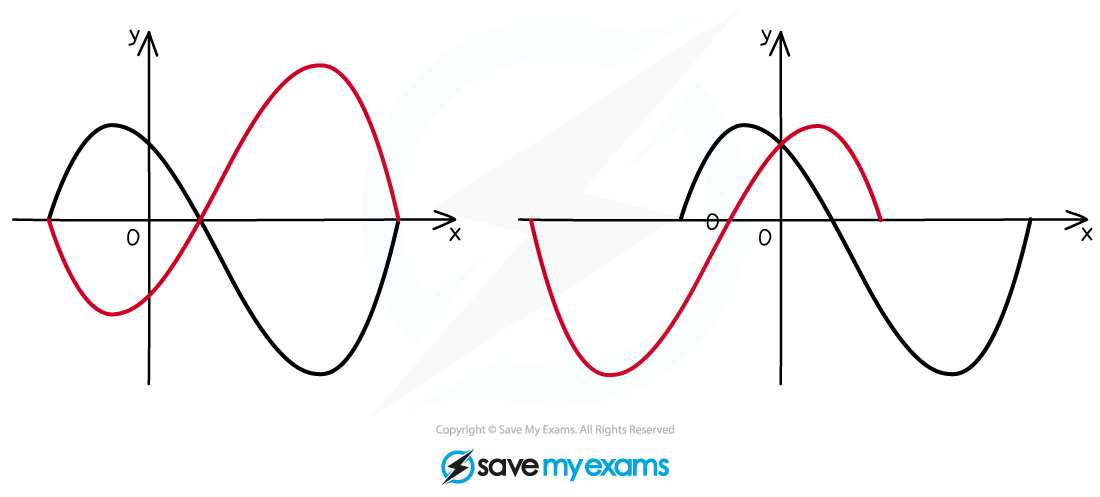
Two graphs showing curves and their reflections. The curve is reflected in the x-axis (left) and y-axis (right).
A curve reflected in the x-axis (left) and y-axis (right)

How do I reflect graphs?

Vertical reflections: y=-f(x)

  • Given an original equation in x, the graph of that equation will be reflected in the x-axis by a minus sign outside the bracket

    • The y coordinates change sign

      • The x coordinates are unaffected

  • For example, in relation to y = x2;

    • y = −x2 is a reflection in the x-axis

      • (note that y = −xis the same as y = −(x2) )

  • Another example, in relation to y = sin(x) where x is in degrees;

    • y = −sin(x) is a reflection in the x-axis
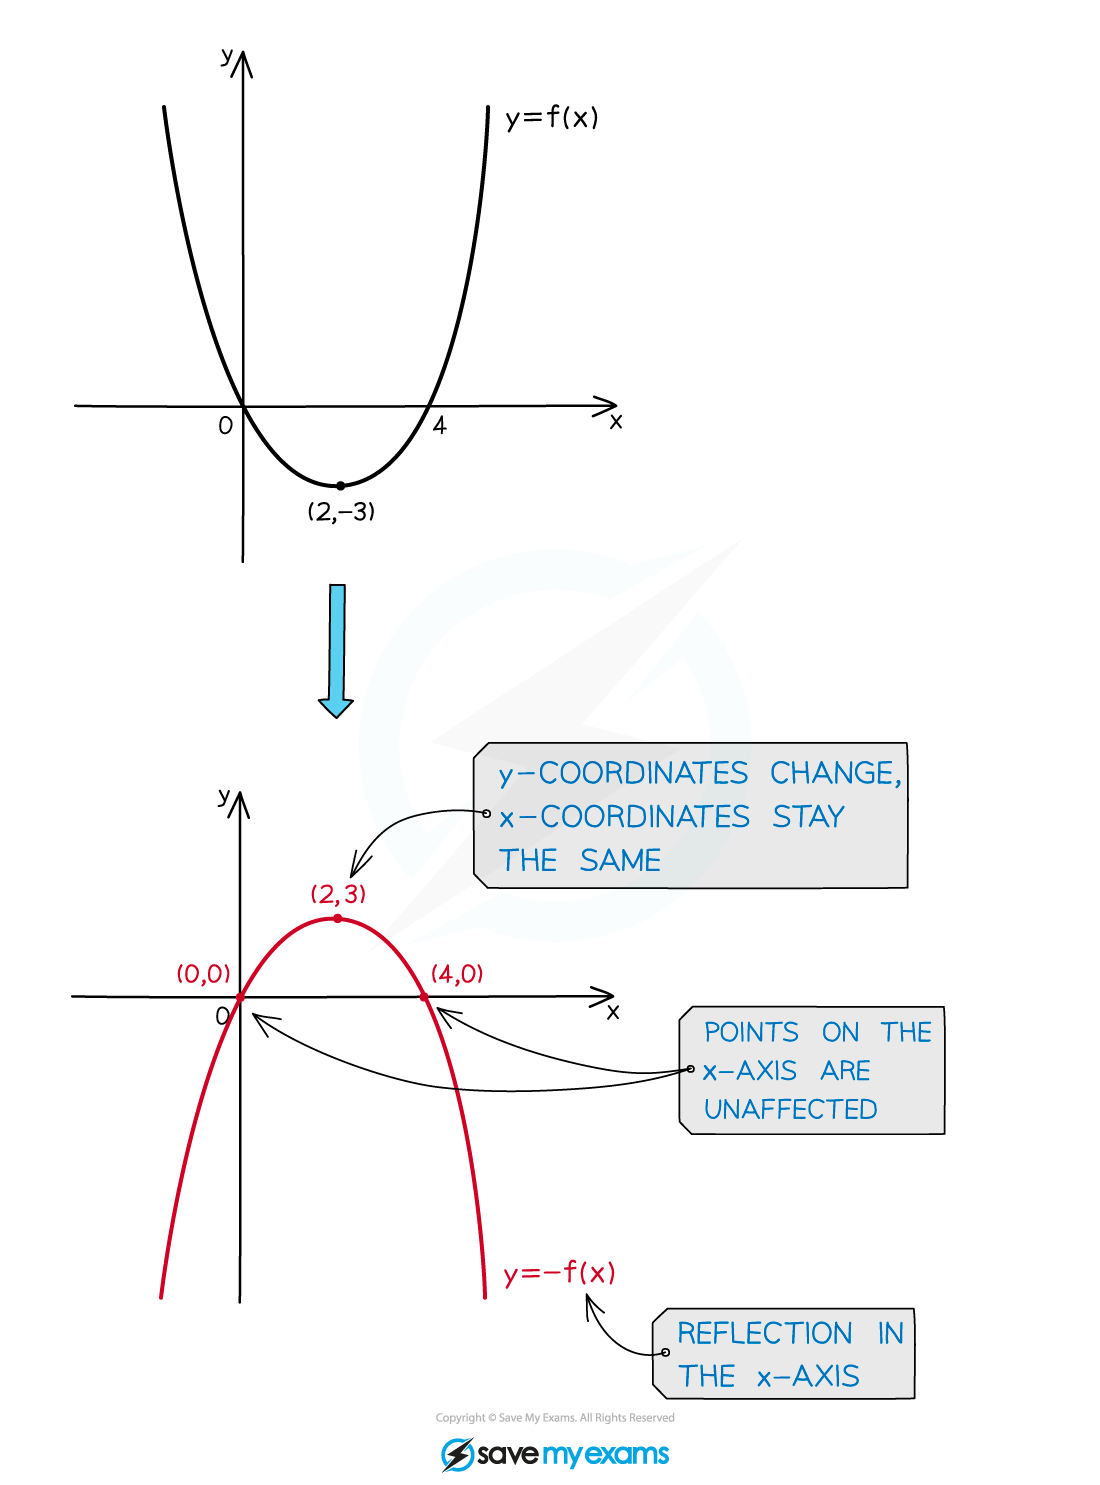
Graph showing the reflection of a parabola y=f(x) in the x-axis to y=-f(x). Key points are (2,-3) reflecting to (2,3), demonstrating y-coordinate change only.

Horizontal reflections: y=f-(x)

  • Given an original equation in x, the graph of that equation will be reflected in the y-axis by a minus sign inside a bracket next to x

    • The x coordinates change sign

      • The y coordinates are unaffected

  • For example, in relation to y = x2;

    • y = (−x)2 is a reflection in the y-axis

  • Another example, in relation to y = sin(x) where x is in degrees;

    • y = sin(−x) is a reflection in the y-axis
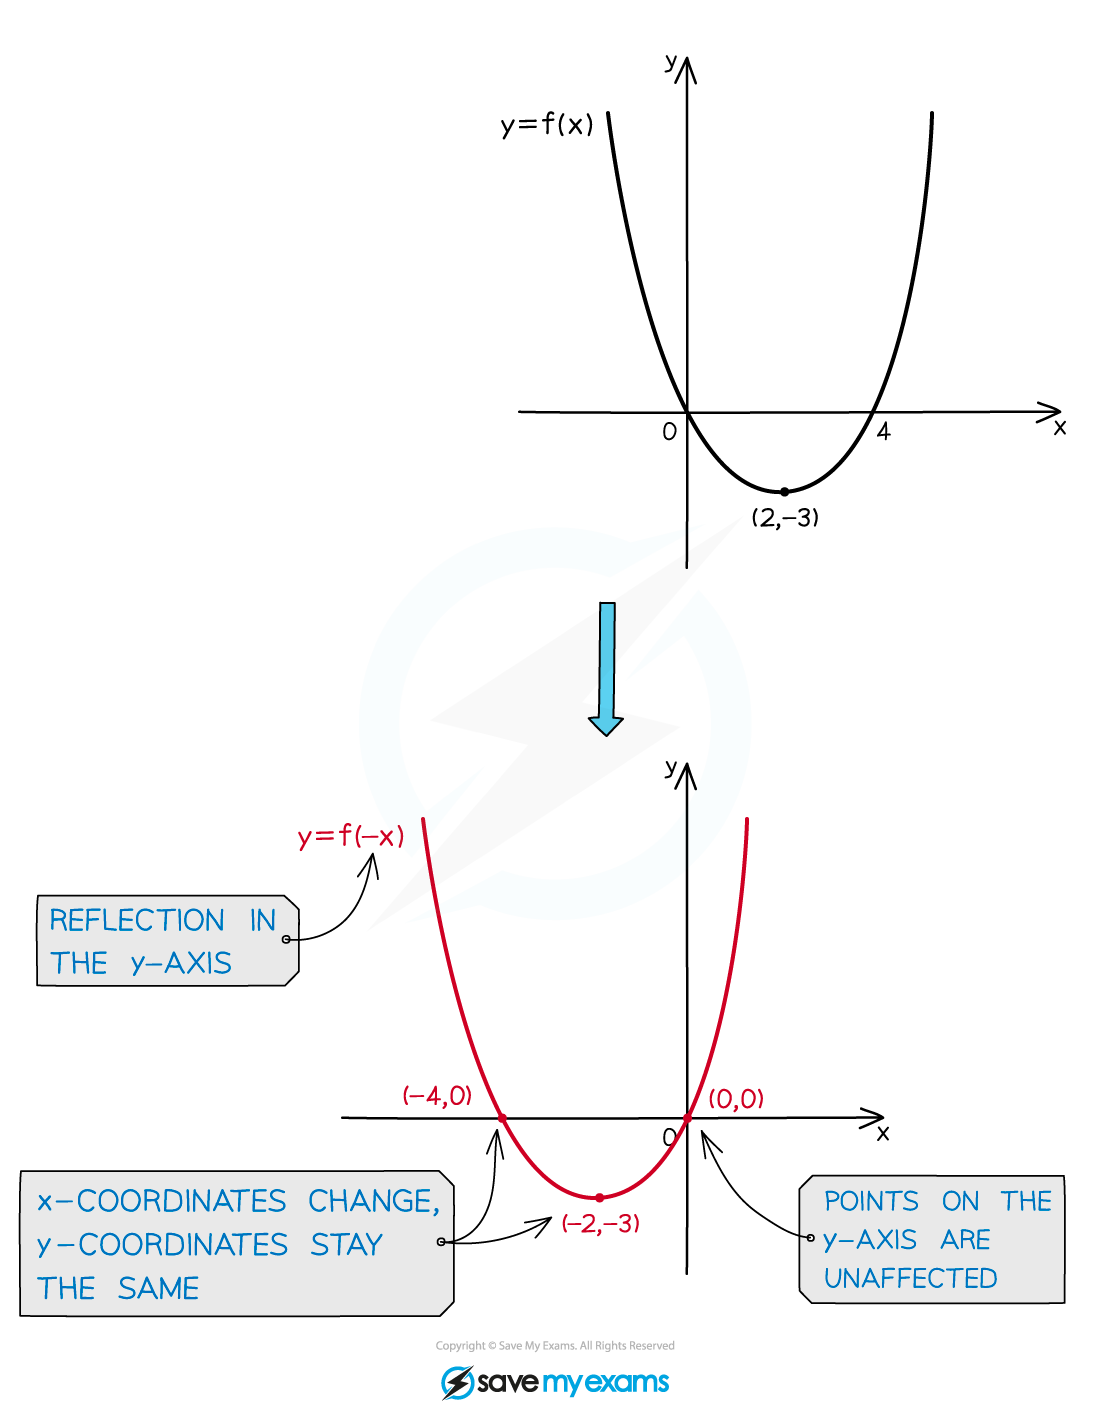
Graph showing function y=f(x) reflected in the y-axis to y=f(-x). Points on graph change x-coordinates but retain y-coordinates; points on y-axis remain affected.

Examiner Tips and Tricks

When reflecting graphs in the exam, reflect any key points on the graph first, then join them up with a smooth curve.

How does a reflection affect the equation of the graph?

  • When a graph is reflected, you can change its equation algebraically

    • There is no need to sketch the graph

  • Reflecting in the x-axis puts a minus in front of the whole equation

    • For example, y equals x squared plus 2 x becomes y equals negative open parentheses x squared plus 2 x close parentheses

      • This simplifies to y equals negative x squared minus 2 x

  • Reflecting in the y-axis replaces any x with open parentheses negative x close parentheses in the equation

    • For example, y equals x squared plus 2 x becomes y equals open parentheses negative x close parentheses squared plus 2 open parentheses negative x close parentheses

      • This simplifies to y equals x squared minus 2 x

Worked Example

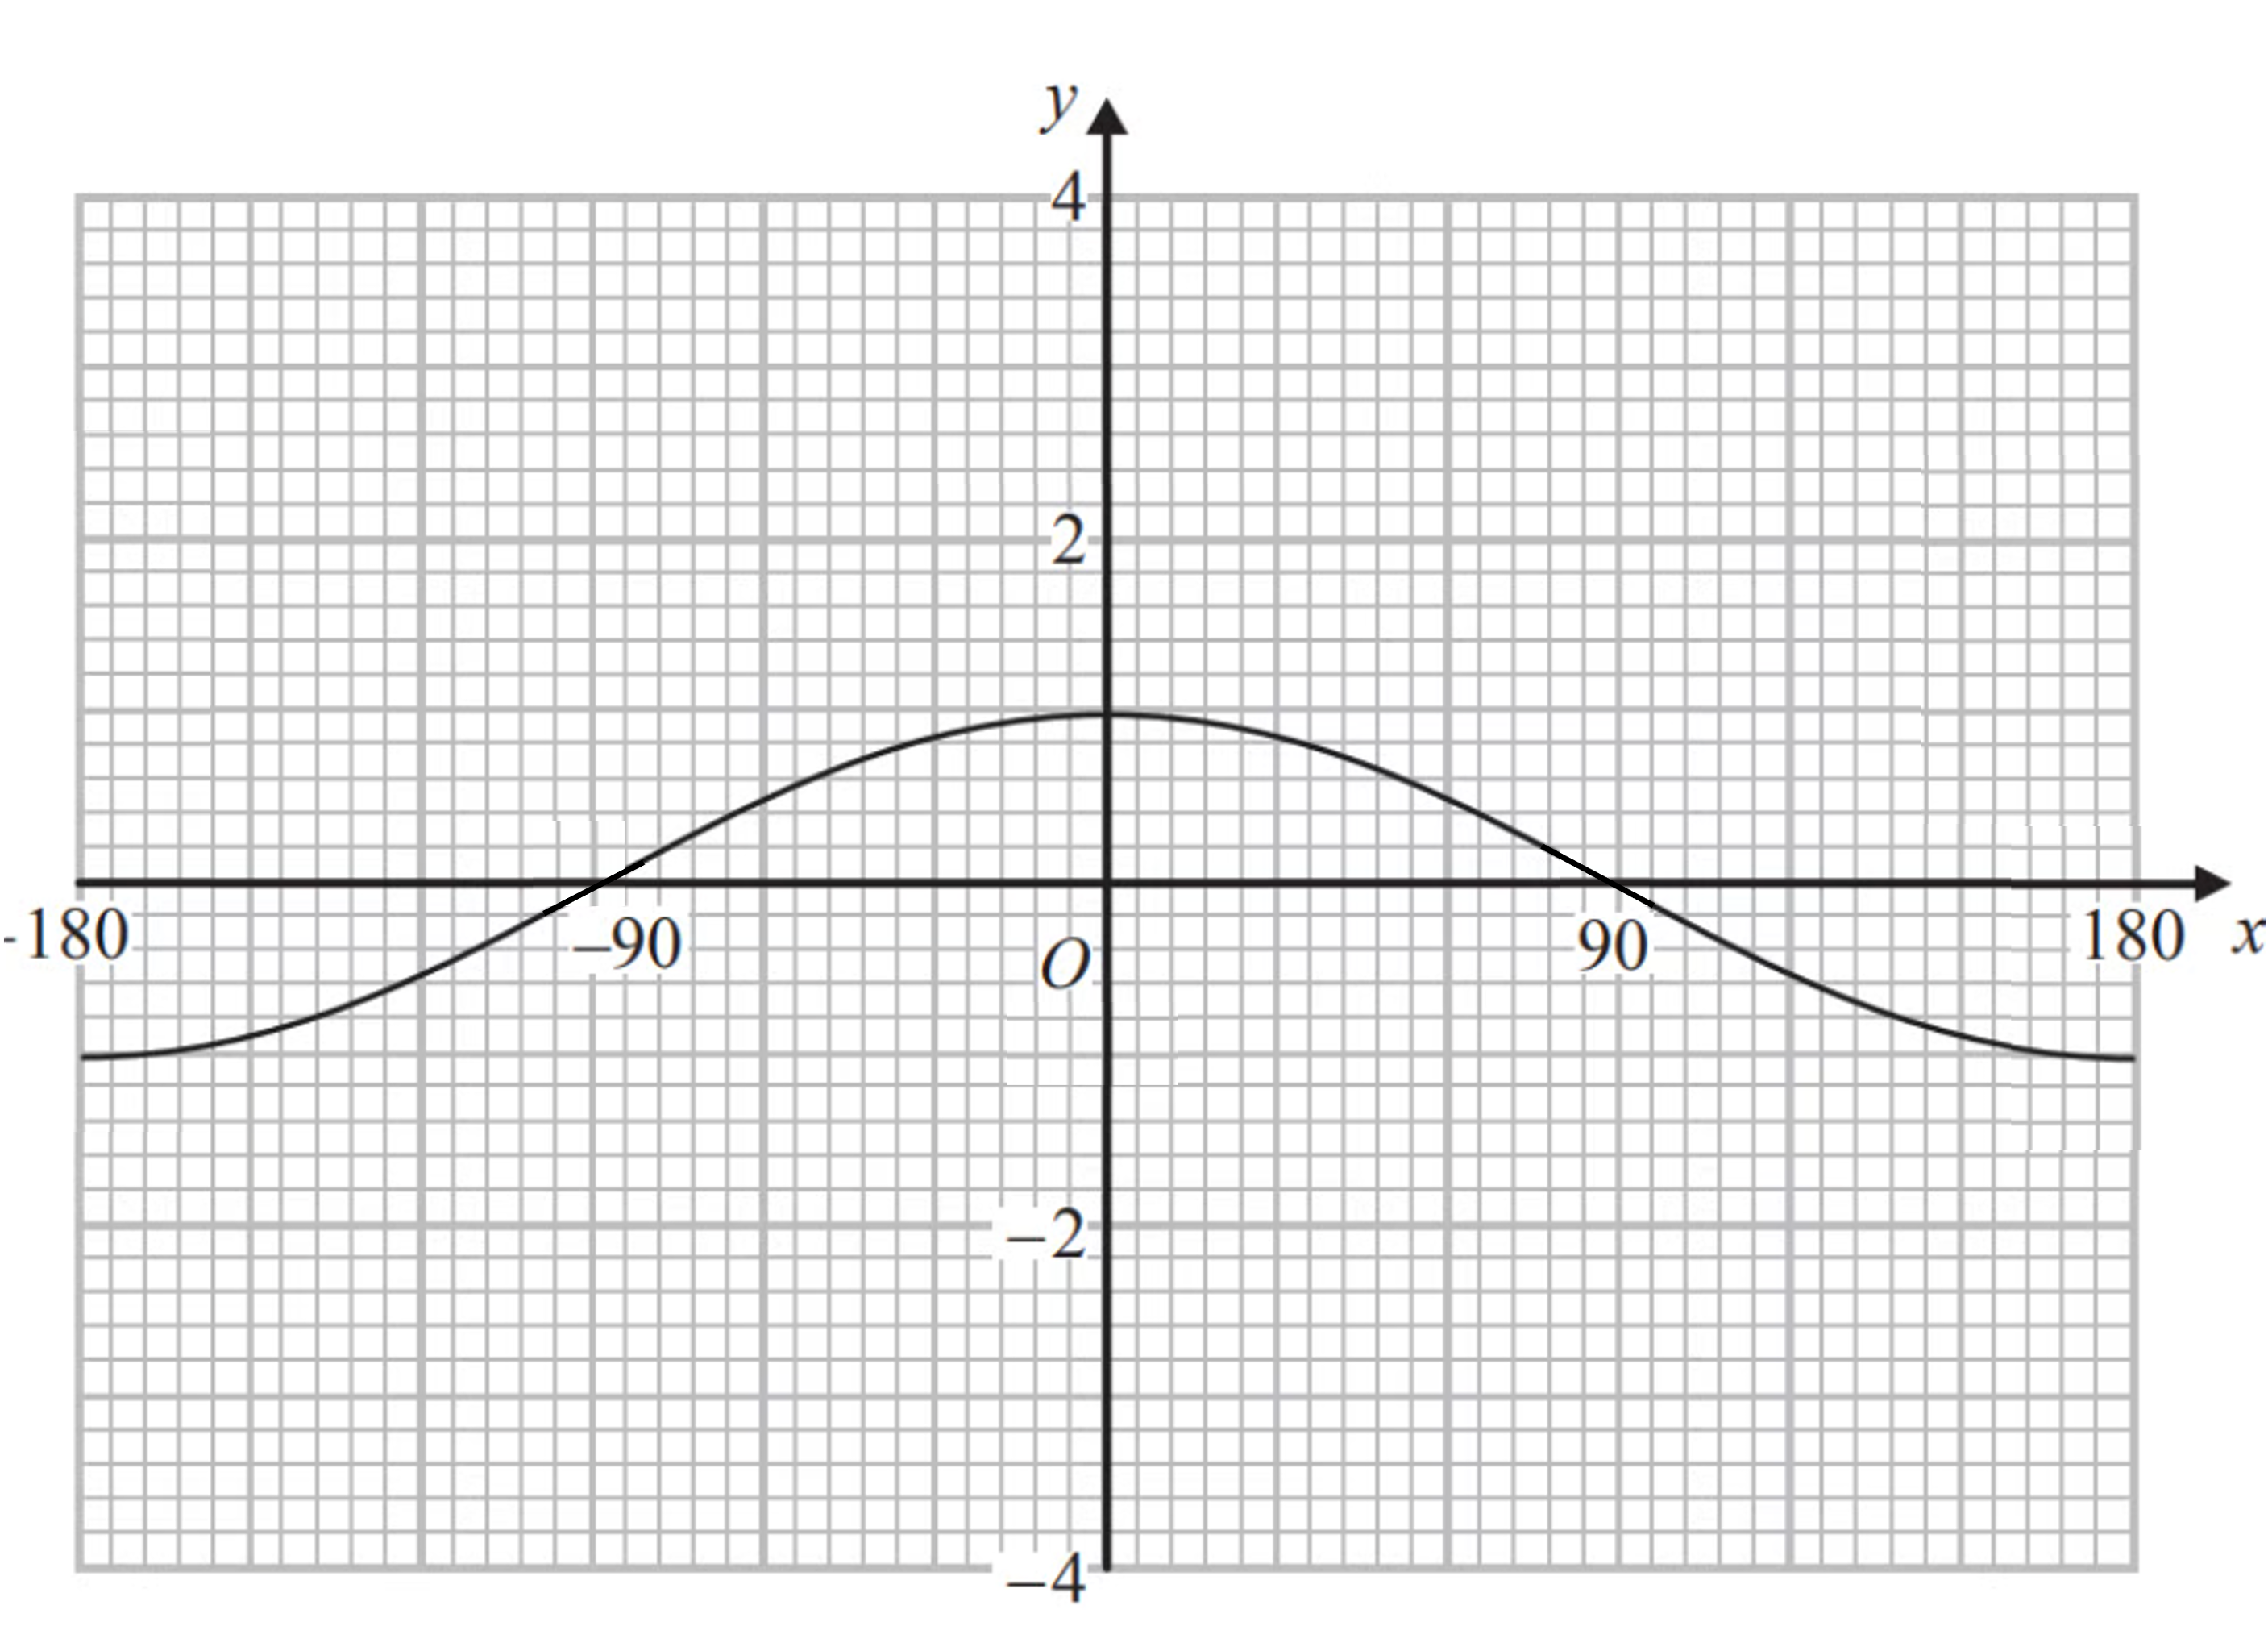
The graph of y equals cos open parentheses x degree close parentheses is shown on the graph below.

0VuoWNE2_ocr-7-graphs-transformations-reflections1

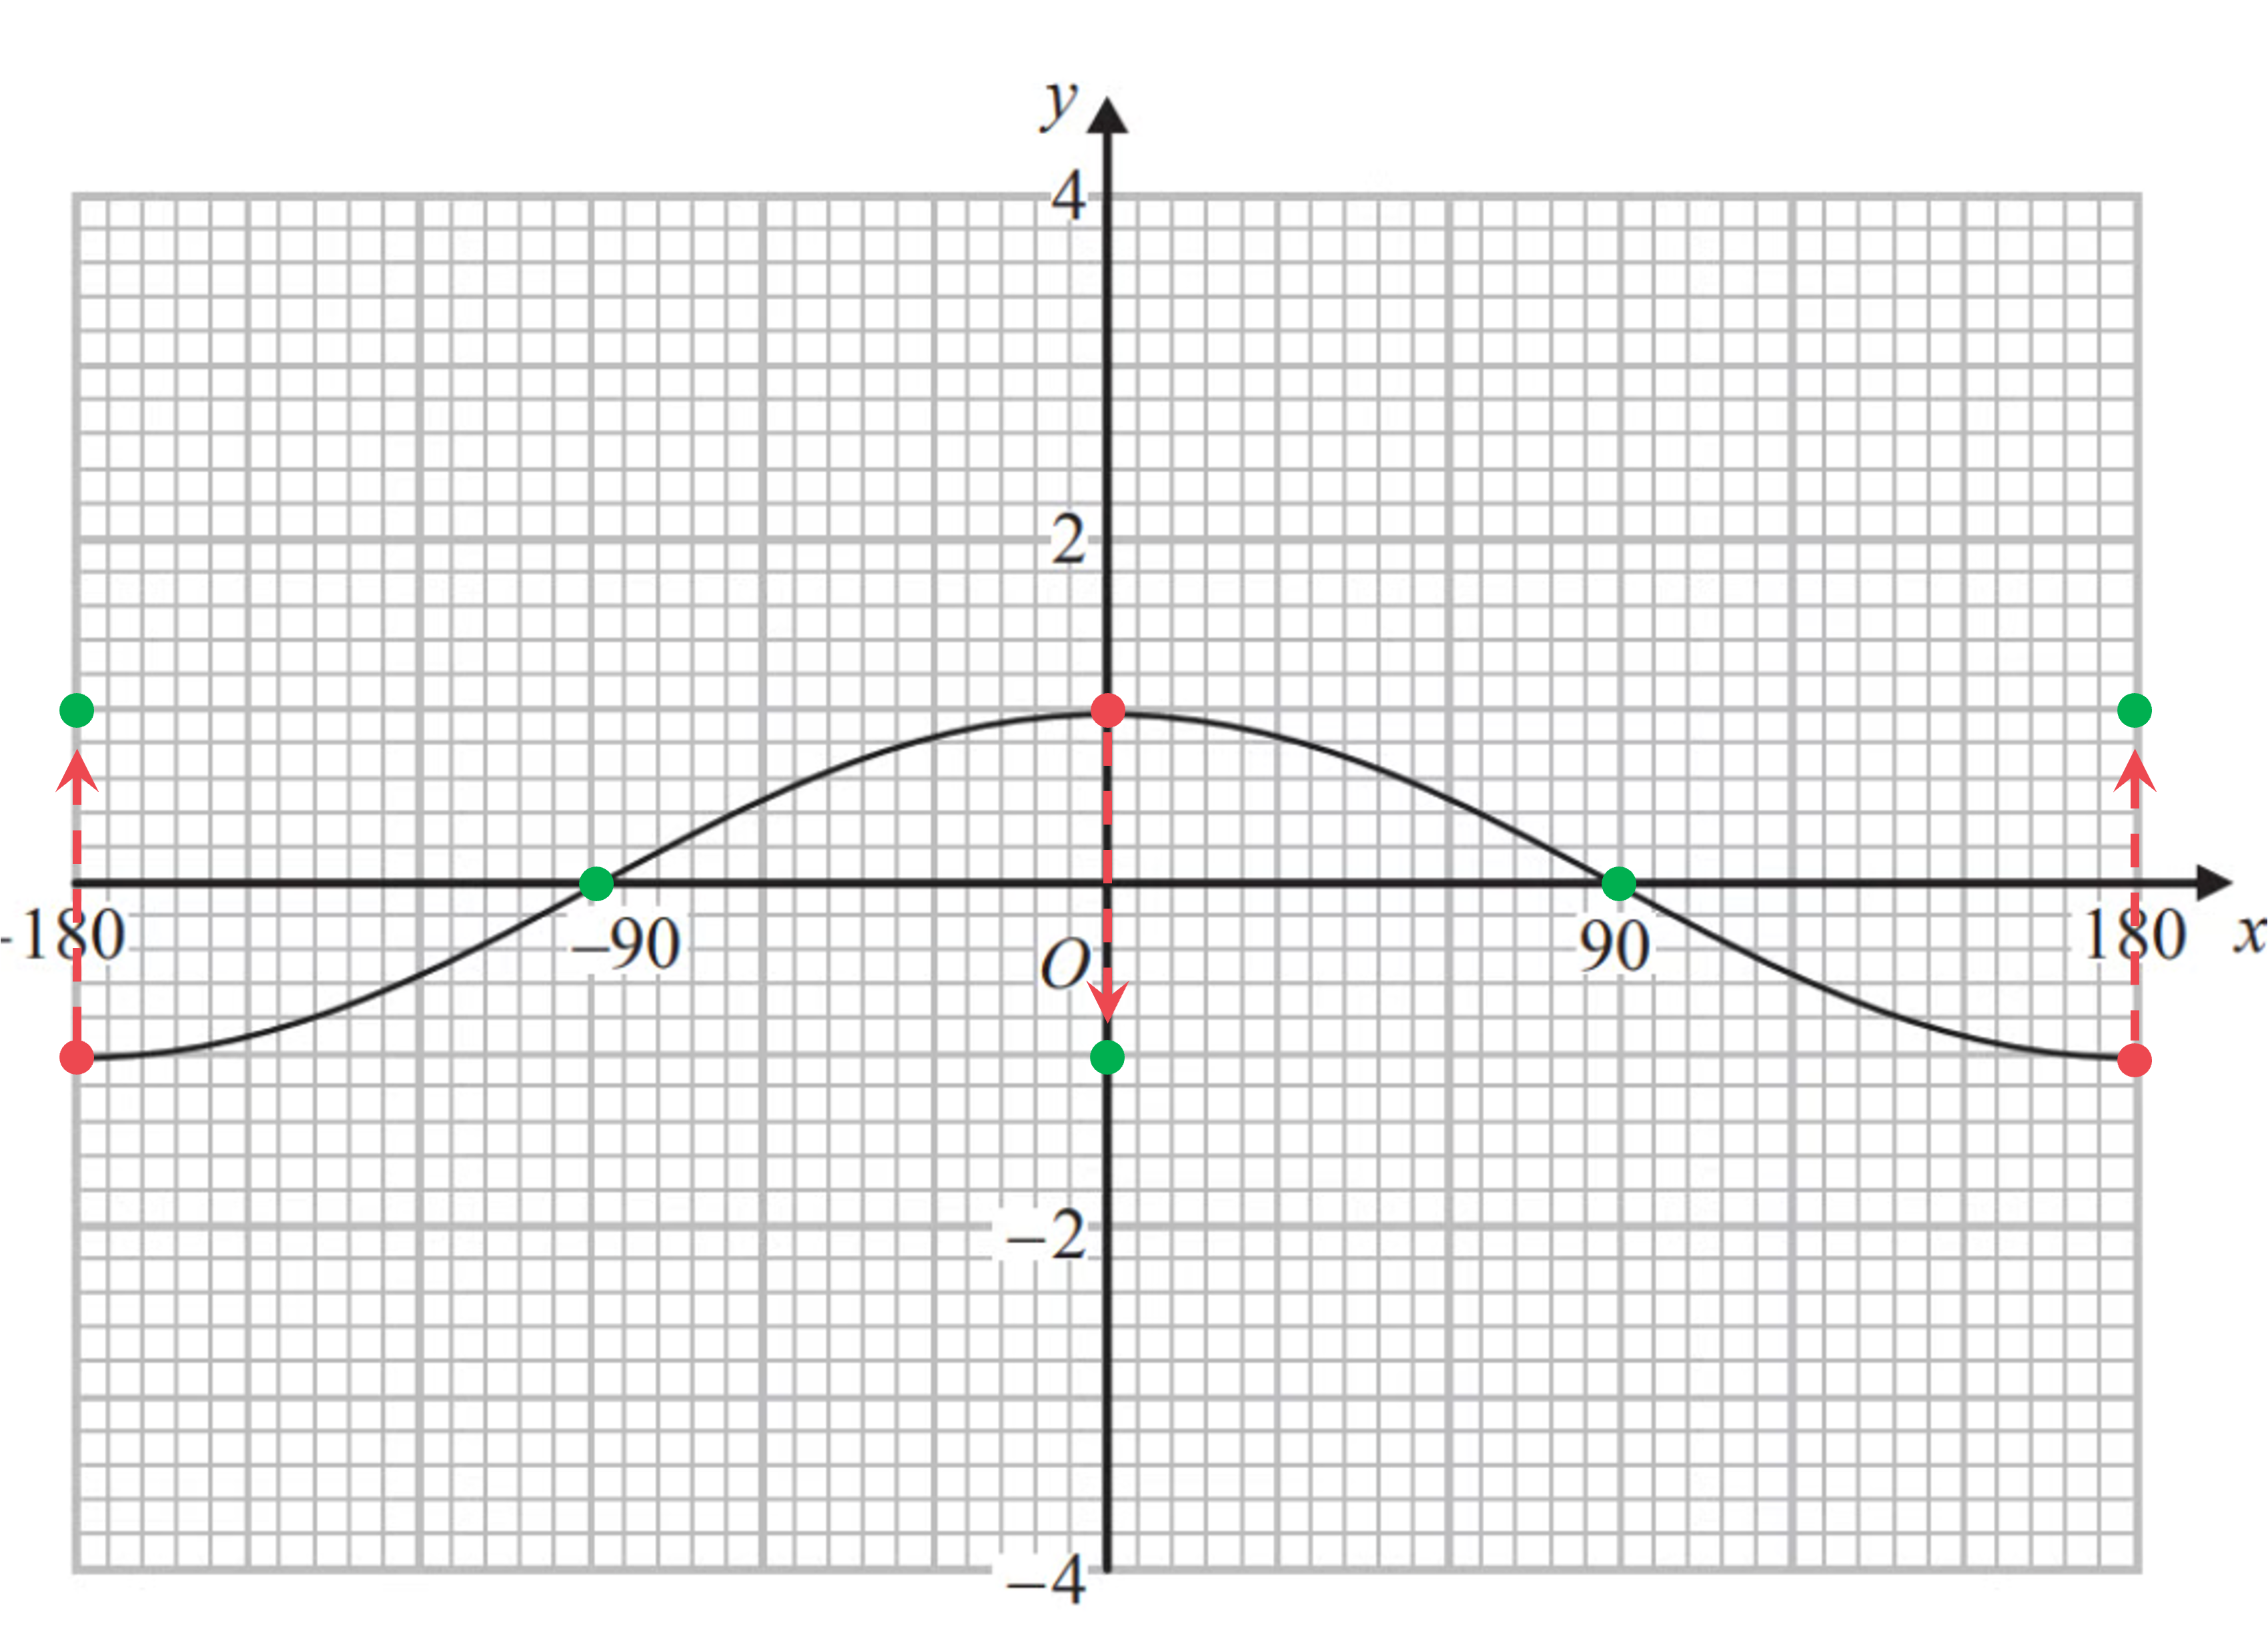
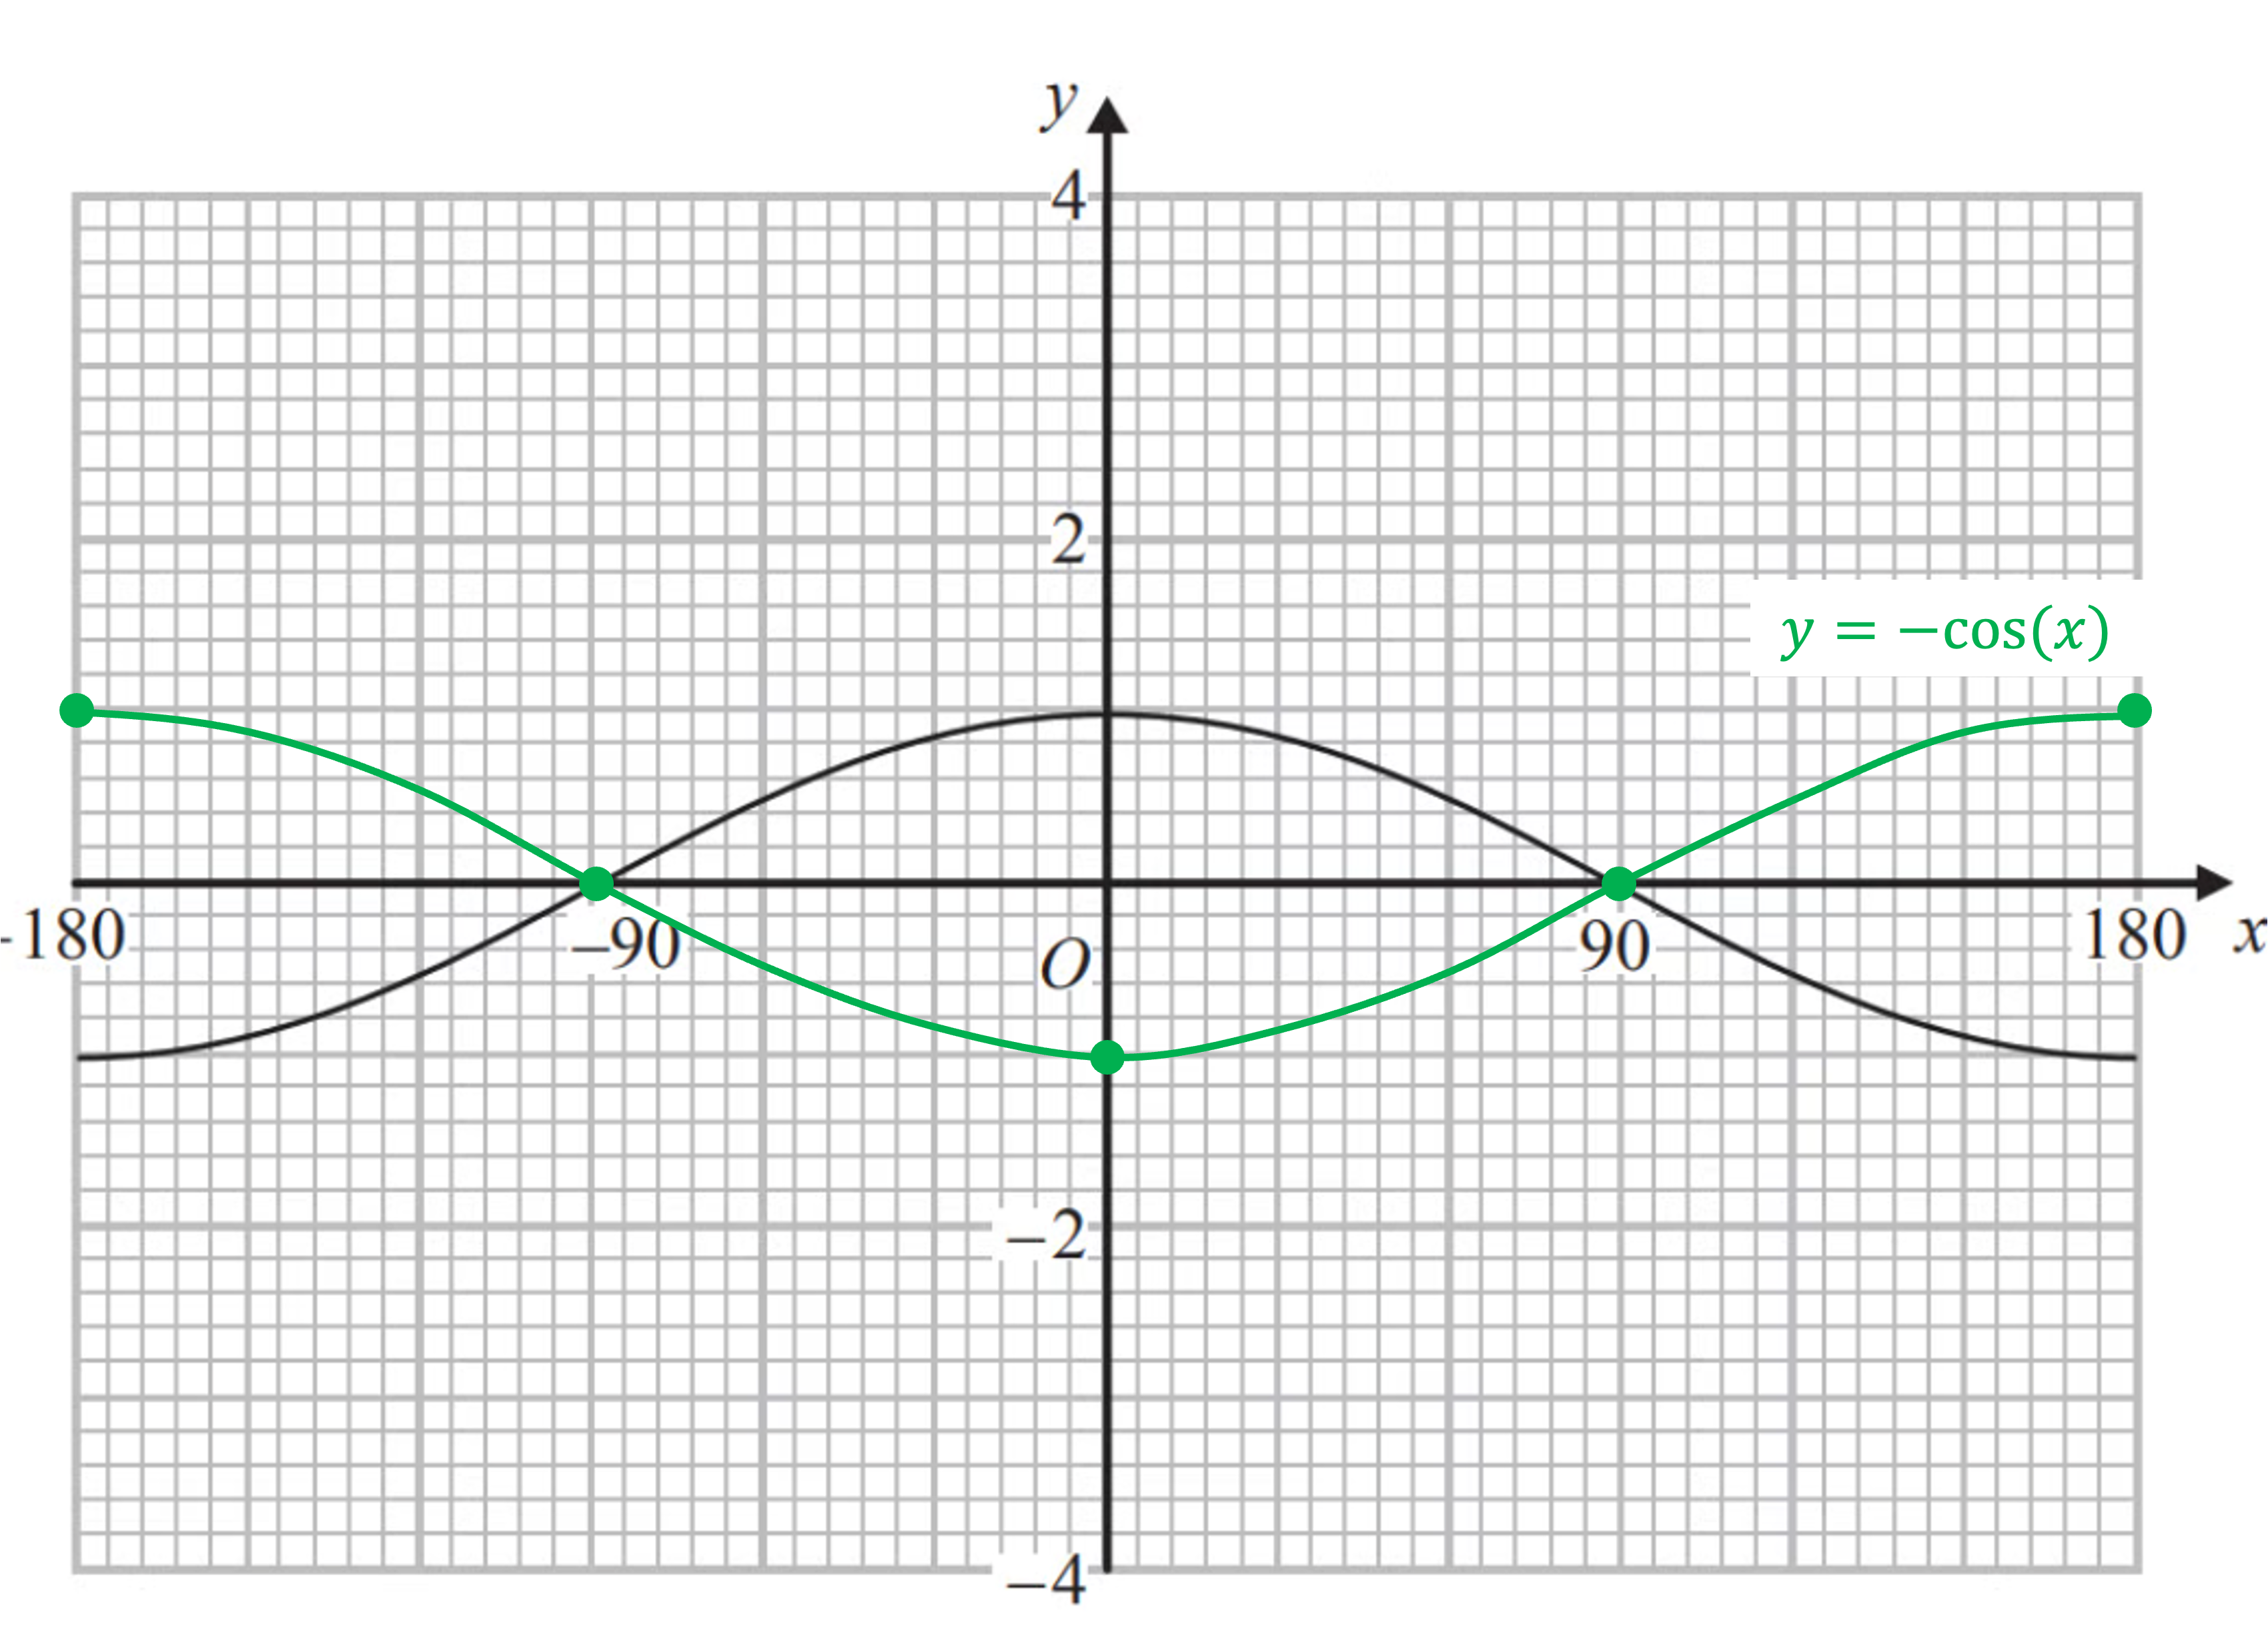
(a) On the same graph sketch y equals negative cos open parentheses x degree close parentheses.


y = −cos(x) is a reflection in the x-axis
Reflect key points first- x-intercepts, maximums and minimums as shown below
owBUL9Uh_ocr-7-graphs-transformations-reflections2

(Notice that points on the x-axis don't change during a reflection in the x-axis. They are invariant)

Now join your new points with a curved line. The new curve should go through the key points shown in the answer below
opoC1b2h_ocr-7-graphs-transformations-reflections3


(b) Comment on the graph of y equals cos open parentheses negative x degree close parentheses in relation to the graph of y equals cos open parentheses x degree close parentheses.


y = cos(−x) is a reflection in the y-axis. If we reflect y=cos(x) in the y-axis it maps exactly onto itself

They are the same graph

Worked Example

The graph of y equals x squared is reflected in the x-axis and translated 3 units to the left.
Write down an equation of the translated graph.


"Reflected in the x-axis" leads to 

y equals negative x squared

And "translated 3 units left" leads to 

Error converting from MathML to accessible text.

You've read 0 of your 5 free revision notes this week

Sign up now. It’s free!

Join the 100,000+ Students that ❤️ Save My Exams

the (exam) results speak for themselves:

Did this page help you?

Mark Curtis

Author: Mark Curtis

Expertise: Maths

Mark graduated twice from the University of Oxford: once in 2009 with a First in Mathematics, then again in 2013 with a PhD (DPhil) in Mathematics. He has had nine successful years as a secondary school teacher, specialising in A-Level Further Maths and running extension classes for Oxbridge Maths applicants. Alongside his teaching, he has written five internal textbooks, introduced new spiralling school curriculums and trained other Maths teachers through outreach programmes.

Dan Finlay

Author: Dan Finlay

Expertise: Maths Lead

Dan graduated from the University of Oxford with a First class degree in mathematics. As well as teaching maths for over 8 years, Dan has marked a range of exams for Edexcel, tutored students and taught A Level Accounting. Dan has a keen interest in statistics and probability and their real-life applications.