Equations of Straight Lines (y = mx + c) (Edexcel GCSE Maths): Revision Note
Did this video help you?
Finding Equations of Straight Lines
What is the equation of a straight line?
The general equation of a straight line is y = mx + c where
m is the gradient
c is the y-intercept
The value where it cuts the y-axis
y = 5x + 2 is a straight line with
gradient 5
y-intercept 2
y = 3 - 4x is a straight line with
gradient -4
y-intercept 3
How do I find the equation of a straight line from a graph?
Find the gradient by drawing a triangle and using
Positive for uphill lines, negative for downhill
Read off the y-intercept from the graph
Where it cuts the y-axis
Substitute these values into y = mx + c
What if no y-intercept is shown?
If you can't read off the y-intercept
find any point on the line
substitute it into the equation
solve to find c
For example, a line with gradient 6 passes through (2, 15)
The y-intercept is unknown
Write y = 6x + c
Substitute in x = 2 and y = 15
15 = 6 × 2 + c
15 = 12 + c
Solve for c
c = 3
The equation is y = 6x + 3
What are the equations of horizontal and vertical lines?
A horizontal line has the equation y = c
c is the y-intercept
A vertical line has the equation x = k
k is the x-intercept
For example
y = 4
x = -2
Worked Example
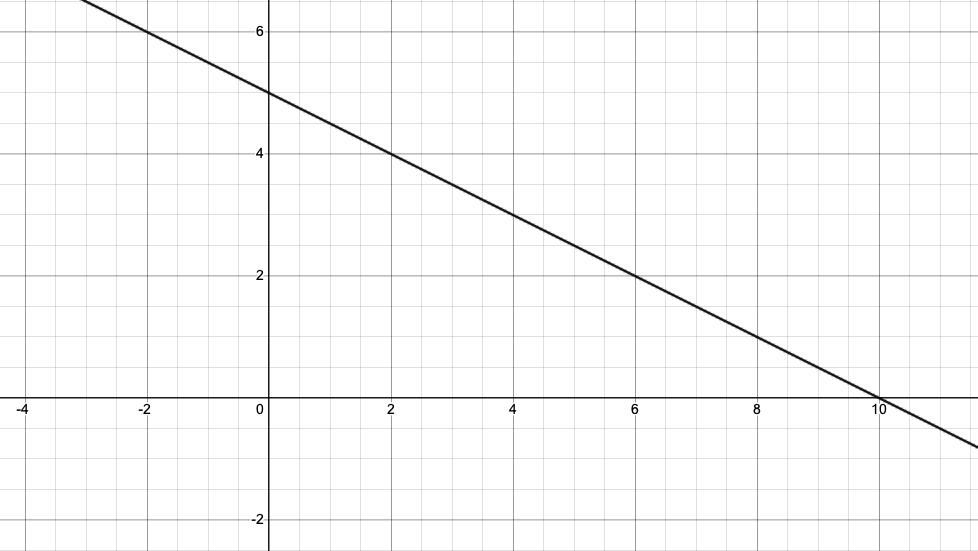
(a) Find the equation of the straight line shown in the diagram below.

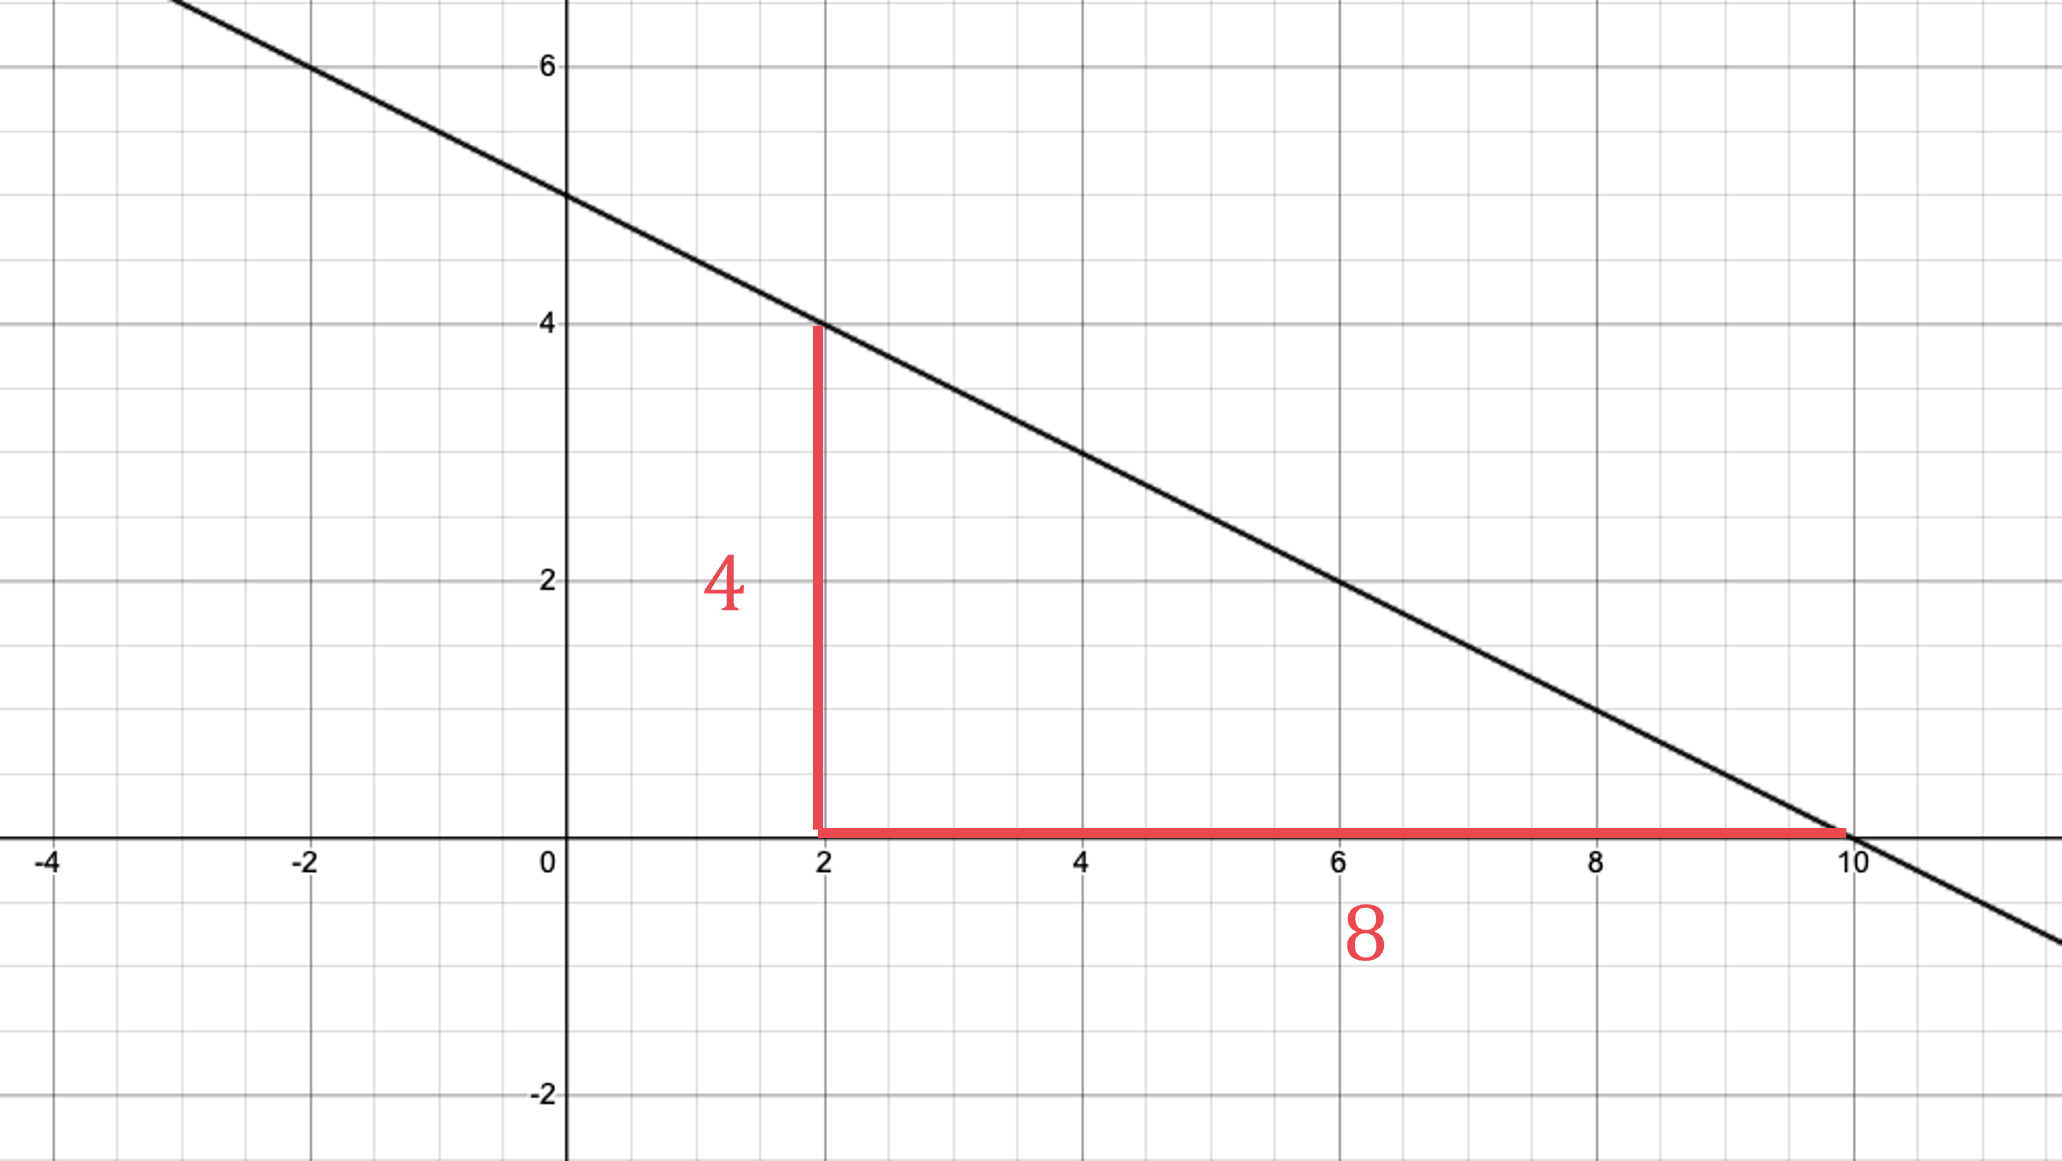
Find m, the gradient
Identify any two points the line passes through and work out the rise and run
Line passes through (2, 4) and (10, 0)

The rise is 4
The run is 8
Calculate the fraction
The slope is downward (downhill), so it is a negative gradient
gradient,
Now find the y-intercept
The line cuts the y-axis at 5
y-intercept,
Substitute the gradient, m, and the y-intercept, c, into y = mx + c
(b) Find the equation of the straight line with a gradient of 3 that passes through the point (5, 4).
Substitute m = 3 into y = mx + c
Leave c as an unknown letter
Substitute x = 5 and y = 4 into the equation
Solve the equation to find c
You now know c
Replace c with −11 to complete the equation of the line
y = 3x − 11

You've read 0 of your 5 free revision notes this week
Sign up now. It’s free!
Did this page help you?

