Finding Inequalities from Regions (Edexcel GCSE Maths) : Revision Note
Did this video help you?
Interpreting Graphical Inequalities
How do I know which inequalities are shown on a graph of shaded regions?
To identify the inequalities represented by the shaded regions on a graph:
Find the equation of each line on the graph
You may have to calculate the gradient and find the y-intercept to use
Vertical lines have the form
Horizontal lines have the form
Remember that lines are drawn using:
a solid line for ≤ or ≥, indicating a line included in the region
a dotted line for < or >, indicating a line not included in the region
Replace the = sign with the relevant inequality
≤ or < if region is below line
≥ or > if region is above line
(Use a point to test if not sure)
Examiner Tips and Tricks
Always read the question carefully to see if the diagram shades the wanted region or the unwanted region.
Worked Example
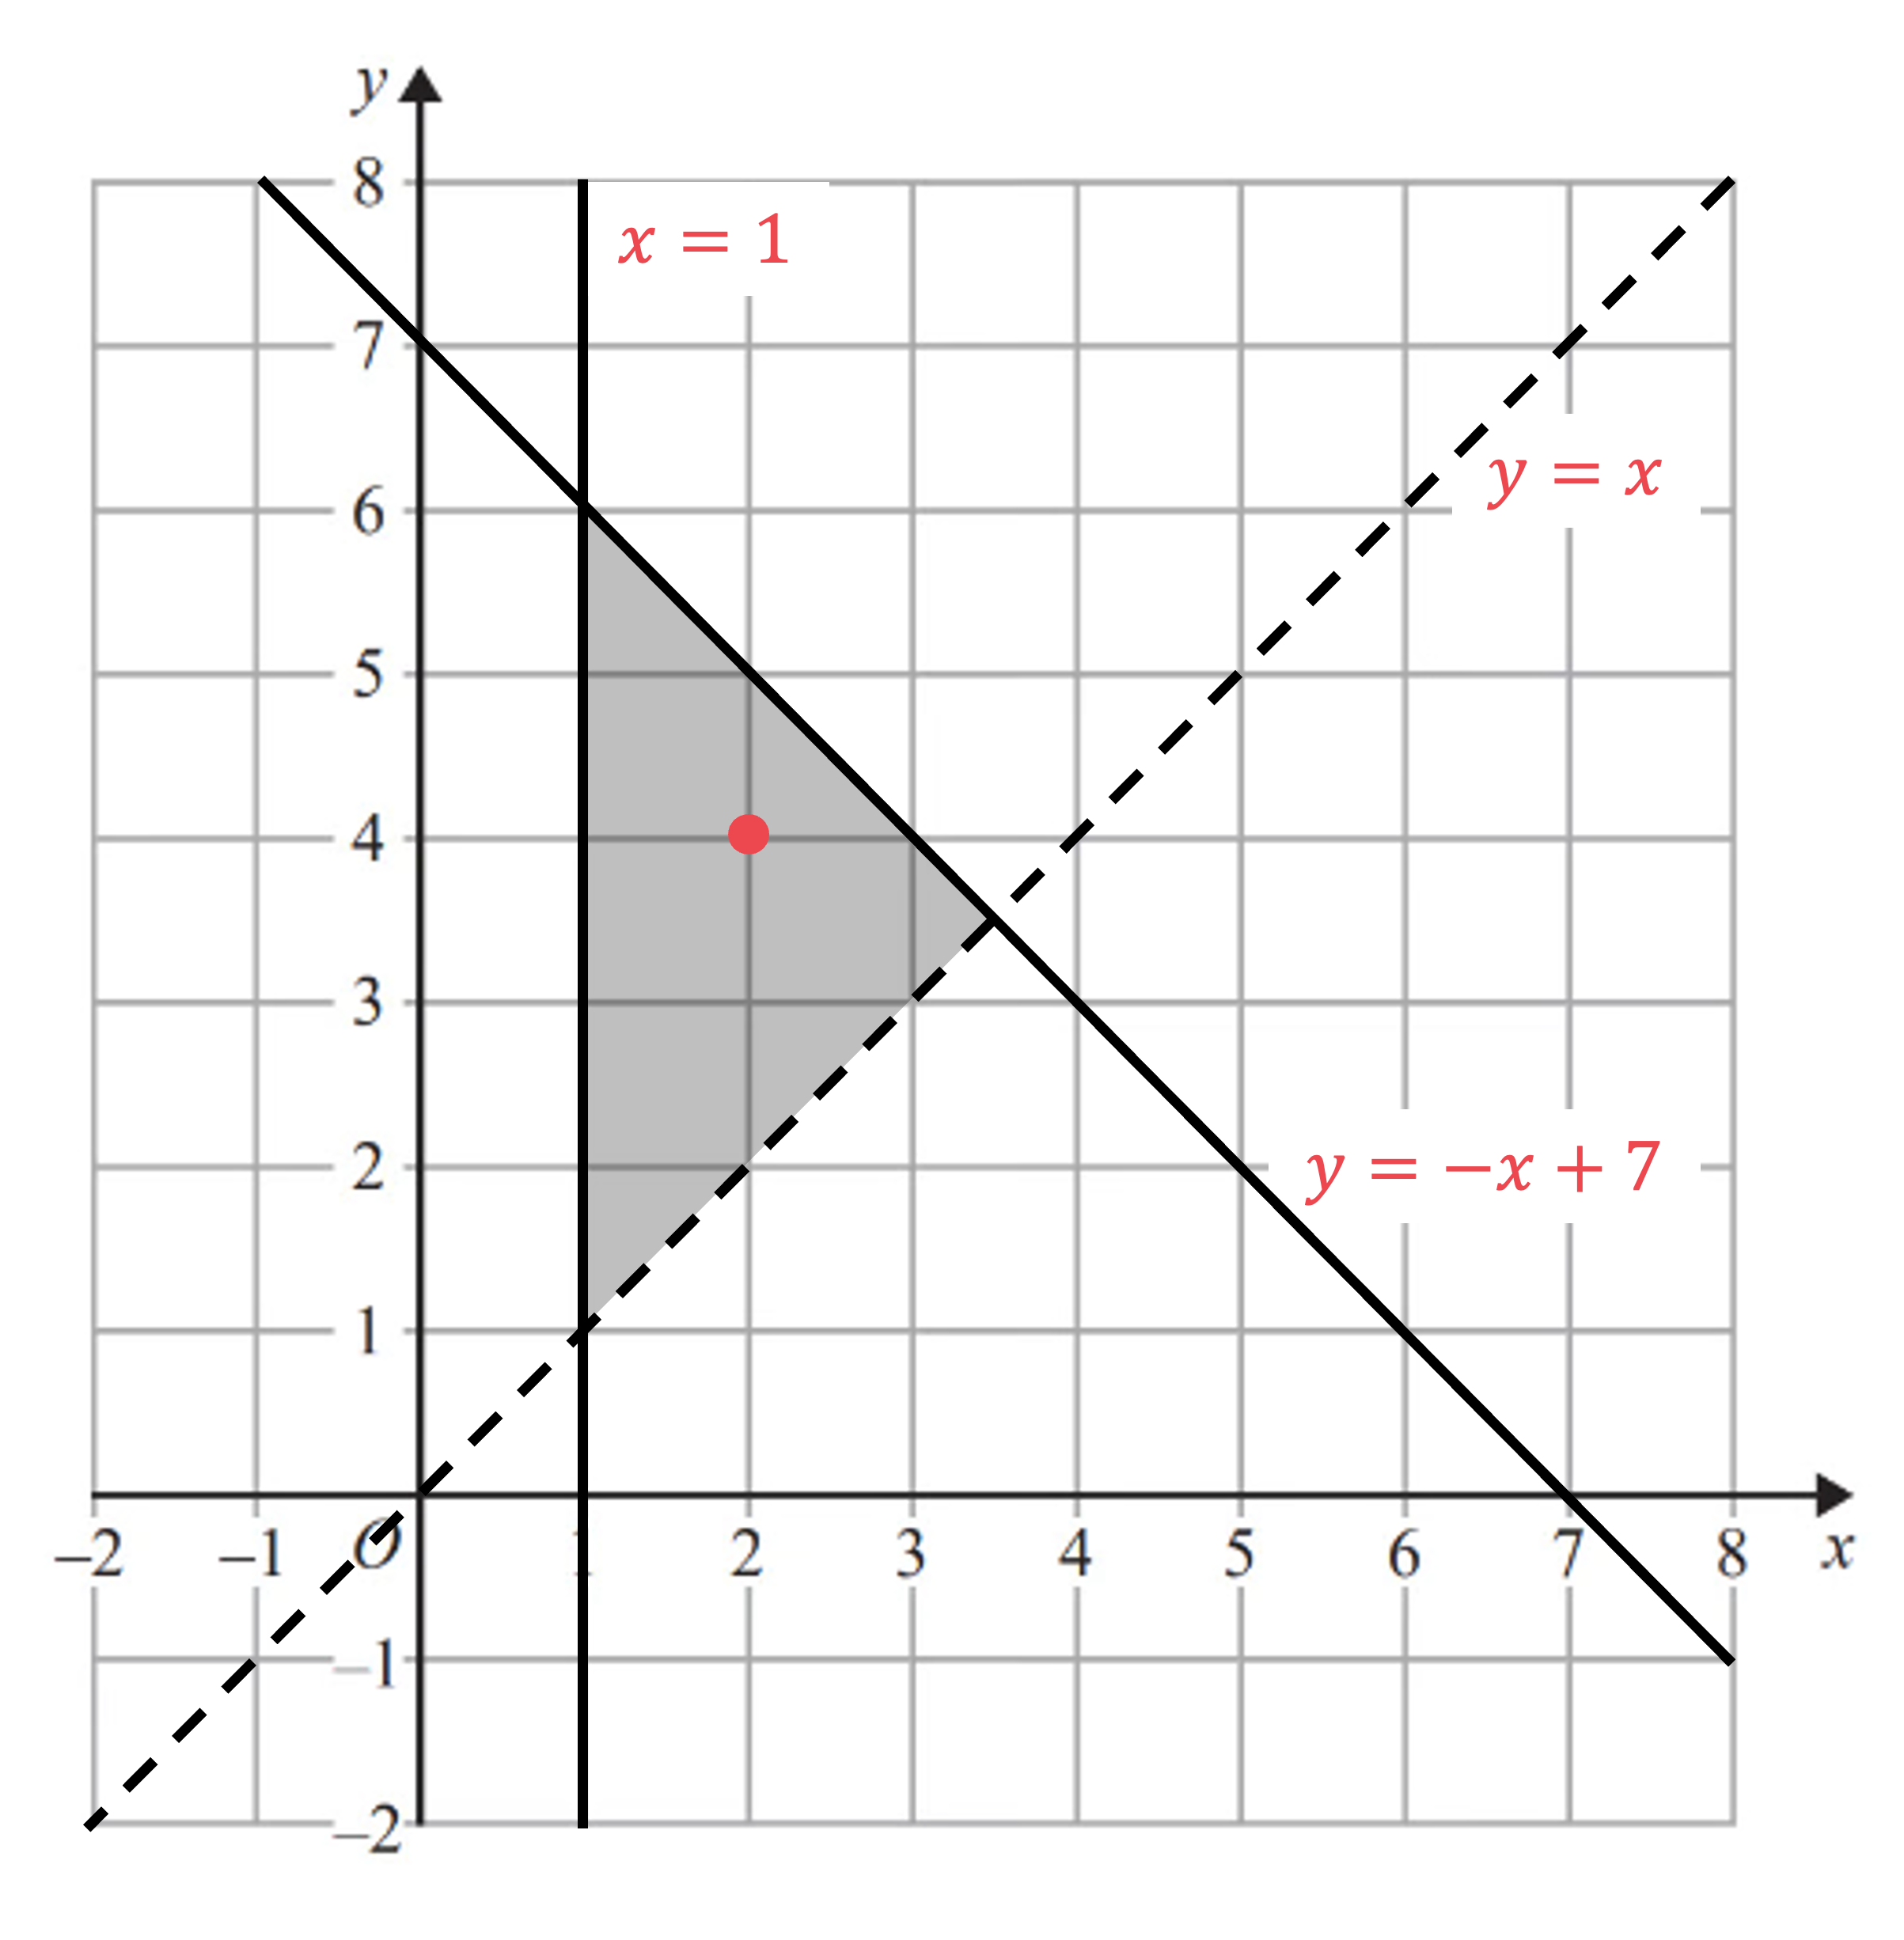
Write down the three inequalities which define the shaded region shown on the axes below.

Find the equations of the three lines shown (ignoring inequality signs for now)
You may be able to see the lines and
The other line has the form with y-intercept 7 and gradient -1

Now decide which inequality signs to use
For , the shaded region is above the line, and the line is dotted, so the inequality is
If unsure, check by substituting in coordinates from the shaded region
For example, using (2, 4) as marked on the graph above
"" is true, so the inequality
is correct
For , the shaded region is below the line, and the line is solid, so the inequality is
Again, check by substituting (2, 4) into the inequality
"" is true, so the inequality
is correct
For , the shaded region is to the right of the solid line so the inequality is
Write all three inequalities together as your final answer
,
and

You've read 0 of your 5 free revision notes this week
Sign up now. It’s free!
Did this page help you?

