Frequency Trees (AQA GCSE Maths) : Revision Note
Frequency Trees
What are frequency trees?
Frequency trees show the frequencies associated with two properties of a set of data
They are usually used when each property only has two possible outcomes
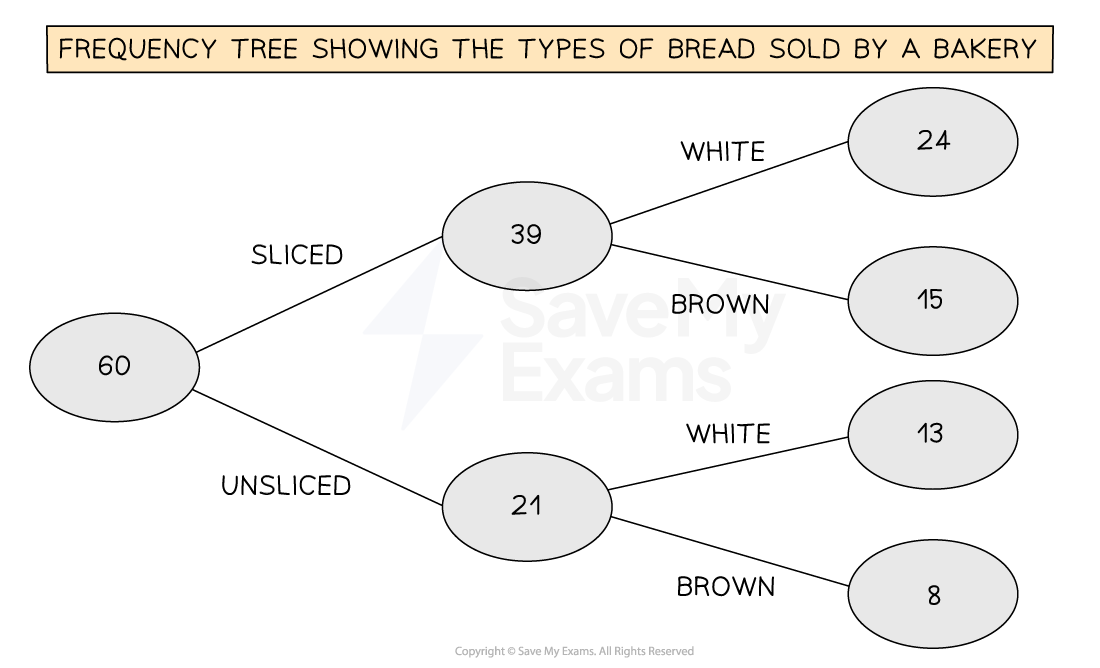
For example the types of bread sold by a bakery in a day
The first property could be if the bread is sliced or unsliced
The second property could be if the bread is white or brown
A frequency tree shows the frequency for each combination
e.g how many sliced, white loaves of bread were sold
The total frequency appears in a 'bubble' at the start of a frequency tree
The first set of branches then break this down by the two outcomes for the first property
The second set of branches then further breaks down each of those frequencies
It does not matter which set of branches shows which property
It is possible to have three, or more, properties on a frequency tree by adding more sets of branches
However these would quickly become large and cumbersome
For situations with more than two options for a property, two-way tables are more useful
For example if the bread in the bakery could brown, white, or seeded

How do I draw a frequency tree?
If drawing a frequency tree from scratch
Identify the two properties
Decide which property to put on the first set of branches and which to put on the second set of branches
Remember to include a 'bubble' at the start for the total frequency and a 'bubble' at the end of each branch
Double check that the values at the ends of the branches, sum to the 'bubble' that they are connected to
How do I complete a frequency tree?
Often in an exam there will be a partially completed frequency tree
Check for any values in the question that you can use to fill in gaps
e.g. "A total of 100 people"
Remember that the values at the ends of the branches, sum to the 'bubble' that they are connected to
This should allow you to fill in any gaps that aren't revealed by the information in the question
How do I find probabilities from a frequency tree?
Similar to finding probabilities from two-way tables, you need to select the appropriate numbers from the diagram
It can help to rephrase the question to use AND & OR statements
e.g. The probability of selecting a loaf of sliced white bread is P("sliced AND white")
Use the branches to help select the values you need to write down the probability
For "sliced AND white" this would be the along the branch saying 'sliced' on the first property and 'white' on the second
The value in the bubble at the end of the required branch(es) would be the numerator
The denominator will be the total of the group we are choosing from
This could be the whole group - the total frequency at the start of the diagram
Or if we are finding a probability from just sliced loaves, it would be the frequency in the bubble at the end of the 'sliced' branch
You may need to add together values
e.g. To find the total number of white loaves of bread sold, sum together the sliced white loaves and the unsliced white loaves
Examiner Tips and Tricks
Double check that the values at the ends of the tree add up to the starting value
Some of the frequencies may be given as fractions or percentages of others
e.g. 65% of the loaves of bread sold were sliced
Worked Example
80 students are learning how to DJ. There are two courses; scratch mixing, and beat mixing.
60% of the students are studying scratch mixing, the rest are studying beat mixing.
Of those studying scratch mixing, 15 are female.
Of those studying beat mixing, 12 are male.
(a) Use the information above to complete the frequency tree.

Start with the total frequency bubble at the start of the frequency tree - 80.
Work out 60% of 80 to find the frequency for scratch mixing.
Work your way through the rest of the tree.
beat:
We are given that 15 of those studying scratch mixing are female and that 12 of those studying beat mixing are male.
scratch and female:
beat and female:
Now we have all the values, we can complete the frequency tree.
Check the bubble totals: 48 + 32 = 80, 33 + 15 + 12 + 20 = 80
(b)
(i) A student is chosen at random. Find the probability that the student is a male studying beat mixing.
(ii) A student studying scratch mixing is chosen at random. Find the probability that the they are female.
(i)
Rephrasing this is P("male AND beat mixing").
The numerator will be the value in the bubble at the end of the branches "beat mixing" and "male" (12).
We are choosing from all of the students, so the denominator will be the total frequency (80).
(ii)
Rephrasing this is P("female AND scratch mixing").
The numerator will be the value in the bubble at the end of the branches "scratch mixing" and "female" (15).
This time though we are only choosing from those studying scratch mixing, so the denominator will be at the end of the scratch mixing branch (48).

You've read 0 of your 5 free revision notes this week
Sign up now. It’s free!
Did this page help you?
