Finding Gradients of Tangents (AQA GCSE Maths) : Revision Note
Finding Gradients of Tangents
How are the gradients of graphs and tangents related?
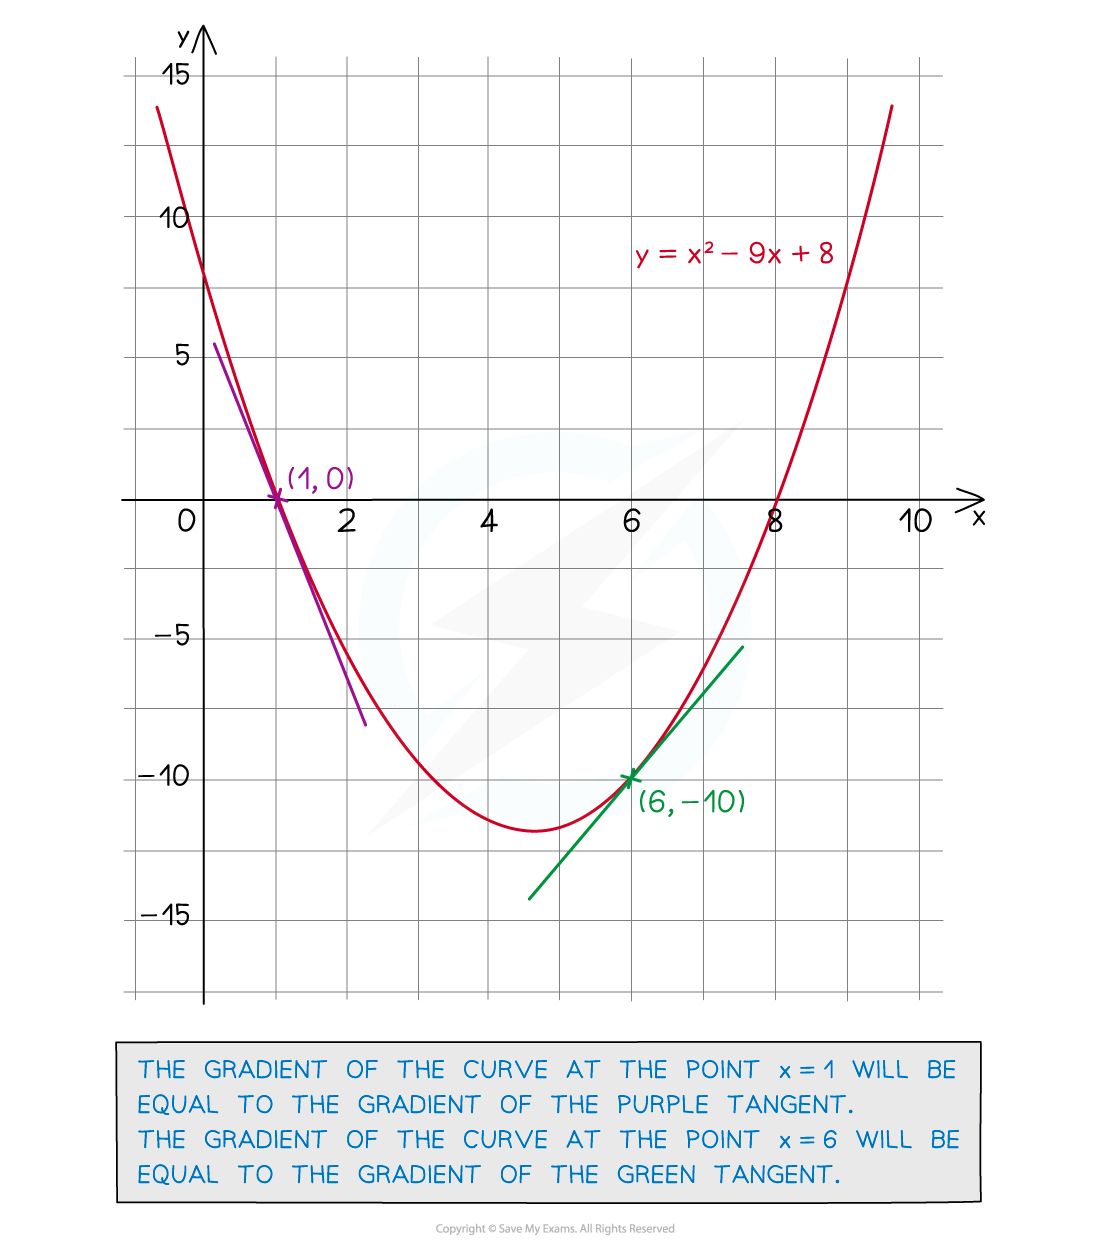
The gradient of a graph at a point is equal to the gradient of the tangent to the curve at that point
A tangent is a line that touches a curve, but does not cross it

How do I estimate the gradient of a curve using a tangent?
To find an estimate for the gradient of a curve at a point:
Draw a tangent to the curve at the point
Find the gradient of the tangent using
Gradient = rise ÷ run
or difference in y ÷ difference in x
In the example below, the gradient of the tangent at x = 4 would be
Remember that the rise is negative if it is going down
This means the gradient of the curve at x = 4 is also -0.625

It is an estimate because the tangent has been drawn by eye and is not exact
To find the exact gradient we would need to use differentiation
What does the gradient represent?
The gradient represents the rate of change of y with x
I.e. For every increase in x by 1, how much does y increase?
Consider the quantities used for the axes to determine the meaning of the gradient
In a distance-time graph, the gradient is the rate of change of distance with time
This is the speed
In a speed-time graph, the gradient is the rate of change of speed with time
This is the acceleration
In a graph of volume against radius, e.g. as a balloon is inflated, the gradient is the rate of change of volume as the radius increases
Examiner Tips and Tricks
When drawing a tangent by hand:
Use a ruler
Draw the line as long as you can
When finding the gradient of the tangent:
Pick two points that are far away from one another
This will reduce the effect of any inaccuracy
Worked Example
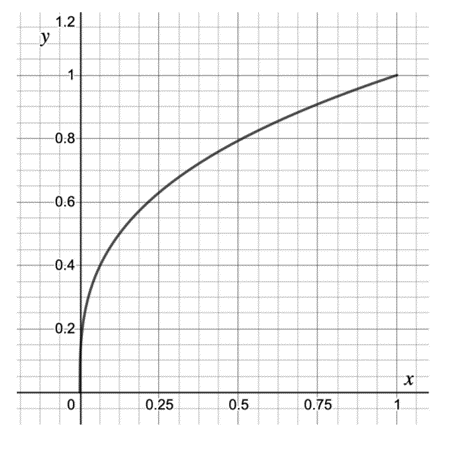
The graph below shows for
.
Find an estimate of the gradient of the curve at the point where .

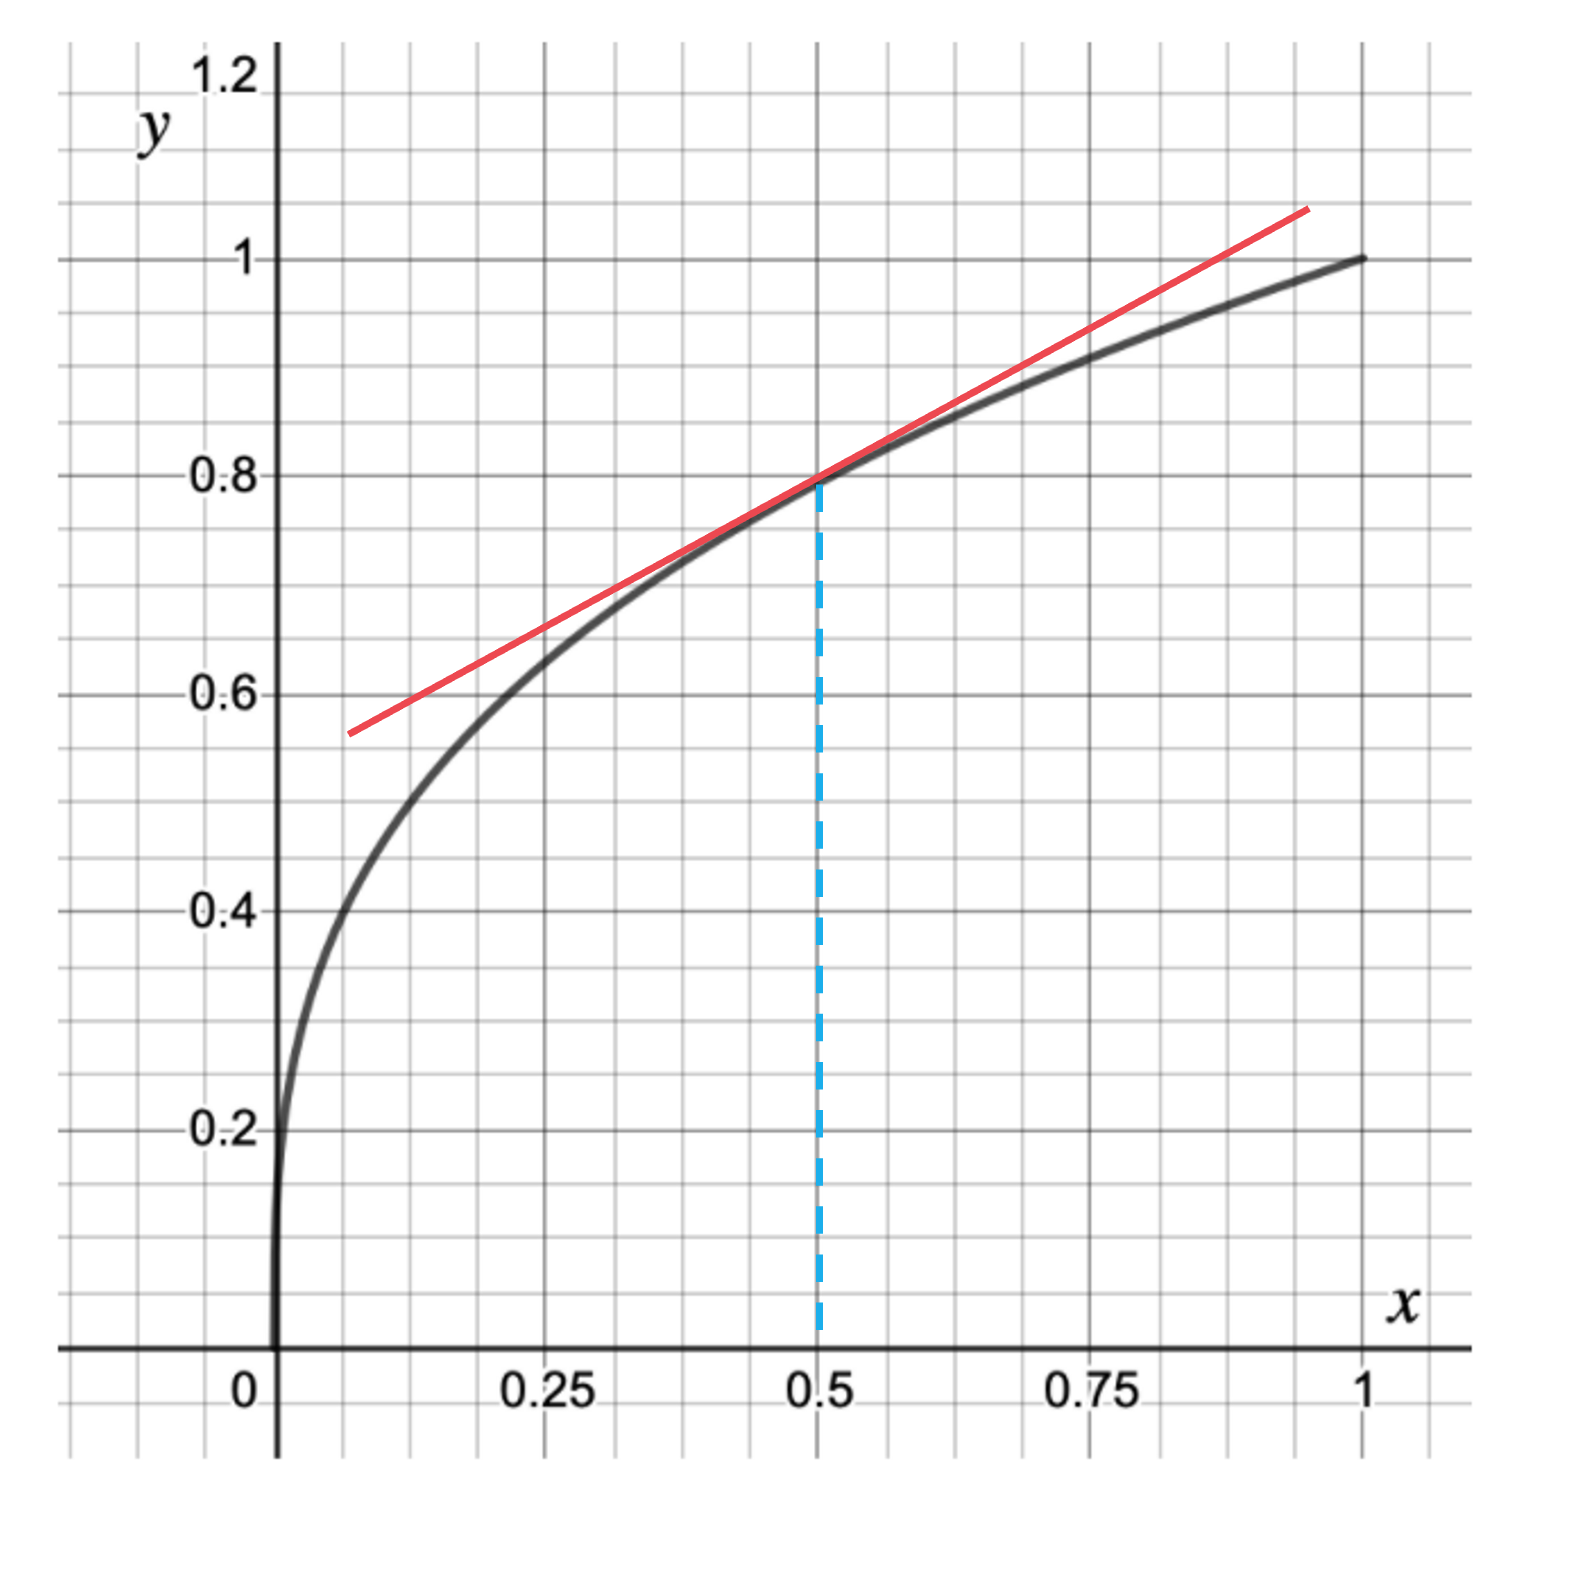
Draw a tangent to the curve at the point where x = 0.5

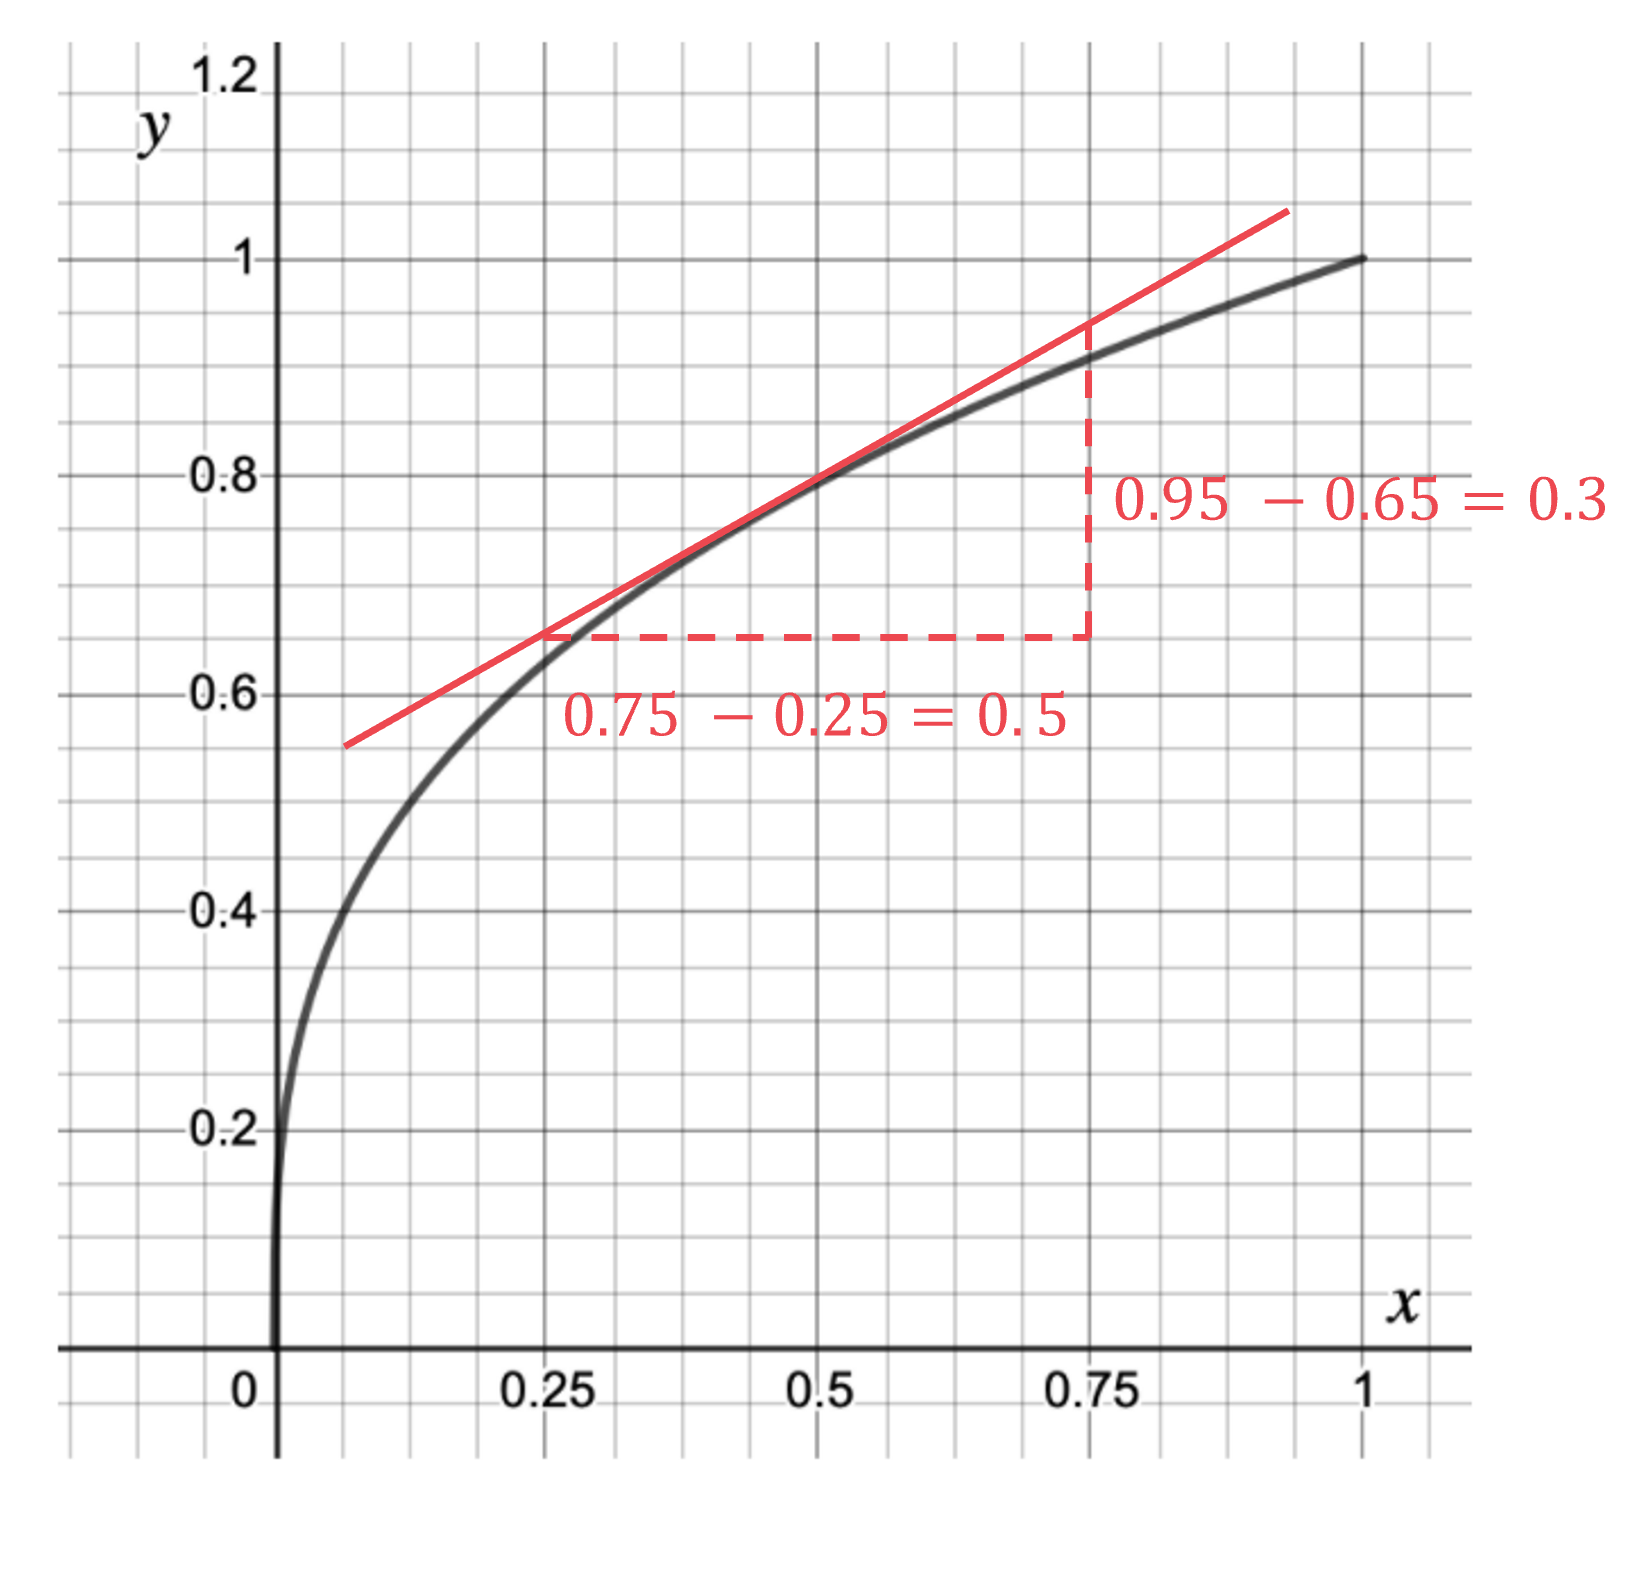
Find suitable, easy to read coordinates as far apart as possible and draw a right-angled triangle between them
Find the difference in the y coordinates (rise) and the difference in the x coordinates (run).

Find the gradient by dividing the difference in y (rise) by the difference in x
The gradient of the tangent at x = 0.5 is equal to the gradient of the curve at x = 0.5
Estimate of gradient = 0.6

You've read 0 of your 5 free revision notes this week
Sign up now. It’s free!
Did this page help you?

