Solving Equations using Graphs (AQA GCSE Further Maths) : Revision Note
Did this video help you?
Solving Equations using Graphs
How do we use graphs to solve equations?
Solutions are always read off the x-axis
Solutions of f(x) = 0 are where the graph of y = f(x) crosses the x-axis
If asked to use the graph of y = f(x) to solve a different equation (the question will say something like “by drawing a suitable straight line”) then:
Rearrange the equation to be solved into f(x) = mx + c and draw the line y = mx + c
Solutions are the x-coordinates of where the line (y = mx + c) crosses the curve (y = f(x))
E.g. if given the curve for y = x3 + 2x2 + 1 and asked to solve x3 + 2x2 − x − 1 = 0, then;
rearrange x3 + 2x2 − x − 1 = 0 to x3 + 2x2 + 1 = x + 2
draw the line y = x + 2 on the curve y = x3 + 2x2 + 1
read the x-values of where the line and the curve cross (in this case there would be 3 solutions, approximately x = -2.2, x = -0.6 and x = 0.8);

Note that solutions may also be called roots
Examiner Tips and Tricks
If solving an equation, give the x values only as your final answer
If solving a pair of linear simultaneous equations give an x and a y value as your final answer
If solving a pair of simultaneous equations where one is linear and one is quadratic, give two pairs of x and y values as your final answer
Worked Example
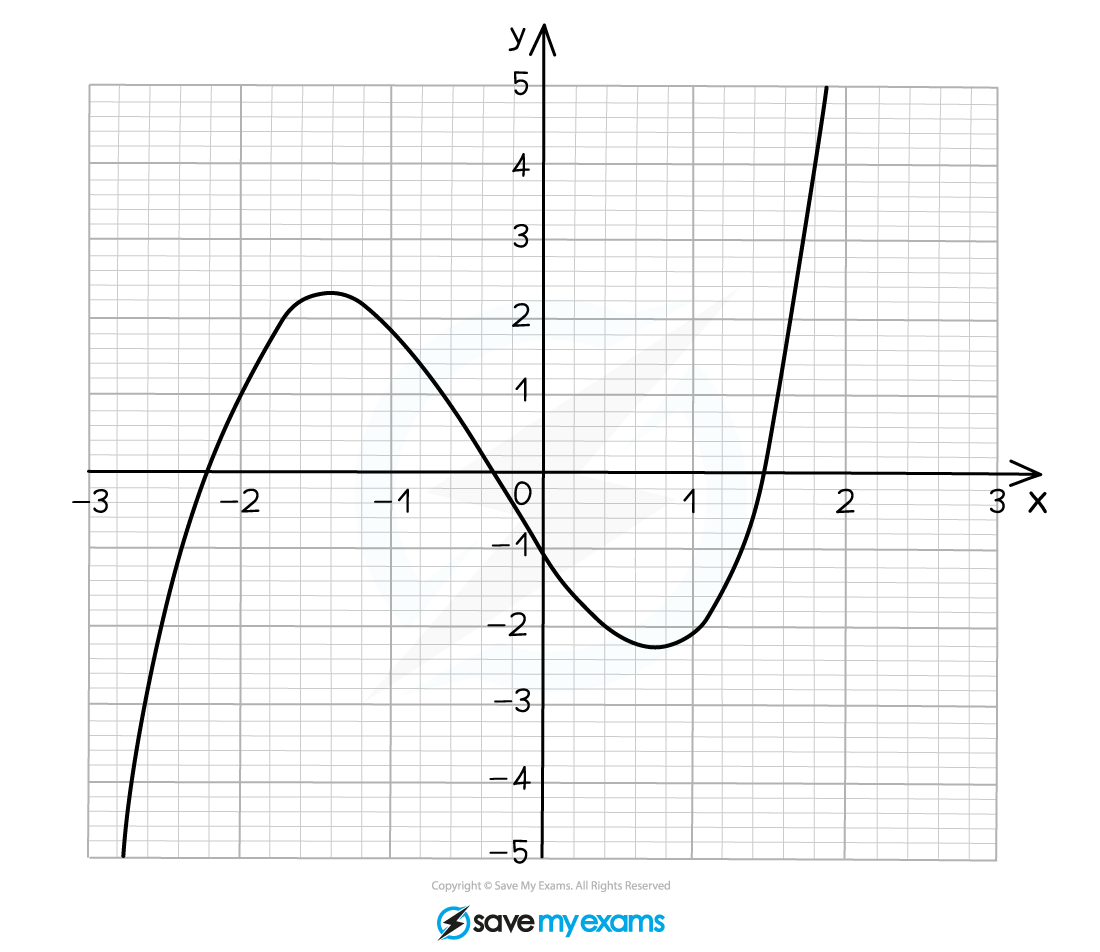
The graph of is shown below.
Use the graph to estimate the solutions of the equation . Give your answers to 1 decimal place.

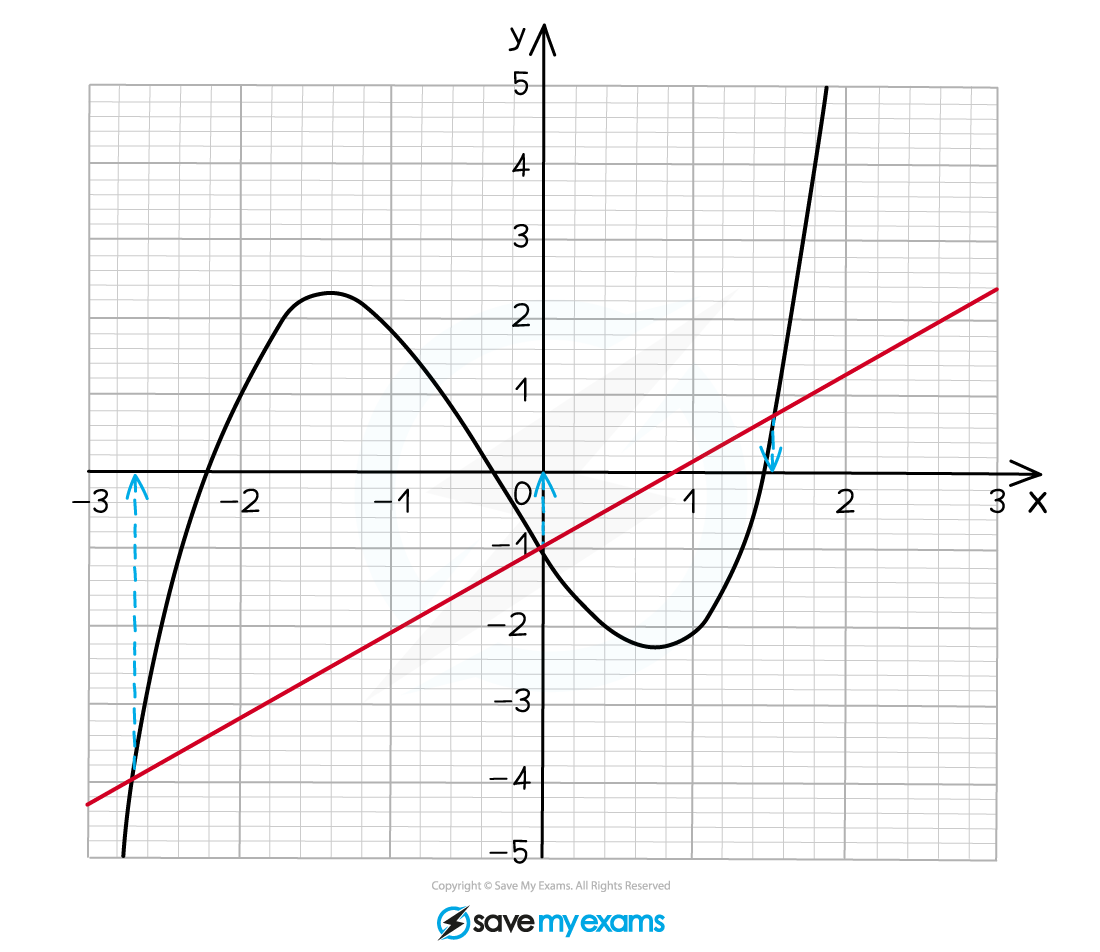
We are given a different equation to the one plotted so we must rearrange it to (where
is the plotted graph)
Now plot on the graph- this is the solid red line on the graph below

The solutions are the coordinates of where the curve and the straight line cross so

You've read 0 of your 5 free revision notes this week
Sign up now. It’s free!
Did this page help you?

