Quadratic & Polynomial Graphs (AQA GCSE Further Maths): Revision Note
Exam code: 8365
Quadratic graphs
A quadratic is a function of the form where
is not zero
They are a very common type of function in mathematics, so it is important to know their key features
What does a quadratic graph look like?
The shape made by a quadratic graph is known as a parabola
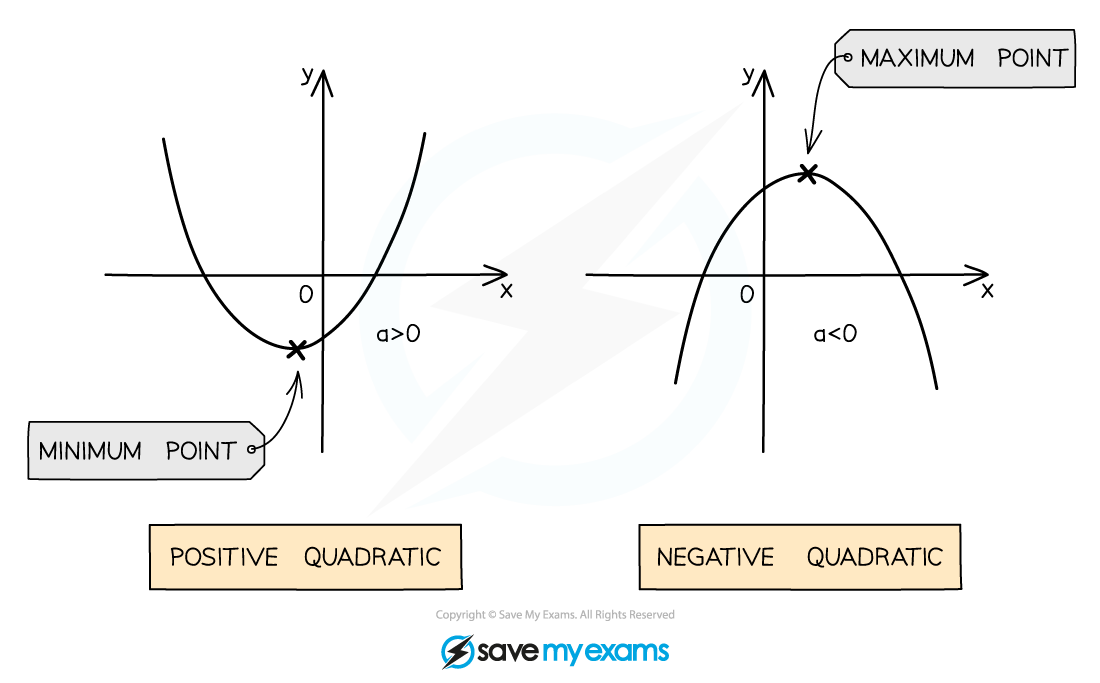
The parabola shape of a quadratic graph can either look like a “u-shape” or an “n-shape”
A quadratic with a positive coefficient of
will be a u-shape
A quadratic with a negative coefficient of
will be an n-shape
A quadratic will always cross the
-axis
A quadratic may cross the
-axis twice, once, or not at all
The points where the graph crosses the
-axis are called the roots
If the quadratic is a u-shape, it has a minimum point (the bottom of the u)
If the quadratic is an n-shape, it has a maximum point (the top of the n)
Minimum and maximum points are both examples of turning points
How do I sketch a quadratic graph?
We could create a table of values for the function and then plot it accurately, however we often only require a sketch to be drawn, showing just the key features
The most important features of a quadratic are
Its overall shape; a u-shape or an n-shape
Its
-intercept
Its
-intercept(s), these are also known as the roots
Its minimum or maximum point (turning point)
If it is a positive quadratic (
in
is positive) it will be a u-shape
If it is a negative quadratic (
in
is negative) it will be an n-shape
The
-intercept of
will be
The roots, or the
-intercepts will be the solutions to
;
You can solve a quadratic by factorising, completing the square, or using the quadratic formula
There may be 2, 1, or 0 solutions and therefore 2, 1, or 0 roots
The minimum or maximum point of a quadratic can be found by;
Completing the square
Once the quadratic has been written in the form
, the minimum or maximum point is given by
Be careful with the sign of the x-coordinate.
E.g. if the equation is
then the minimum point is
but if the equation is
then the minimum point is
Using differentiation
Solving
will find the
-coordinate of the minimum or maximum point
You can then substitute this into the equation of the quadratic to find the
-coordinate
Worked Example
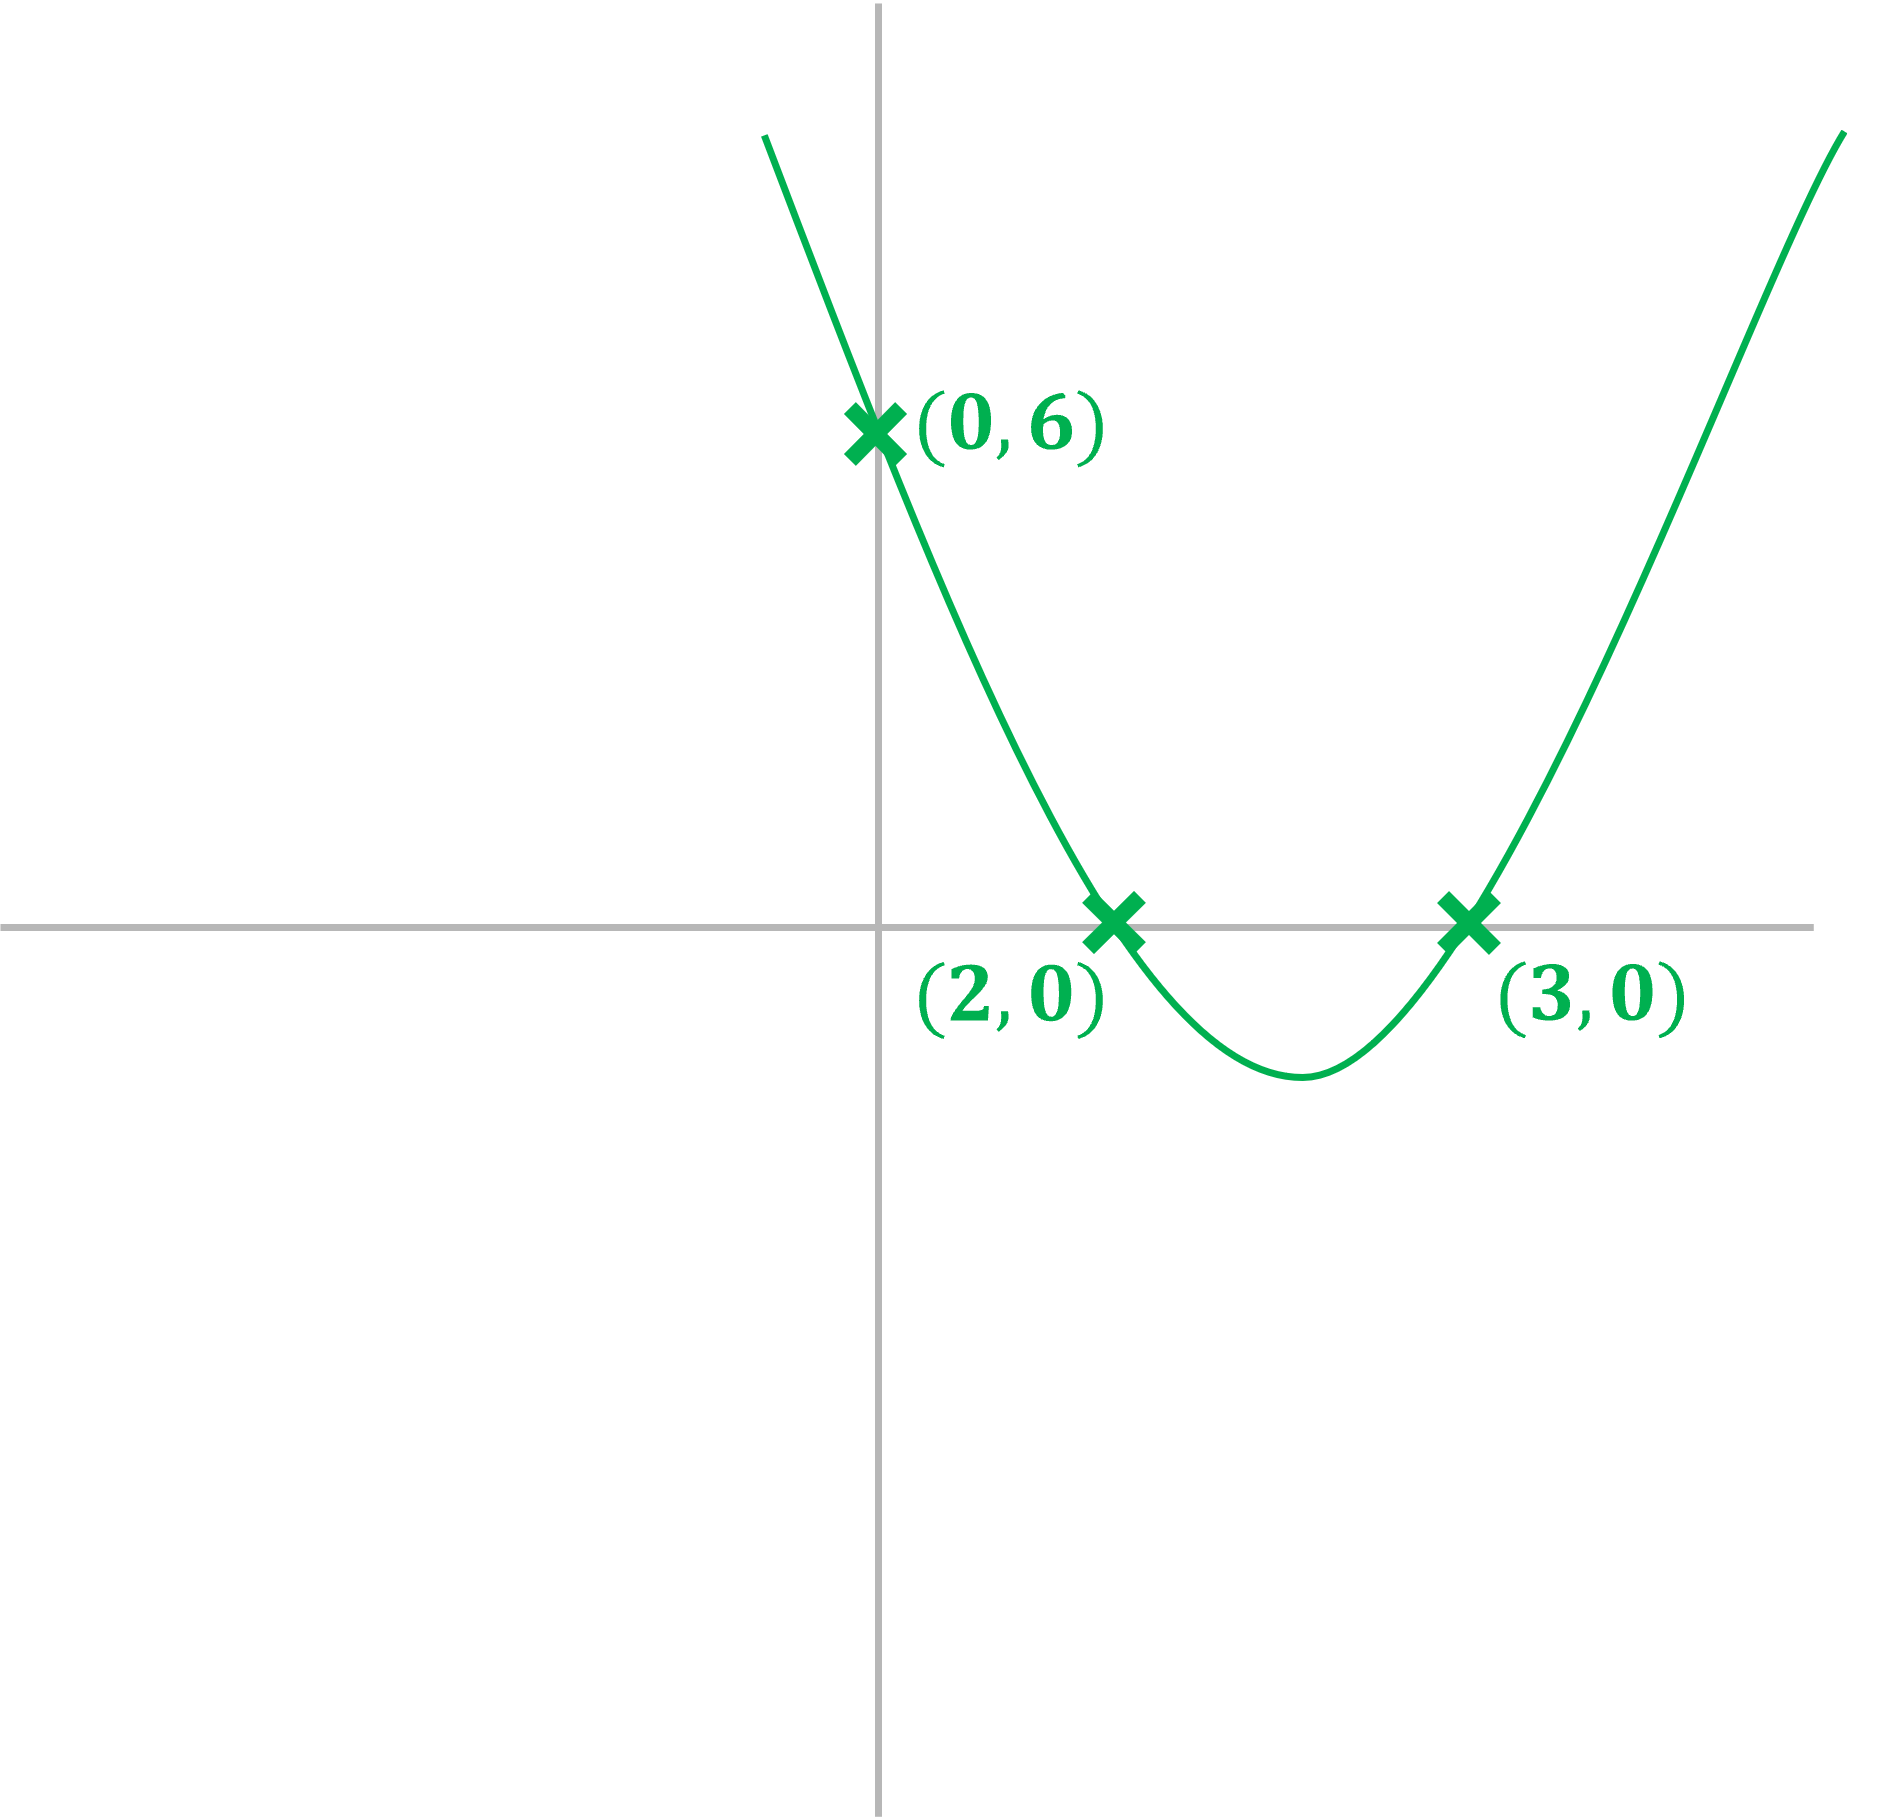
a) Sketch the graph of showing the
and
intercepts
It is a positive quadratic, so will be a u-shape
The at the end is the
-intercept, so this graph crosses the
-axis at (0,6)
Factorise
Solve
So the roots of the graph are
(2,0) and (3,0)
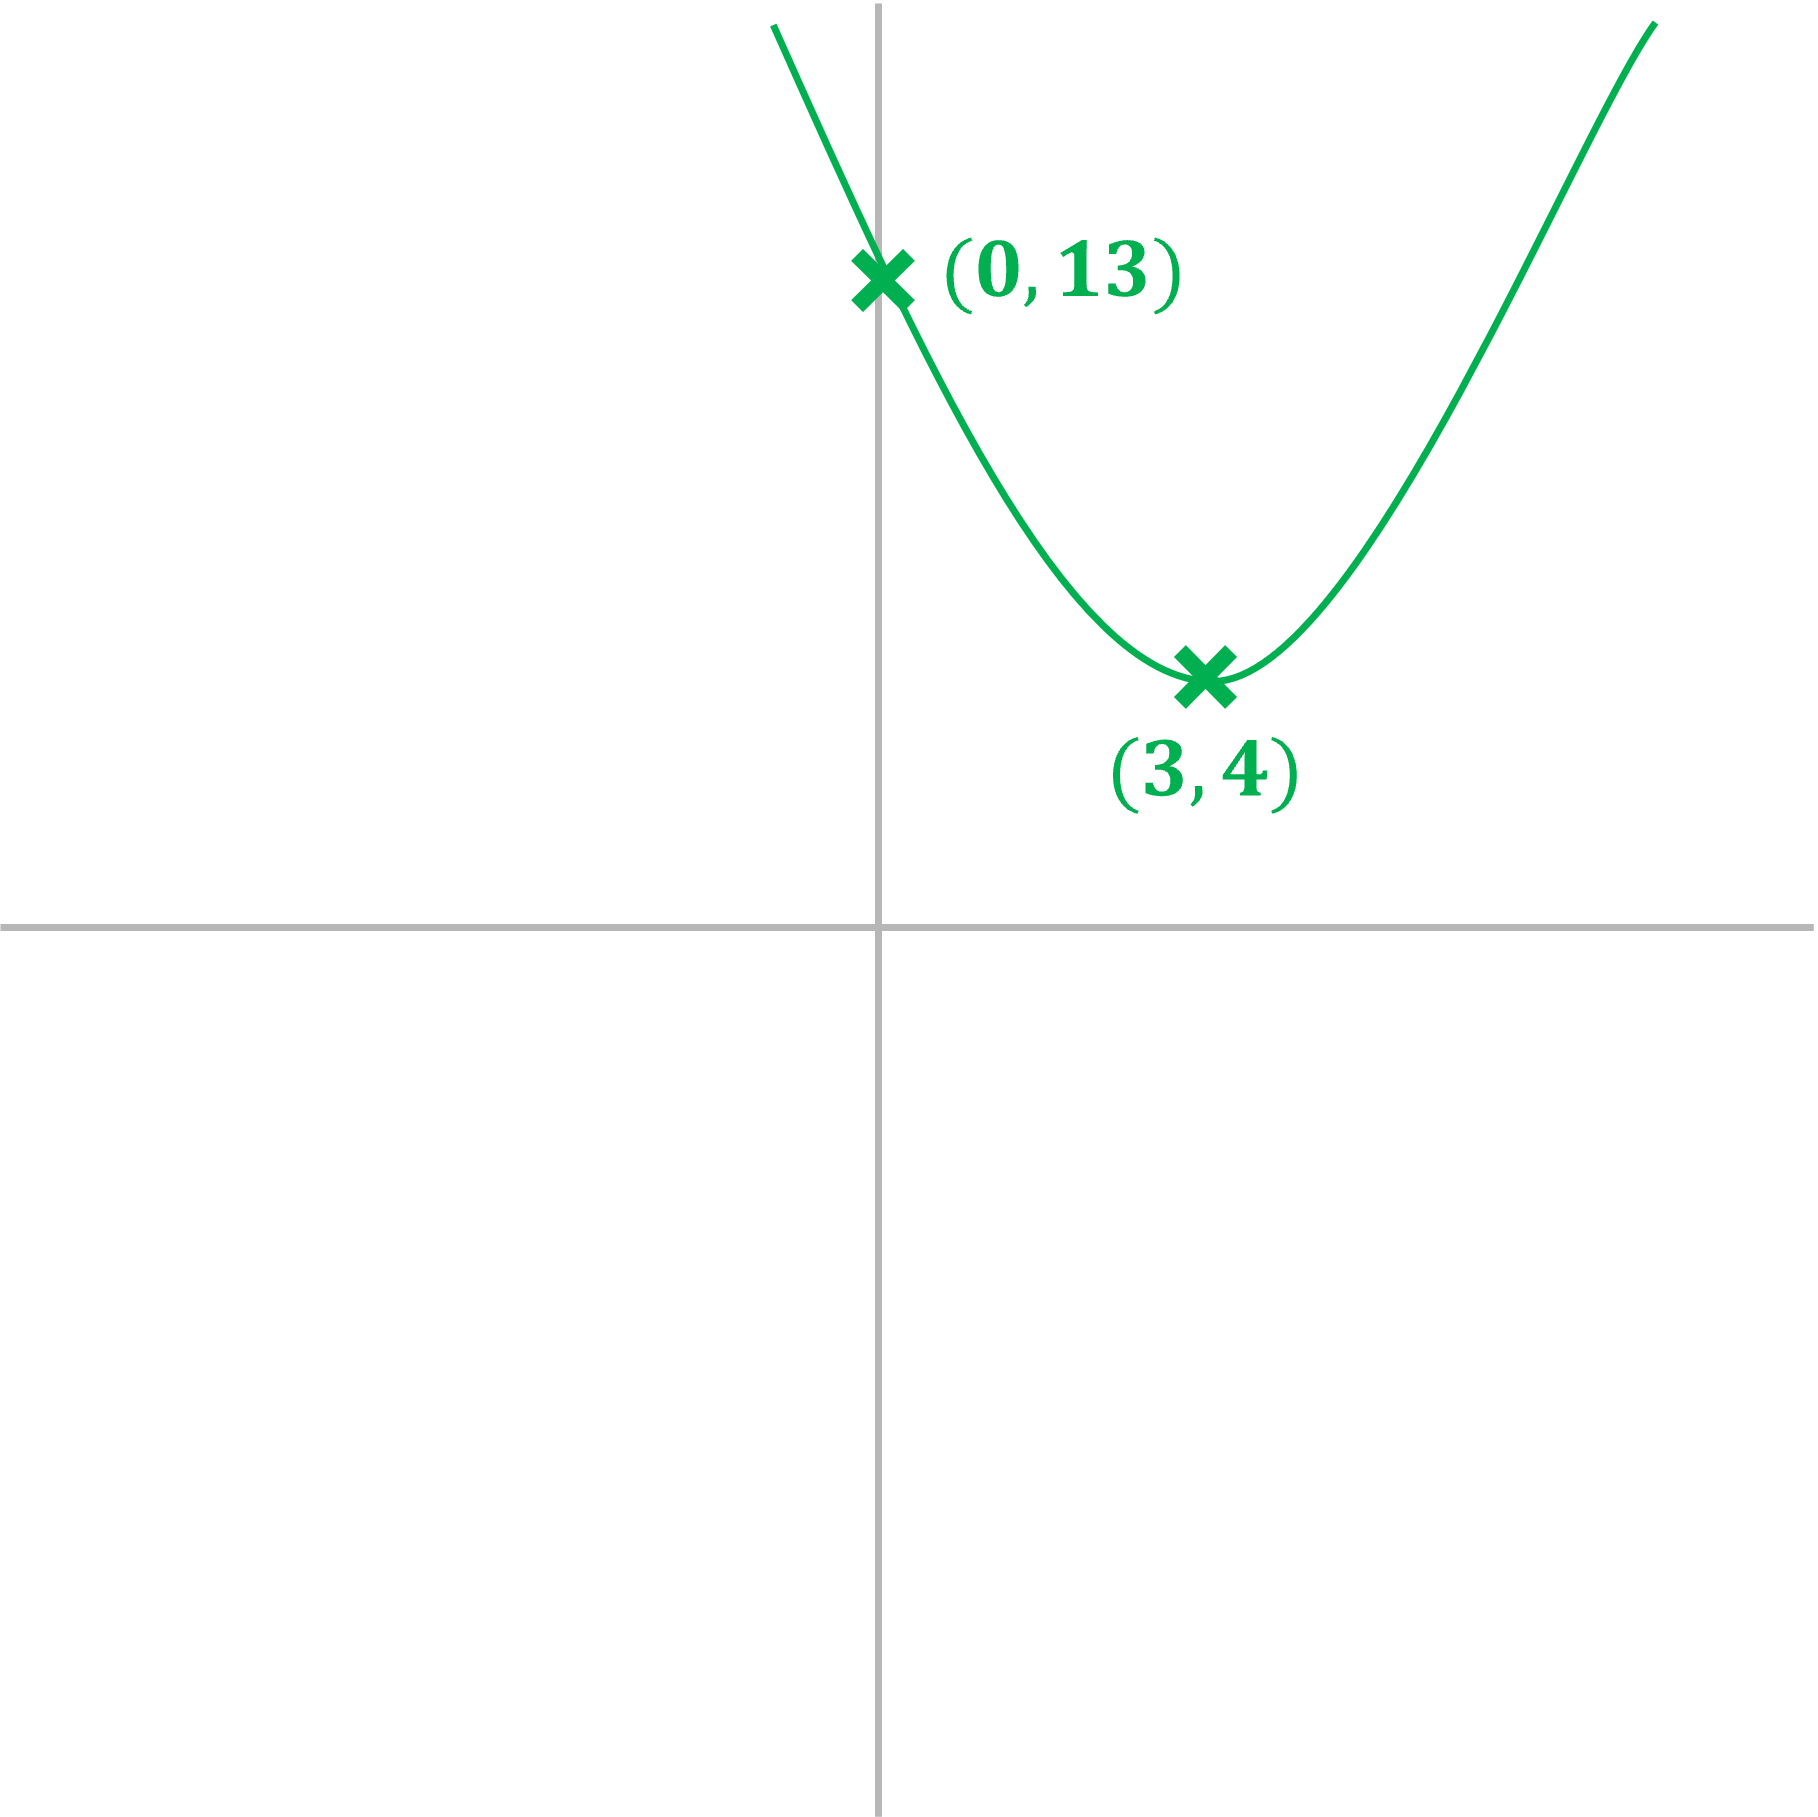
b) Sketch the graph of showing the
-intercept and the turning point
It is a positive quadratic, so will be a u-shape
The at the end is the
-intercept, so this graph crosses the y-axis at
(0,13)
We can find the minimum point (it will be a minimum as it is a positive quadratic) by completing the square:
This shows that the minimum point will be
(3,4)
As the minimum point is above the -axis, this means the graph will not cross the
-axis i.e. it has no roots
We could also show that there are no roots by trying to solve
If we use the quadratic formula, we will find that is the square root of a negative number, which is not a real number, which means there are no real solutions, and hence no roots
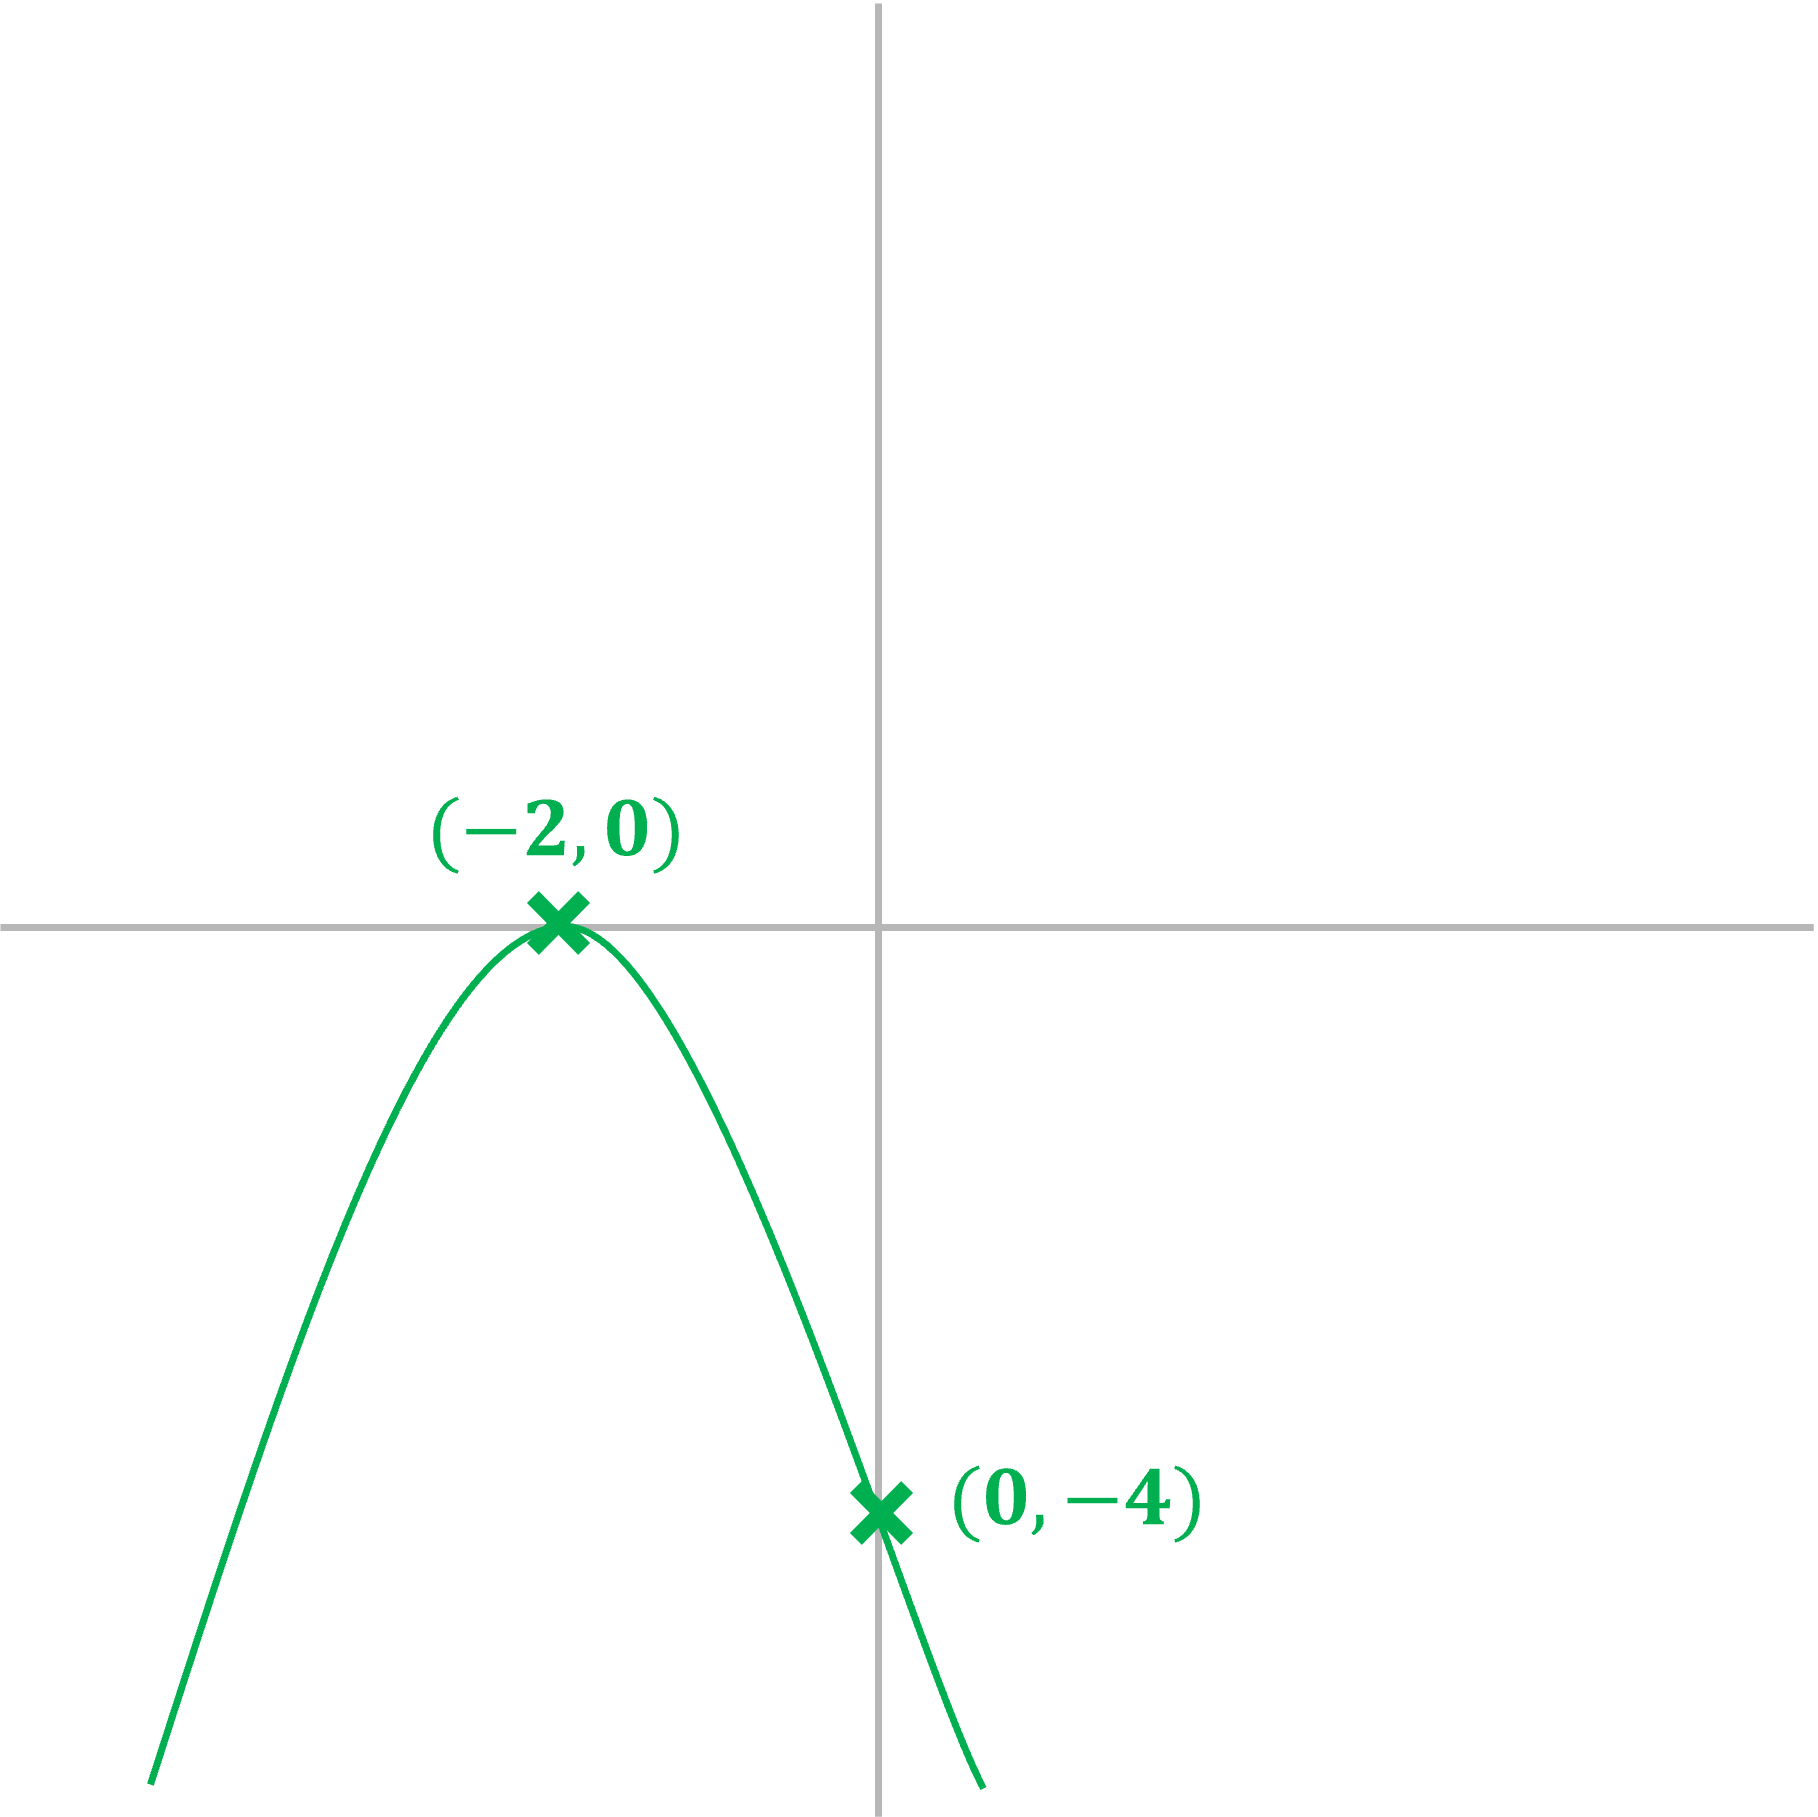
c) Sketch the graph of showing the root(s),
-intercept, and turning point
It is a negative quadratic, so will be an n-shape
The at the end is the
-intercept, so this graph crosses the
-axis at (0, -4)
We can find the maximum point (it will be a maximum as it is a negative quadratic) by completing the square:
This shows that the maximum point will be
(-2, 0)
As the maximum is on the -axis, there is only one root
We could also show that there is only one root by solving
If you use the quadratic formula, you will find that the two solutions for are the same number; in this case -2
Polynomial graphs
What is the graph of a polynomial?
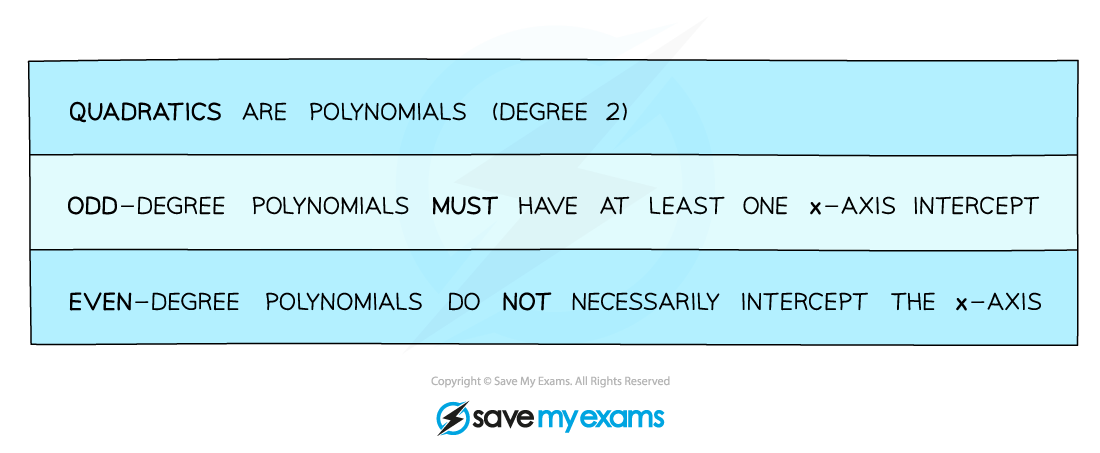
Remember a polynomial is any finite function with non-negative indices, that could mean a quadratic, cubic, quartic or higher power
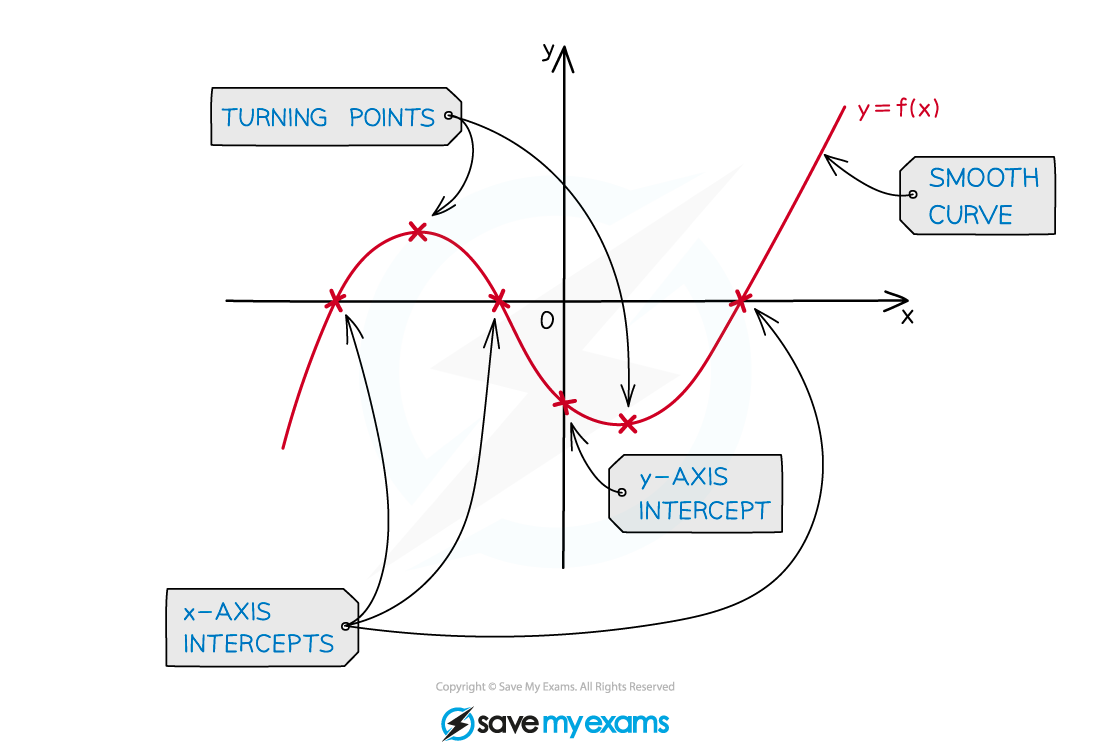
When asked to sketch a polynomial you'll need to think about the following
y-axis intercept
x-axis intercepts (roots)
turning points (maximum and/or minimum)
a smooth curve (this takes practice!)
How do I sketch a graph of a polynomial?
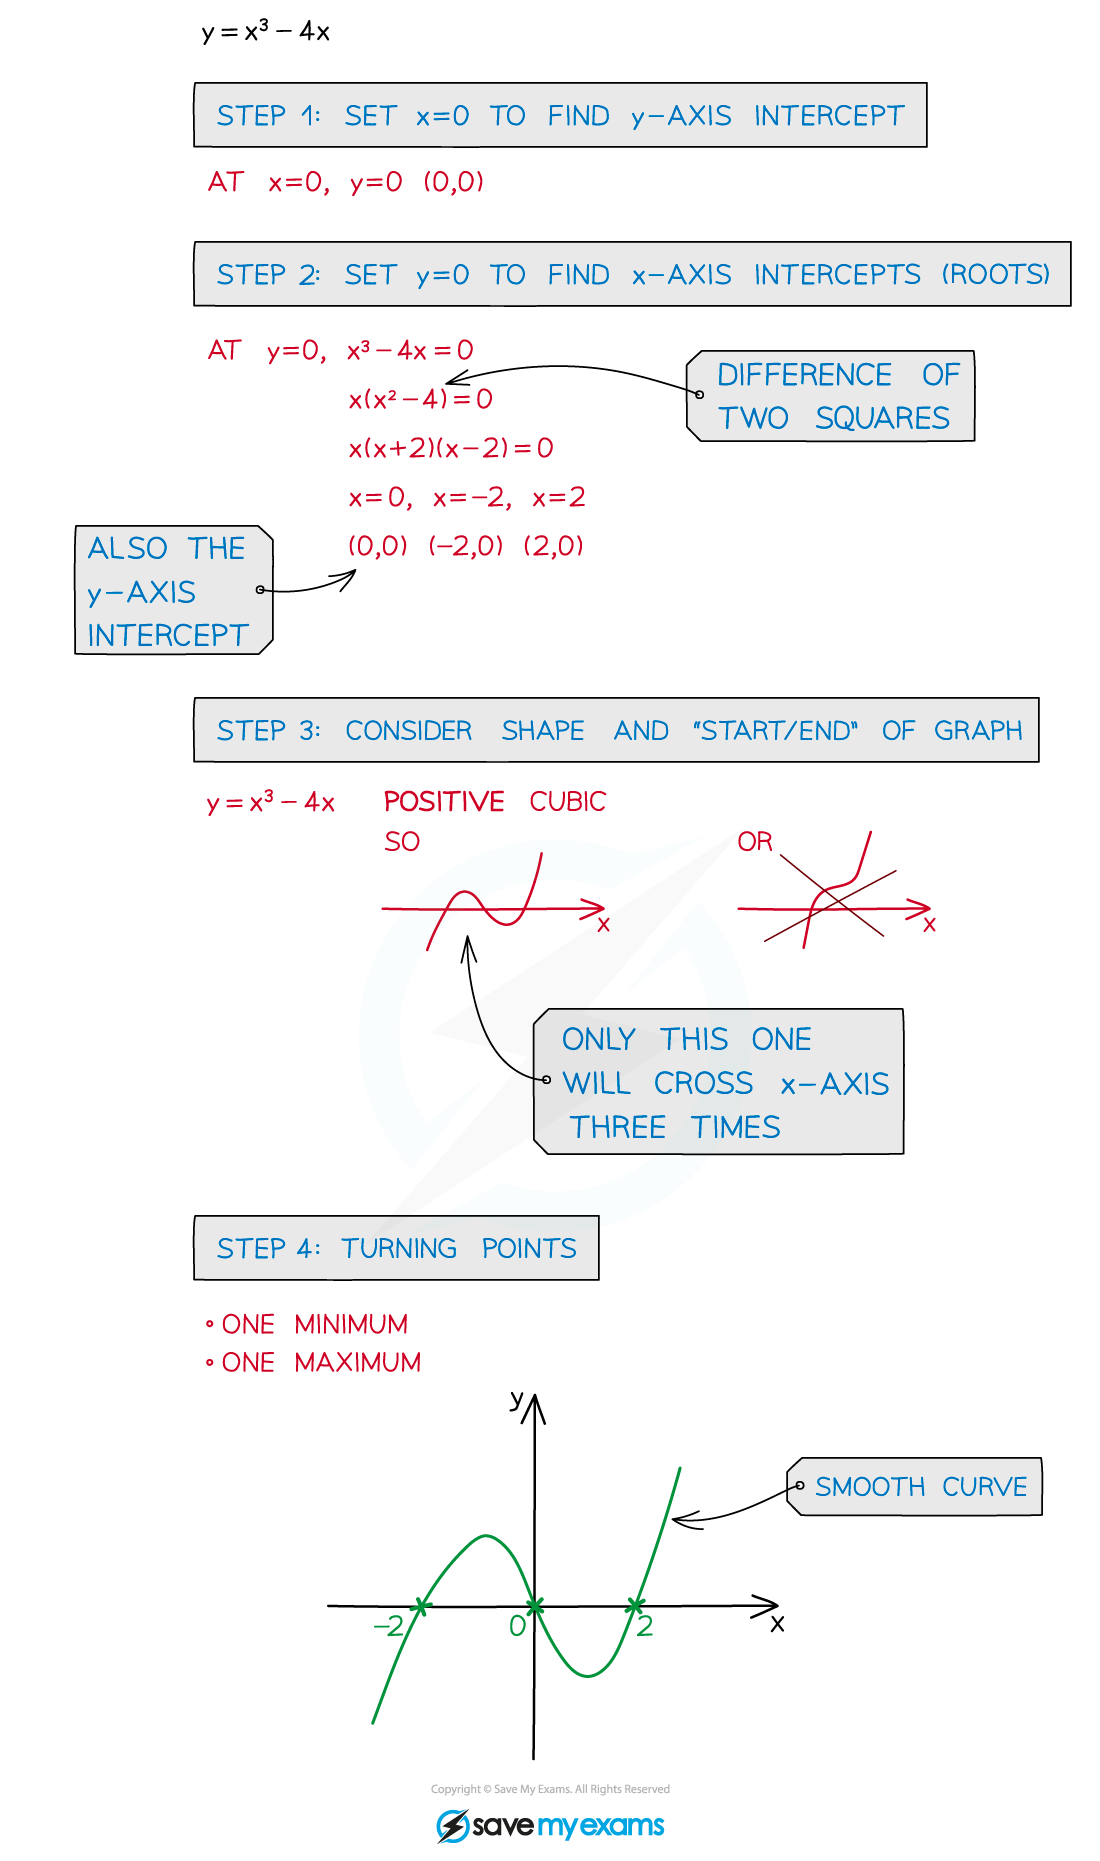
STEP 1 Find the y-axis intercept by setting x = 0
STEP 2 Find the x-axis intercepts (roots) by setting y = 0
STEP 3 Consider the shape and “start”/”end” of the graph
eg. a positive cubic graph starts in third quadrant (bottom left) and “ends” in first quadrant (top right)
Whereas a negative cubic graph starts in the second quadrant (top left) and ends in the fourth quadrant (bottom right)
STEP 4 Consider where any turning points should go
STEP 5 Draw with a smooth curve
How do I sketch a polynomial from its turning points?
Turning points are where the gradient of the graph is equal to zero
They are either a minimum; a u-shape
Or a maximum; an n-shape
The turning points of a polynomial may be found by using differentiation, or you may be told them in the question
First consider the order (power) of the polynomial you are sketching
This will tell you the general shape of the graph, and how many turning points there are likely to be
A quadratic will have 1 turning point
A positive quadratic will have a minimum
A negative quadratic will have a maximum
A cubic will have either 2 or 0 turning points
A quartic will have either 3 or 1 turning points
Knowing the type of turning point is also useful
For a maximum
The graph will be increasing (going upwards from left to right) before the maximum
The graph will be decreasing (going downwards from left to right) after the maximum
For a minimum
The graph will be decreasing before the minimum
The graph will be increasing after the minimum
Putting a point on your sketch where each turning point is, and sketching a small u for a minimum, or a small n for a maximum will help to then fill in the overall shape of the graph
Worked Example
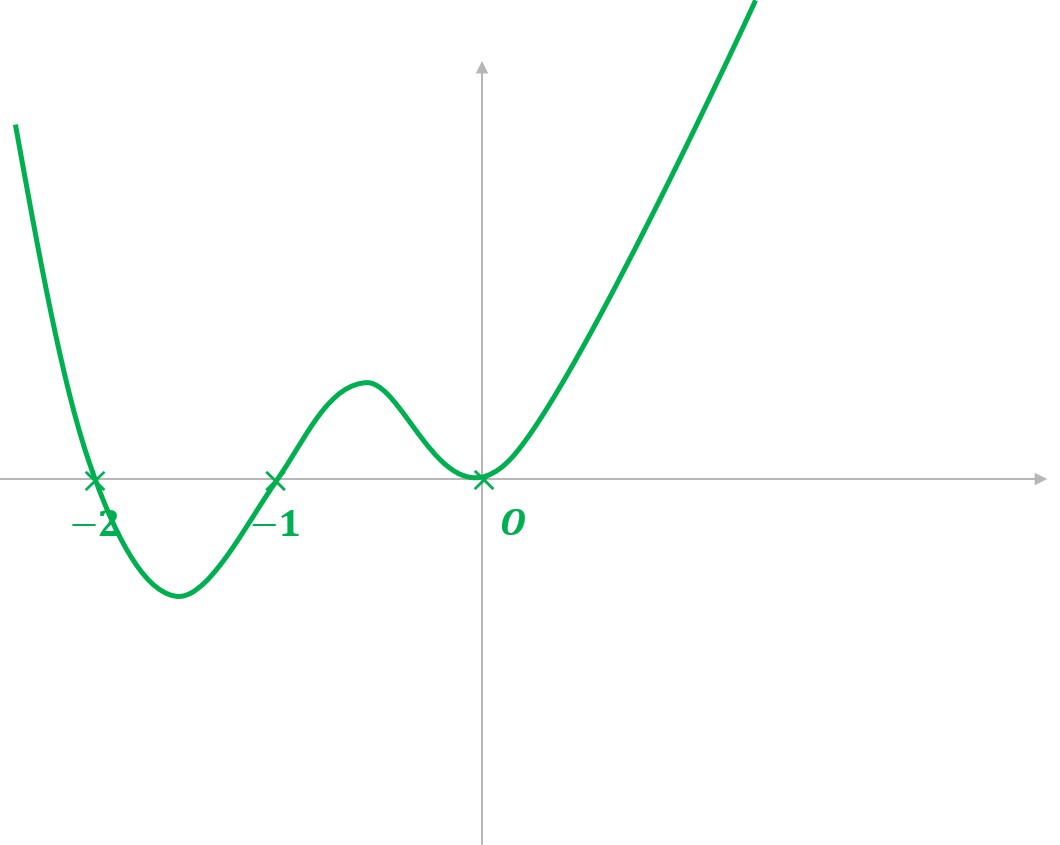
Sketch the graph of .
Find the coordinates of the -intercept by setting
equal to 0 and finding the value of
.
The coordinates of the -intercept are (0,0).
Find the coordinates of the -intercept by setting
equal to 0 and solving to find the values of
.
Factorise out of each term in the expression.
Factorise the quadratic.
Solve to find the values of .
So the graphs crosses the -axis at the points (-2, 0) and (-1, 0) and touches the axis at the point (0, 0) (
is a repeated root). Plot each of these points and then join them up with a smooth curve.
Check that the shape of the graph is correct, the given polynomial is a positive quartic, so the shape and number of solutions is correct.
Worked Example
The curve has:
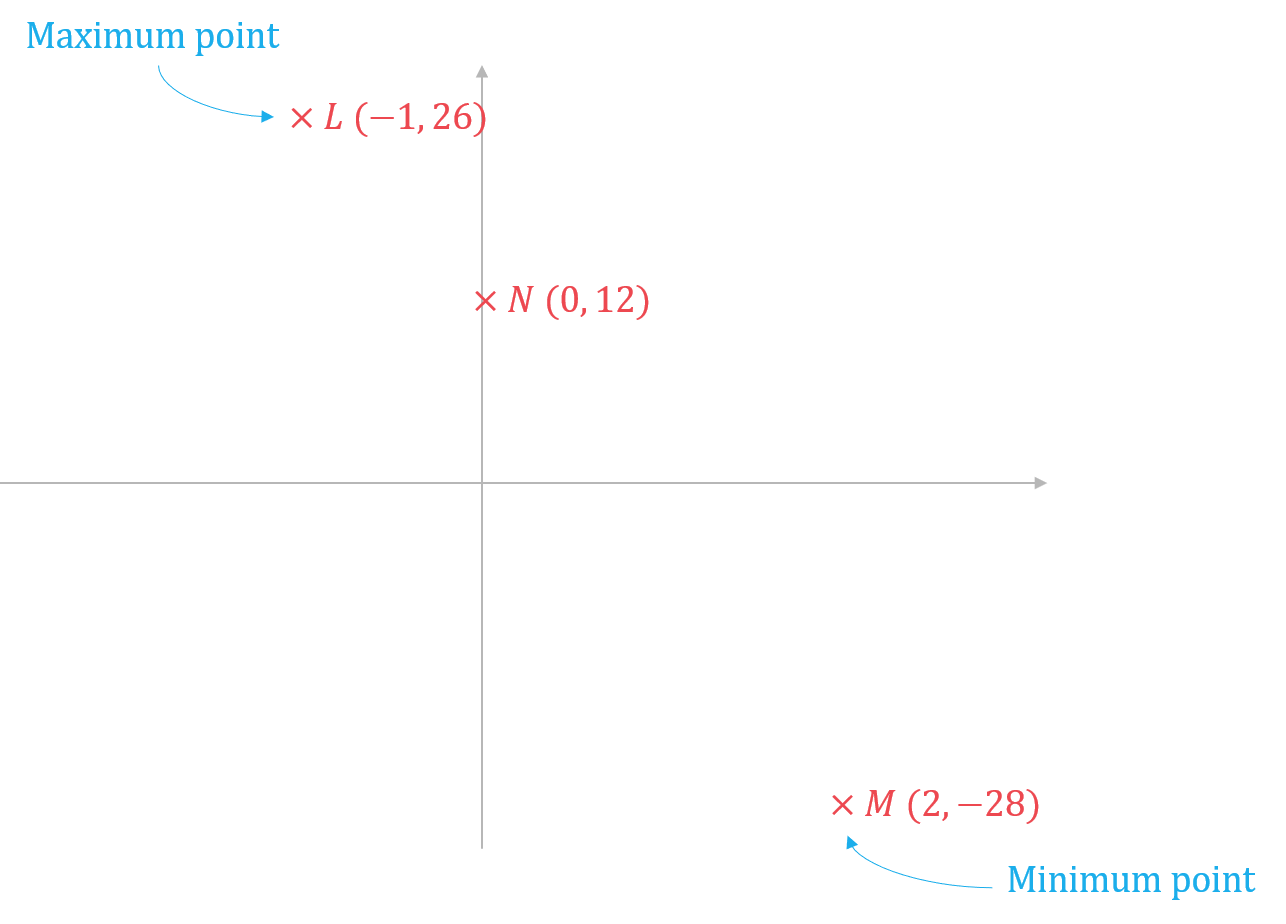
A maximum point at L ( -1, 26 )
A minimum point at M ( 2, -28 )
The curve intersects the -axis at N.
The curve crosses the -axis at three distinct points.
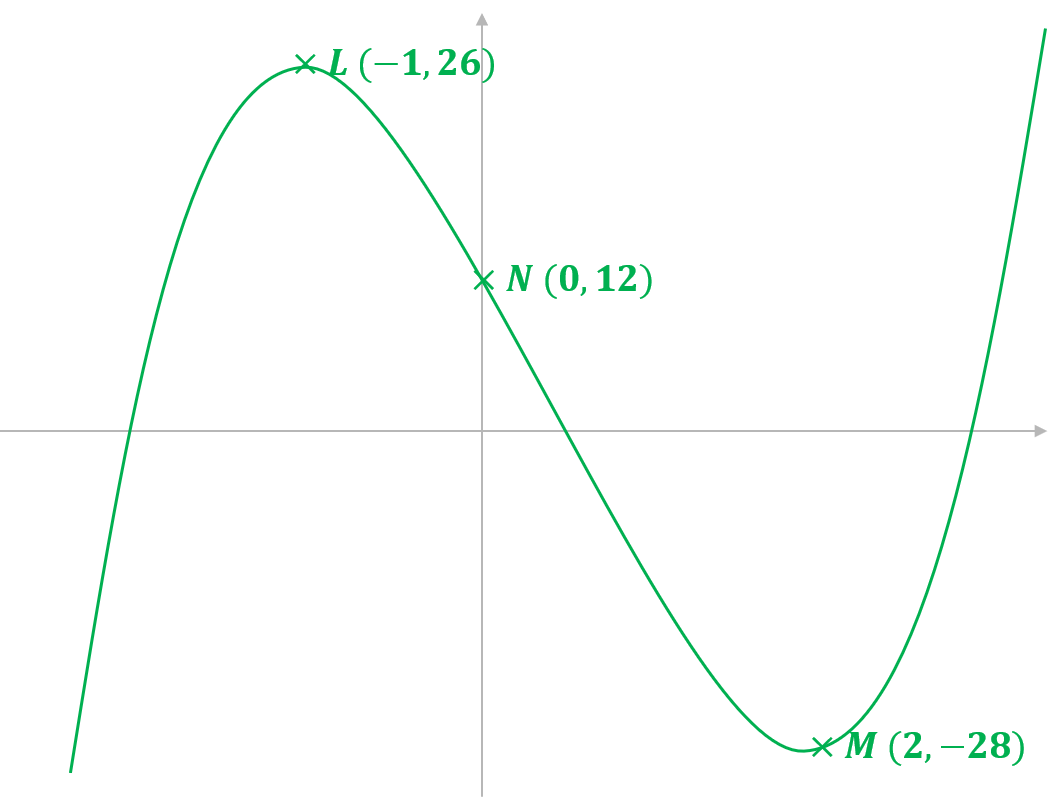
Sketch the curve, labelling the points L, M, and N.
Find the coordinates of N by setting equal to 0 and finding the value of
.
The coordinates of the points where the curve crosses the -axis are not needed, but you should make sure your curve crosses it three times and use the given minimum and maximum points to help you see where.
Plot the points L (-1, 26), M (2, -28) and N (0, 12).
Draw the graph by joining up the points with a smooth curve. Make sure the point L is a maximum (graph changes from increasing to decreasing) and the point M is a minimum (graph changes from decreasing to increasing).
Make sure the graph goes through the -axis three times.

Unlock more, it's free!
Did this page help you?