Rate Graphs (OCR GCSE Chemistry A (Gateway)) : Revision Note
Rate Graphs
It is important you can interpret rate of reaction graphs
Over the course of a reaction, the concentration of product will increase and the concentration of reactant will decrease (as it is being used up) as demonstrated below:

Rate of reaction graphs
Rate of reaction graphs are also useful for calculating:
the mean rate of a reaction
the rate of reaction at a specific point
the time at which a reaction reaches completion
In this case the graph shows
time on the x-axis
volume of product formed or amount of reactant used up on the y-axis
Calculating the Mean Rate of Reaction
To find the mean rate of reaction for the whole reaction then you calculate the overall change in the quantity described on the y-axis (e.g. volume of gas produced or reactant used up) and divide it by the total time taken for the reaction
You can also find the mean rate of reaction between any two points in time by calculating the change in of the reactant or product occurring in that time frame, and dividing it by the section of time being studied
Worked Example
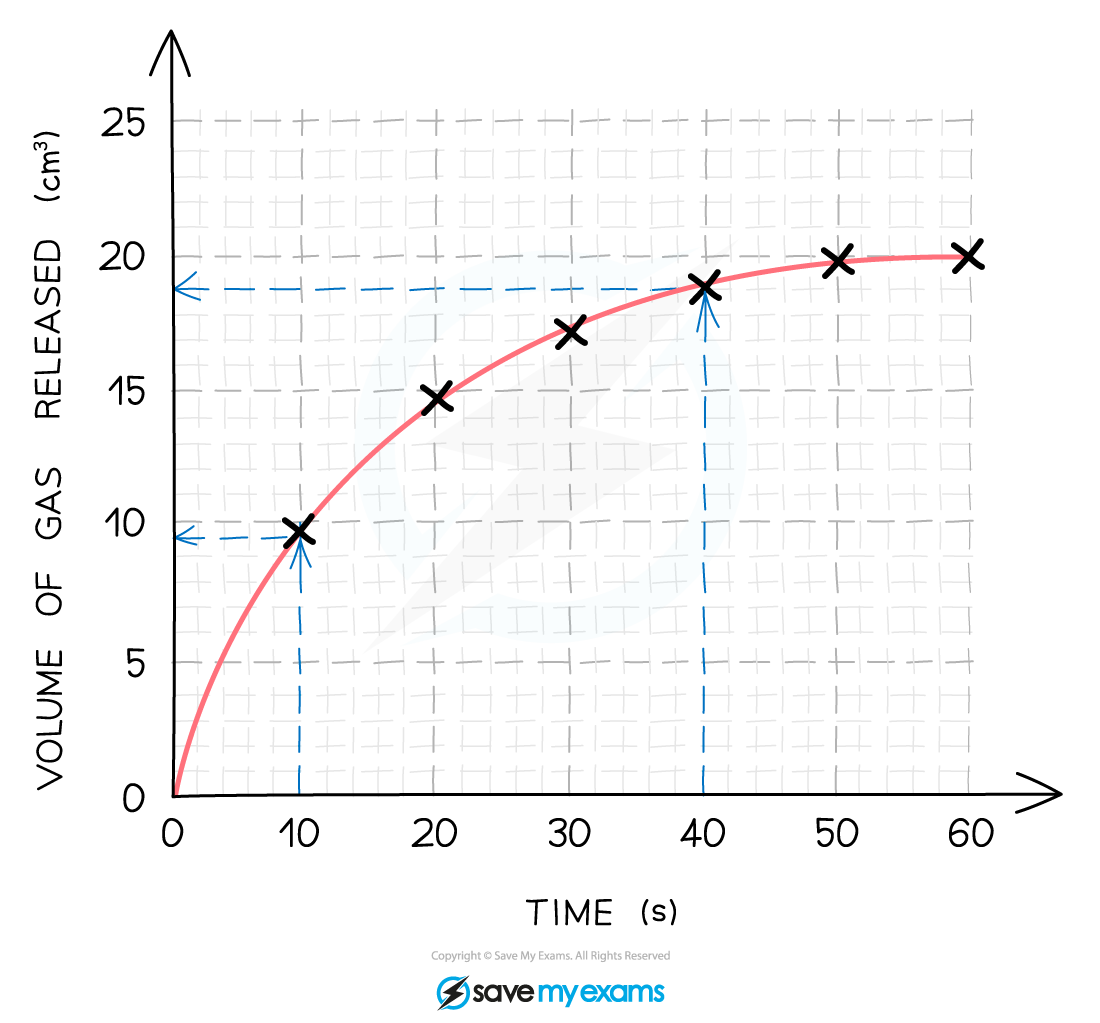
A student analysed the reaction between HCl and Mg by measuring the volume of hydrogen gas given off at regular intervals. The equation for the reaction is:
Mg + 2HCl ⟶ MgCl2 + H2
A graph of the results was plotted shown below:

Calculate the mean rate of reaction between 10s and 40s
Answer:
Using a ruler draw two lines upwards from the x-axis at 10 seconds and 40 seconds
At the points these lines meet the curve extend two horizontal lines to meet the y-axis and read the values
From the graph, the mean rate of reaction between 10 and 40 seconds is found by calculating the total change in the y valued and dividing it by the total time taken
Total change in volume = 19- 9.5 = 9.5 cm3
Time taken 40-10 = 30 s
Mean rate of reaction = 9.5 ÷ 30 = 0.317 cm3 / s
Calculating the Rate of Reaction at a Particular Point
To do this you need to find the gradient of the curve at that point
To do this a tangent is drawn to the curve and then the gradient of the tangent calculated
Worked Example
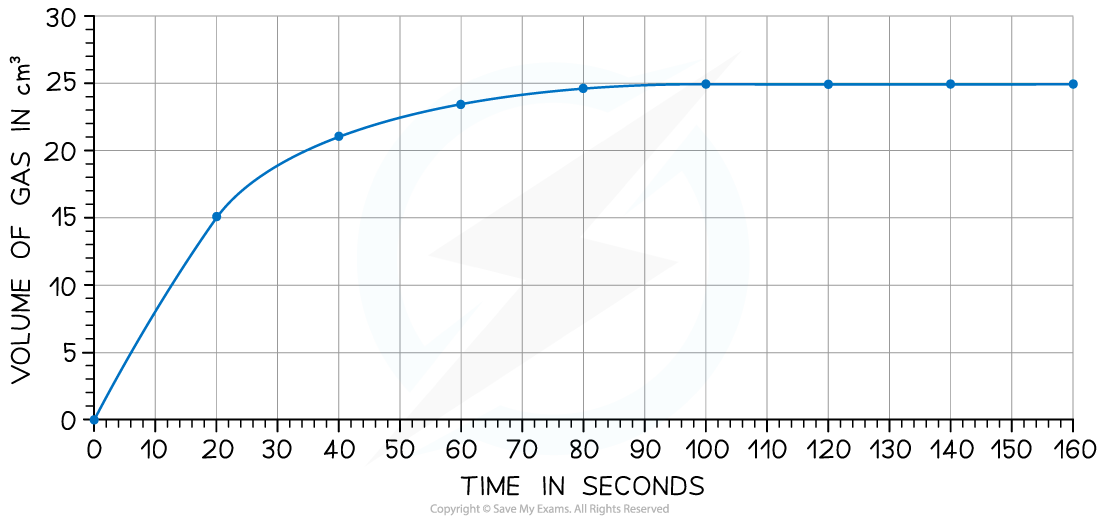
Iodine and methanoic acid react in aqueous solution.
I2 (aq) + HCOOH (aq) → 2I− (aq) + 2H+ (aq) + CO2 (g)
The rate of reaction can be found by measuring the volume of carbon dioxide produced per unit time and plotting a graph as shown:

Calculate the rate of reaction at 20 seconds
Answer:
Draw a tangent to the curve at 20 seconds:

Complete the triangle and read off the values of x and y
Determine the gradient of the line using change in y / change in x
Rate of reaction = 24 ÷ 40 = 0.60 cm3/s
Using Reaction Times
The reaction time is the total time taken for the reaction to happen
The rate of reaction is inversely proportional to the reaction time, so as the reaction time increases the rate of reaction decreases
This means that 1 / time is directly proportional to the rate of reaction:
1 / time = rate of reaction
Instead of plotting reaction time against your independent variable (temperature, concentration) the reaction times from the investigation can be converted to rates of reaction using 1/t and plotted instead to observe trends
Examiner Tips and Tricks
When drawing the tangent to a curve make the triangle large and try to intersect with gridlines if you can. This minimises errors of precision and reduces the chance you will accidently misread the graph values.

You've read 0 of your 5 free revision notes this week
Unlock more, it's free!
Did this page help you?
