Rate Graphs (AQA GCSE Chemistry) : Revision Note
Rate graphs
Data recorded in rate studies is used to plot graphs to calculate the rate of a reaction
Time is normally plotted on the x-axis with the concentration of the reactant or product on the y-axis
A number of measurements should be taken to provide a complete set of data
If the relationship between the factor being measured and the amount produced is directly proportional (i.e. if the concentration of a reactant doubles the rate also doubles) then the resulting graph will be a straight line graph going through the origin
The gradient of the line is equal to the initial rate of reaction and the steeper the gradient of the line then the faster the rate of reaction
Initial rate graphs

An initial rate graph for the formation of a product shows a straight line with a positive correlation starting from the origin
A reaction rate graph based on measurements of a reactant being used up will have a negative correlation

An initial rate graph for a reactant shows a straight line with a negative correlation starting from the y-axis
Rate graphs until completion
Plotting a graph until the completion of the reaction shows how the rate changes with time
Over time the rate of reaction slows as the reactants are being used up so the line becomes less steep and eventually becomes horizontal, indicating the reaction has finished
You can plot more than one run of a variable on the same graph making it easier to see how the variable influences the rate
For example, plotting the effect of concentration on a reaction between acid and marble chips:

This graph shows how the mass/volume of a product changes over time for a high concentration and a low concentration
Drawing a tangent to the slope allows you to show the gradient at any point on the curve
The steeper the slope, the quicker the rate of reaction
The volume of a gaseous product would increase to a maximum over time, so the line levels out indicating the reaction is over
Since the volume and mass would be proportional, this could also be a graph of mass of product versus time
Calculating the mean rate of reaction
You can find the mean rate of reaction by taking the difference between two points on the curve as shown in the following example:
Worked Example
A student analysed the reaction between HCl and Mg by measuring the volume of hydrogen gas given off at regular intervals.
The equation for the reaction is:
Mg + 2HCl ⟶ MgCl2 + H2
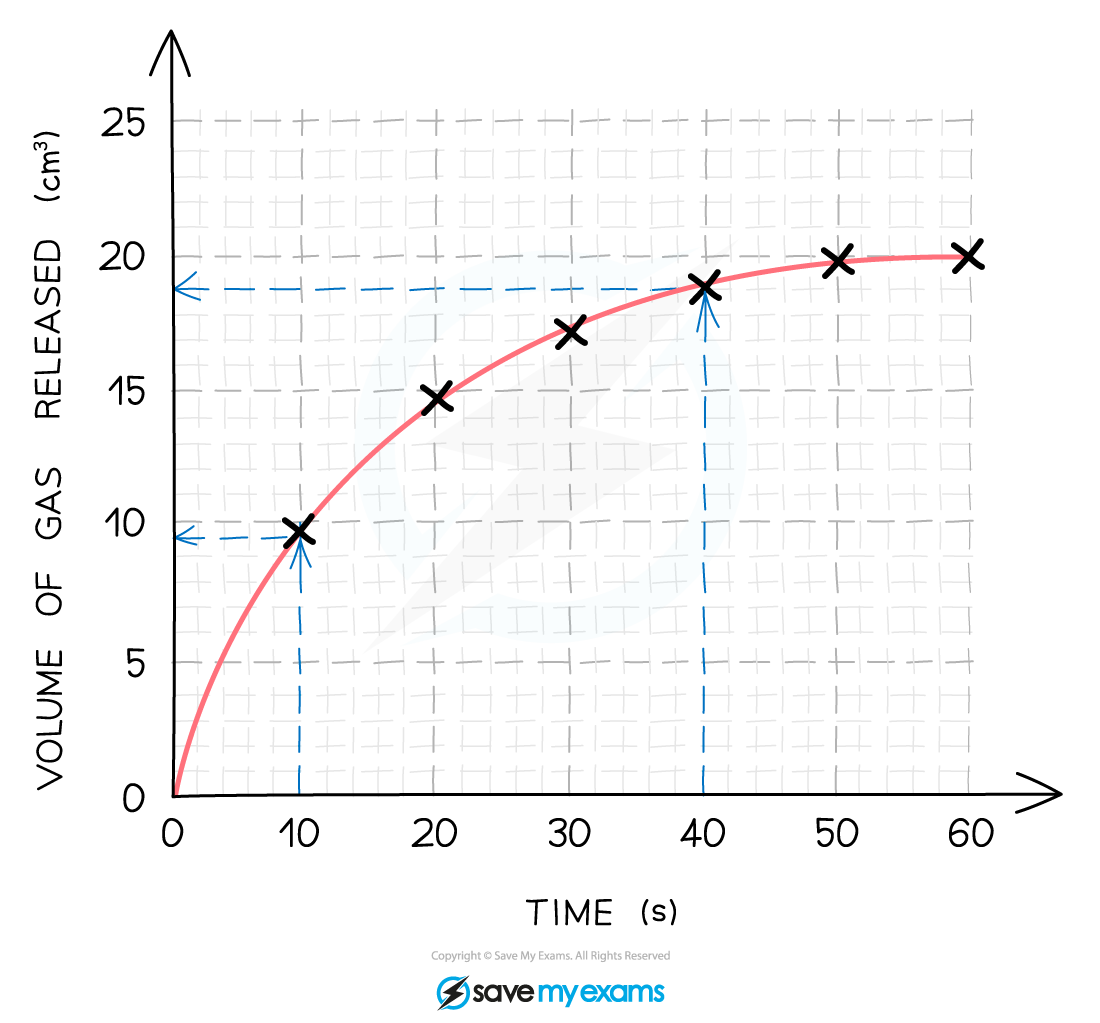
A graph of the results was plotted shown below:

Calculate the mean rate of reaction between 10 s and 40 s.
Answer:
Step 1: Using a ruler draw two lines upwards from the x-axis at 10 seconds and 40 seconds.
Step 2: At the points these lines meet the curve, extend two horizontal lines to meet the y-axis and read the values.
Step 3: From the graph, the mean rate of reaction between 10 and 40 seconds is found by calculating the total change in the y valued and dividing it by the total time taken:
Total change in volume = 19 - 9.5 = 9.5 cm3
Time taken 40 -10 = 30 s
Mean rate of reaction = 9.5 ÷ 30 = 0.317 cm3/s
Examiner Tips and Tricks
Make sure you can interpret reaction graphs and use them to describe how a reaction proceeds as questions do come up on this topic.

You've read 0 of your 5 free revision notes this week
Sign up now. It’s free!
Did this page help you?
