Health Issues (AQA GCSE Combined Science: Trilogy: Biology): Revision Note
Exam code: 8464
Health & Disease
Health is the state of physical and mental well-being; lots of factors affect the health of an individual
Diseases, both communicable and non-communicable, are major causes of ill health; ill-health affects not only the sufferer but their family members and the contribution that individual can make to society
Ill health can lead to a poorer quality of life or a reduced lifespan
The cost of an individual being ill - individuals who are sick may not be able to work and may require expensive healthcare (with the cost being attributed to the individual or a healthcare provider such as the NHS in the UK)
Communicable diseases are caused by microorganisms called pathogens which can spread between individuals or individuals and animals
eg. chickenpox, a common childhood disease, is caused by a viral pathogen called the varicella-zoster virus, whereas Covid-19 is caused by the SARS-CoV-2 virus
Non-communicable diseases are not caused by pathogens and their effects on health tend to be longer-lasting; examples are asthma, CHD and most cancers
Factors including diet, stress and life situations may have a profound effect on both physical and mental health
Eating a balanced diet that provides the right amount of energy and nutrients helps maintain good health, whereas a poor diet can lead to deficiencies, obesity, diabetes and poor mental health
Constantly being under stress can lead to cardiovascular issues (such as high blood pressure, increasing the risk of CHD) and poor mental health
Where a person lives and their income can have a profound impact on health - this affects the standard of healthcare that is accessible to them (and what they can afford), what food they buy, etc.
Interactions & Disease
Different types of disease may interact in ways that negatively affect the health of the individual
Defects in the immune system mean that an individual is more likely to suffer from infectious diseases; individuals infected with HIV eventually end up with reduced numbers of lymphocytes circulating the body, which reduces the ability of the immune system to fight opportunistic infections like pneumonia
Viruses living in cells can be the trigger for cancers; the HPV virus can infect cells of the cervix in women, resulting in cervical cancer developing in some cases, whereas some strains of the hepatitis virus can cause liver cancer
Immune reactions initially caused by a pathogen can trigger allergies such as skin rashes and asthma - these often develop as a result of an overactive immune response
Severe physical ill health can lead to depression and other mental illness
Disease Incidence: Representing & Calculating
Scientists and doctors often record the incidence of disease – the number of new cases seen in a population over a set time period (e.g. number of measles cases per month)
Data on disease can take place in a variety of forms:
Graphical and numerical forms
Data can be presented as a table, which can be extracted into an appropriate graph; from there, numerical data can be extracted from the chart
Graphs must have clearly labelled axes and appropriate scales
Frequency tables, bar charts and histograms
Frequency tables present how many cases occur in each category
Bar charts are used for discrete data (e.g. cases per month)
Histograms are used for continuous data (e.g. ages of infected patients)
Correlations on scatter diagrams
Scatter diagrams plot two variables (e.g. pollution level vs. number of asthma cases)
Positive correlation: both variables increase together
Negative correlation: one variable increases as the other decreases.
No correlation: no clear pattern.
Correlation does not prove causation – the link between variables may be due to another factor
Sampling
When investigating the spread of disease, it is often impractical to collect data from every individual in a population. Scientists, therefore, take a sample, e.g.:
Random sampling – each individual has an equal chance of selection, reducing bias
Systematic sampling – individuals are chosen at regular intervals (e.g. every 10th person)
Stratified sampling – the population is divided into groups (e.g. age groups) and sampled proportionally
Importance of sampling:
Sampling saves time and resources while still allowing meaningful data collection
Large, well-chosen samples produce more reliable and representative results
Application in epidemiology:
Sampling enables scientists to identify patterns of disease spread, risk factors, and vulnerable groups
Findings are used to guide public health strategies, such as vaccination campaigns or screening programmes
Worked Example
Bar chart from a table
Table showing measles cases over six months:
Month | Number of cases |
|---|---|
January | 8 |
February | 15 |
March | 22 |
April | 25 |
May | 18 |
June | 10 |
How this is represented:
A bar chart is drawn with:
Months on the x-axis
Number of cases on the y-axis
Bars of equal width, separated by gaps, to show the number of cases per month
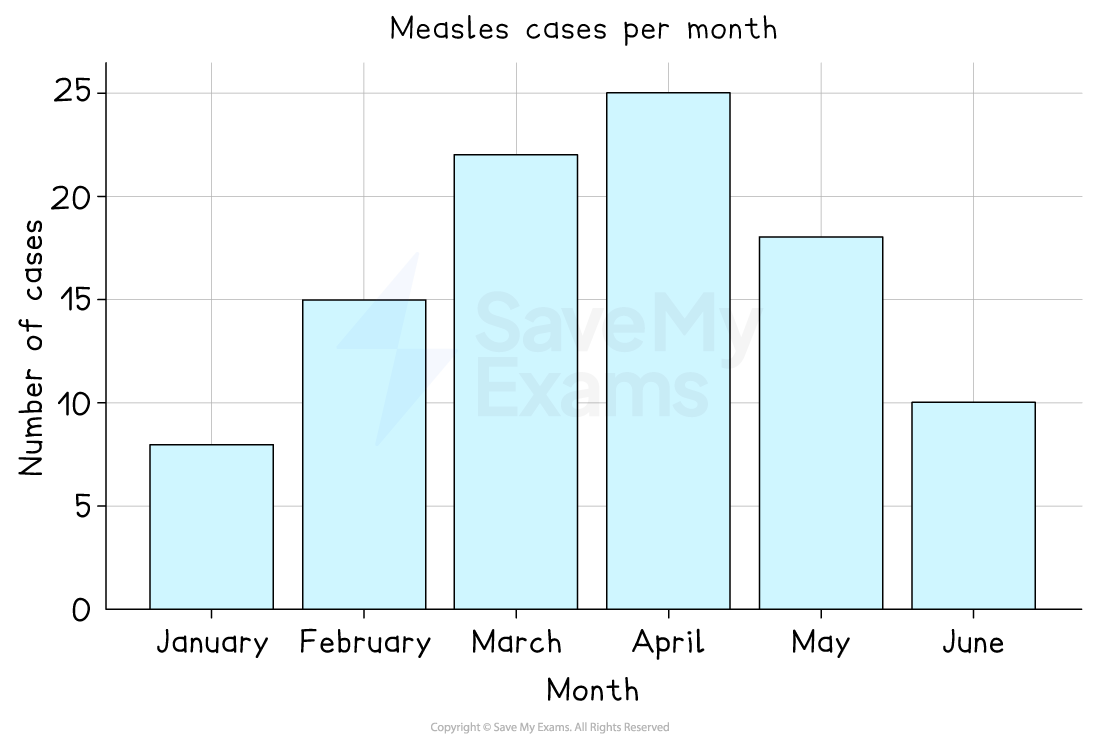
Interpretation:
The number of cases rises steadily from January to April
The highest incidence is in April, then falls again in May and June
The largest increase is between January and February
Worked Example
Correlation in a Scatter Diagram
Scientists plot the average level of air pollution (PM2.5) against the number of asthma cases in five towns. The points on the scatter diagram form an upward-sloping pattern.
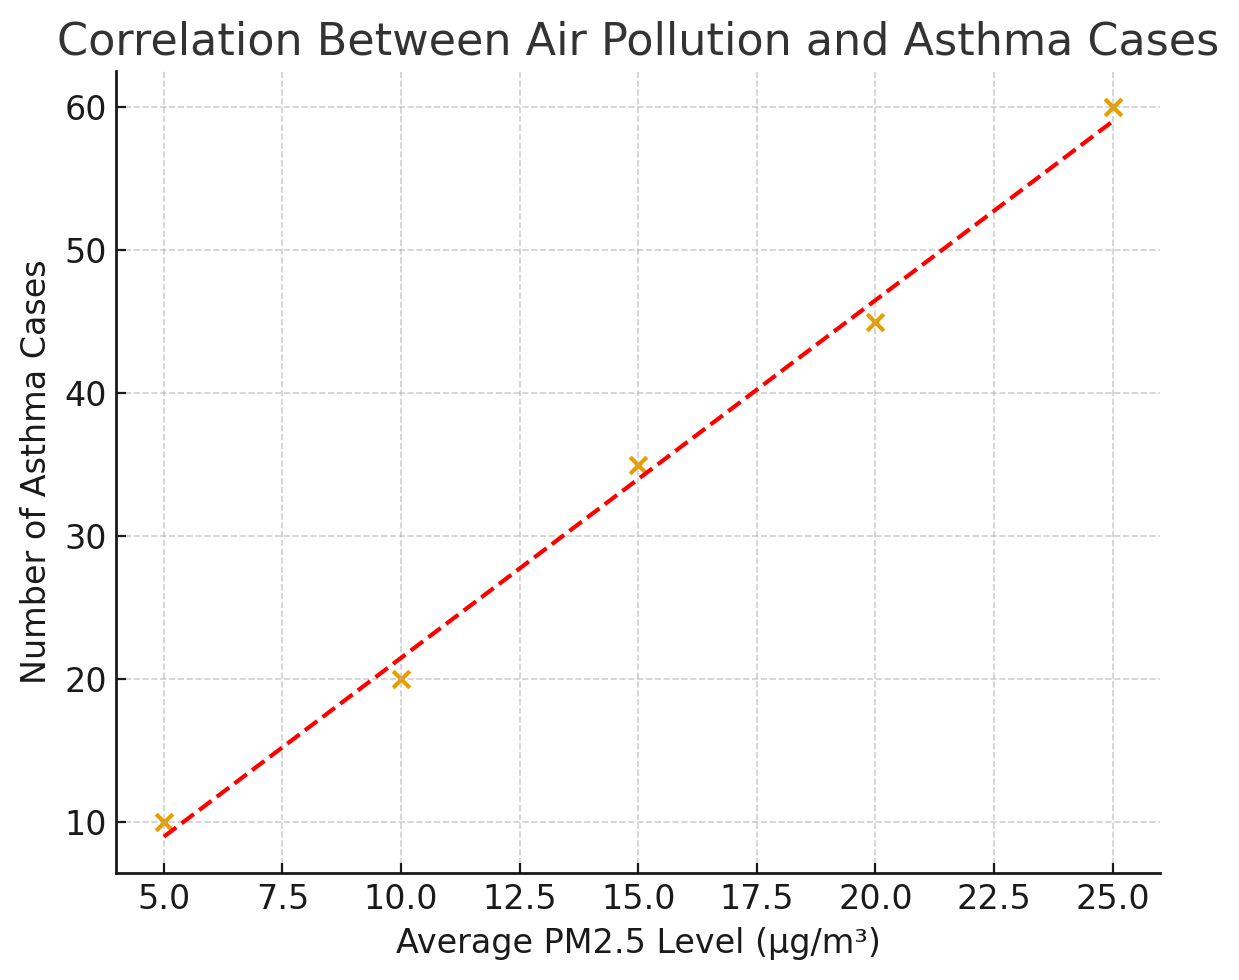
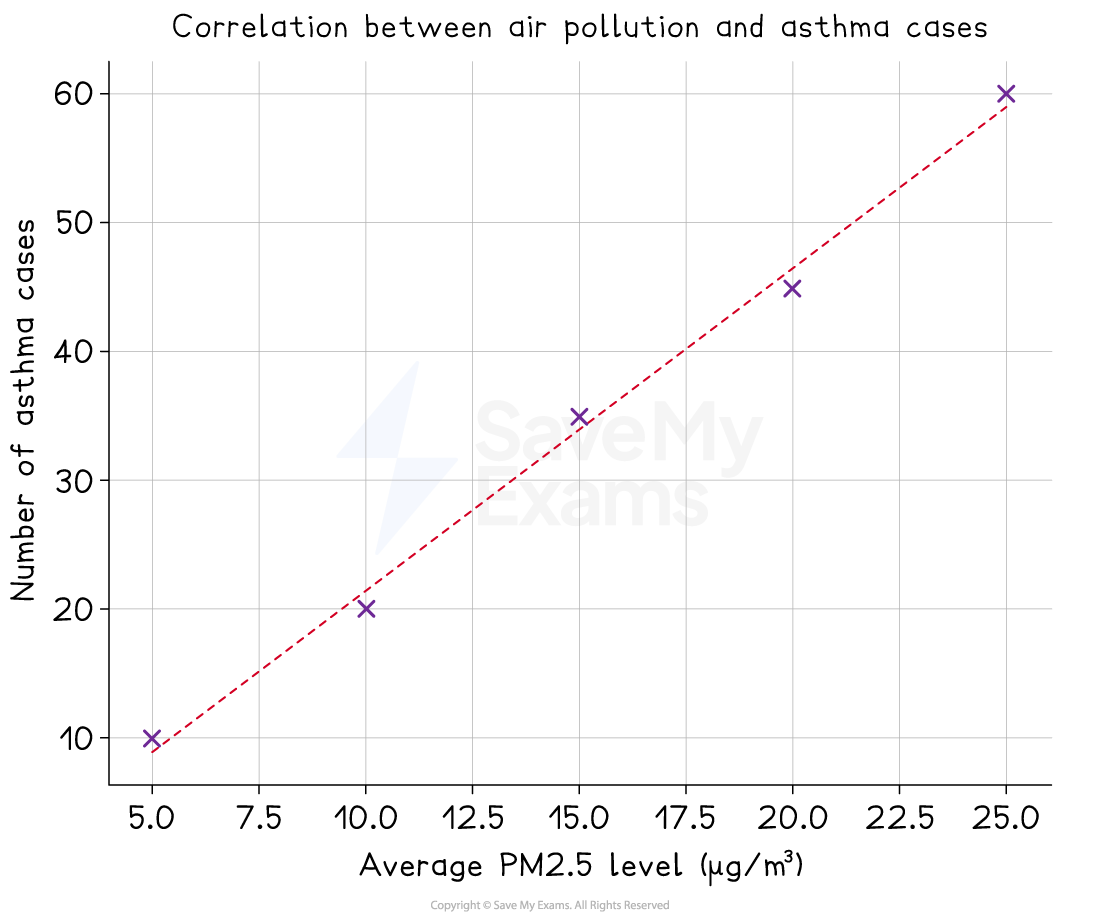
Interpretation:
There is a positive correlation – as air pollution increases, asthma cases also increase
This suggests a possible link between air pollution and asthma, but does not prove that pollution directly causes asthma - other factors may be involved
Examiner Tips and Tricks
You should be able to:
translate disease incidence information between graphical and numerical forms
construct and interpret frequency tables and diagrams, bar charts and histograms
use a scatter diagram to identify a correlation between two variables
You should understand the principles of sampling as applied to scientific data, including epidemiological data.

Unlock more, it's free!
Join the 100,000+ Students that ❤️ Save My Exams
the (exam) results speak for themselves:

Was this revision note helpful?
Build on this topic