Detecting Pollution (WJEC GCSE Biology): Revision Note
Exam code: 3400
Signs of Pollution
Several factors can be assessed when seeking to determine the level of pollution present in a habitat, e.g.
Indicator species, oxygen concentration and pH levels can be assessed when analysing pollution in a stream
Indicator species can provide information about air pollution
Water pollution
Stream indicator species
Water pollution occurs when, e.g. raw sewage or fertilisers are released into a body of water, such as a stream
This causes microorganisms in the water to increase in number
As these microorganisms respire they use up the oxygen in the water
Some invertebrate species, e.g. stonefly larvae and freshwater shrimps, are highly sensitive to the concentration of dissolved oxygen in the water, making them good indicator species for water pollution
E.g. the presence of stonefly larvae in a stream or river indicates that the water is not polluted
On the other hand, some other invertebrate species, e.g. mosquito larvae and blood worms, are unaffected by polluted environments
E.g. the presence of blood worms in a body of water, especially if stonefly larvae are absent, indicates a very high level of water pollution
Freshwater indicator species diagram

The presence or absence of certain species in a freshwater habitat can be used as an indicator of pollution levels
Oxygen & pH
Indicator species, as the name suggests, can be a useful indication of pollution levels, but as their presence can be affected by factors other than pollution, it can be useful to measure other variables when assessing pollution in a stream, e.g.
Oxygen concentration can be measured using an oxygen meter; low oxygen levels can indicate high levels of pollution
pH levels can be assessed by taking water samples and testing with an indicator; changes in pH can be a sign of water pollution
Air pollution
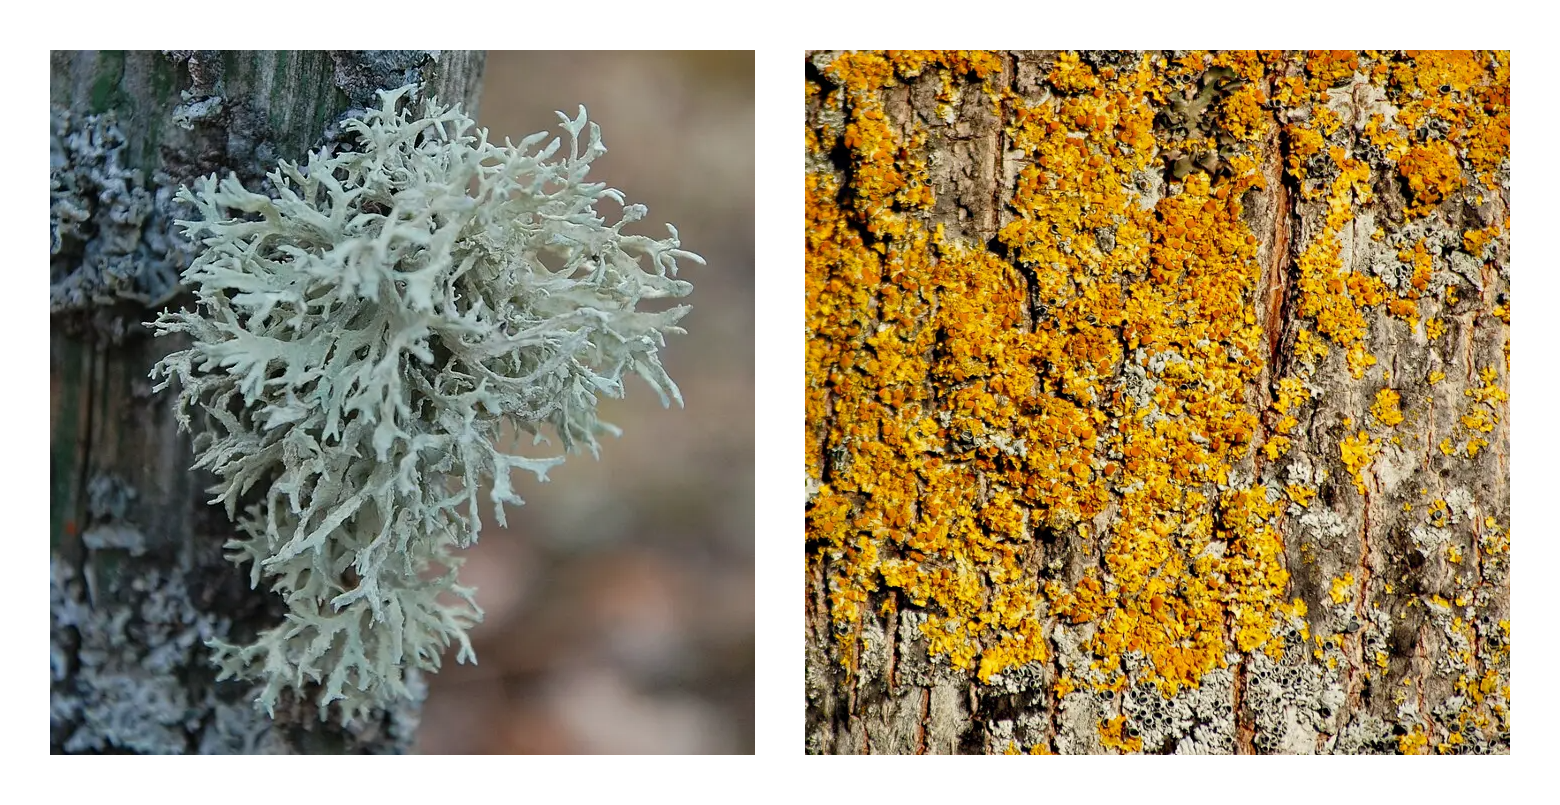
Lichen as an indicator species
Lichen can be used as an indicator species for air pollution
Lichens are highly sensitive to sulfur dioxide concentrations in the environment
Sulfur dioxide is one of the air pollutants released from car exhausts and power stations during the combustion of fossil fuels
The abundance and type of lichen species growing at a particular location can be monitored to determine levels of air pollution, e.g.
A high abundance of lichen indicates clean air
A high abundance of bushy lichens indicates very clean air
A high abundance of crustose lichens in the absence of leafy lichens indicates more polluted air

Флорист, CC BY 4.0, via Wikimedia Commons (opens in a new tab) and Trio3D, CC BY-SA 4.0, via Wikimedia Commons (opens in a new tab)
Analysing data to determine air pollution levels
Analysis of lichen distribution data can provide information about levels of air pollution
E.g. the maps below show the distribution of a bushy lichen species (Usnea subfloridana, also known as 'old man's beard') and a crustose lichen species (Xanthoria parietina) in England and Southern Scotland between 1960 and the present day
Lichen distribution map

Lichen monitoring over time provides data on species distribution that can provide information about air pollution
These data suggest the following possible conclusions:
Air pollution levels are higher around large cities
Crustose lichen levels are higher in built-up areas such as London and Sheffield, while bushy lichen growth is very low in these areas
Air pollution was spread over a wider area between 1960-1999 and then became more concentrated in specific regions between 2000-2019
For crustose lichen the blue dots are quite spread out, but the areas of red dots are highly concentrated
Air pollution levels in central Wales, the South-West and the North-East are lower
Bushy lichens are most common in these areas
Problems with indicator species
While the above points are possible conclusions from the data provided, it is worth noting that:
Lichen growth may be affected by factors other than air pollution; this means that the patterns in the data don't always fit what we might expect, e.g.
There are many crustose lichens in the Welsh borders between 200-2019, but there are no large cities here that could explain this in terms of air pollution
This could perhaps be connected to nitrogen released from agriculture rather than city air pollution
There also appears to be some growth of bushy lichens around Sheffield, which doesn't fit with the above conclusion about high levels of air pollution here
Indicator species do not provide quantitative measurements for pollution levels
This data is only taken from two lichen species; multiple species would need to be analysed before being confident about any patterns

Unlock more, it's free!
Did this page help you?