Genetic Inheritance (AQA GCSE Biology): Revision Note
Exam code: 8461

Inheritance key terms
Key term | Definition |
|---|---|
Gamete | Sex cell (in animals: sperm and ovum; in plants: pollen nucleus and ovum). |
Chromosome | A thread-like structure of DNA, carrying genetic information in the form of genes, located in the cell nucleus. |
Gene | Regions of DNA found on chromosomes that code for specific proteins. |
Allele | Different versions of a particular gene. |
Dominant | A dominant allele is always expressed, even if only one copy is present. |
Recessive | A recessive allele is only expressed if two copies are present (therefore no dominant allele present). |
Homozygous | If an individual's two alleles of a gene are the same, an individual is homozygous (homo = same). |
Heterozygous | If an individual's two alleles of a gene are different, they are heterozygous (hetero = different). |
Genotype | The combination of alleles that control each characteristic |
Phenotype | Observable characteristics of an organism (such as eye colour or blood type). |
Monohybrid inheritance
Some characteristics are controlled by a single gene, such as:
fur colour in mice
red-green colour blindness in humans
The inheritance of these single genes is called monohybrid inheritance
Mono = one
Because there are two copies of each chromosome in each body cell (one inherited from each parent), there are two alleles of each gene present
For example, an individual has two copies of the gene for eye colour; one allele could code for brown eyes and one allele could code for blue eyes
The observable characteristics of an organism (seen just by looking – like eye colour; or found – like blood type) is called the phenotype
The combination of alleles that control each characteristic is called the genotype
Alleles can be dominant or recessive
A dominant allele only needs to be inherited from one parent in order for the characteristic to show up in the phenotype
A recessive allele needs to be inherited from both parents in order for the characteristic to show up in the phenotype
If there is only one recessive allele, it will remain hidden and the dominant characteristic will show
If the two alleles of a gene are the same, we describe the individual as being homozygous
Homo = same
An individual could be:
homozygous dominant: having two copies of the dominant allele
homozygous recessive: having two copies of the recessive allele
If the two alleles of a gene are different, we describe the individual as being heterozygous
Hetero = different
When completing genetic diagrams, alleles are abbreviated to single letters
The dominant allele is given a capital letter and the recessive allele is given the same letter, but lower case
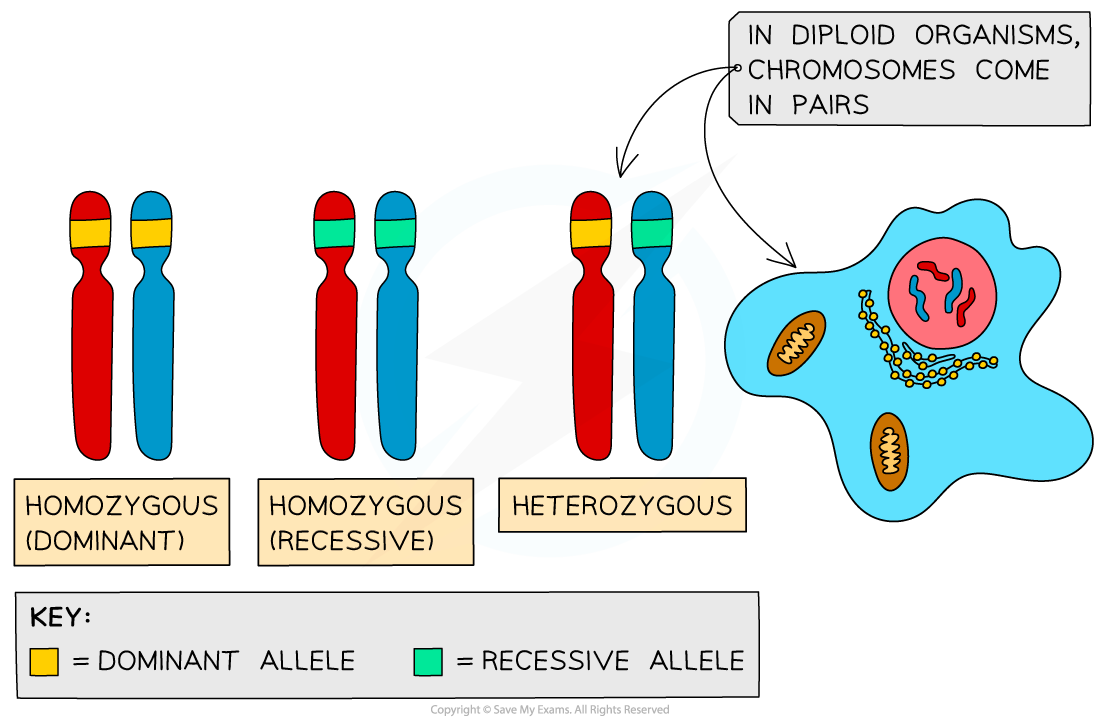
Multiple gene inheritance
Most characteristics are determined by multiple genes interacting, rather than by a single gene
An example of multiple gene inheritance is eye colour
While it is true that brown eye alleles are dominant to blue eye alleles, there are other genes involved
This is why eye colour has many more phenotypes than just brown and blue
Predicting inheritance
Monohybrid inheritance is the inheritance of characteristics controlled by a single gene
This can be determined using a genetic diagram known as a Punnett square
A Punnett square diagram shows the possible combinations of alleles that could be produced in the offspring
From this, the ratio of these combinations can be worked out
The dominant allele is shown using a capital letter and the recessive allele is shown using the same letter but lower case
It is a good idea to always follow the same process when constructing a Punnett square:
Determine the parent genotypes
Determine the parent gametes
Construct and fill in the Punnett square
Use the results to answer the question, e.g.:
determine the number of offspring with each genotype
determine the probability of offspring having a particular genotype or phenotype
determine the phenotype ratio in the offspring
Indicate visually where in the Punnett square your answer has come from, e.g. by labelling each genotype
Worked Example
The height of pea plants is controlled by a single gene that has two alleles: tall and short
The tall allele is dominant and is shown as T
The small allele is recessive and is shown as t
(a) Show the possible allele combinations of the offspring produced when a short plant is bred with a homozygous tall plant
(b) Show the phenotype ratio of the offspring produced when two of the offspring from the cross in (a) are bred together
(c) Show the results of crossing a heterozygous plant with a short plant
Answer (a)
Step 1: determine the genotypes of the parent plants
short plant = tt
homozygous tall plant = TT
Step 2: determine parent gametes
tt = t and t
TT = T and T
Step 3: construct a Punnett square
t | t | |
|---|---|---|
T | Tt | Tt |
T | Tt | Tt |
Step 4: determine possible allele combinations
100 % Tt
Answer (b)
Step 1: determine parent genotypes
All of the offspring of the first cross have the same genotype = Tt
Step 2: determine parent gametes
Tt = T and t
Step 3: construct a Punnett square
T | t | |
|---|---|---|
T | TT | Tt |
t | Tt | tt |
Step 4: determine allele combinations
1 x TT, 2 x Tt, 1 x tt
Step 5: determine phenotype ratio
TT and Tt = tall
tt = short
3 tall : 1 short
Answer (c)
Step 1: determine parent genotypes
The heterozygous plant will be tall with the genotype Tt
The short plant has the recessive phenotype and so must be homozygous recessive – tt
Step 2: determine parent gametes
Tt = T and t
tt = t and t
Step 3: construct a Punnett square
T | t | |
|---|---|---|
t | Tt | tt |
t | Tt | tt |
Step 4: show the results
50 % Tt = tall
50 % tt = short
Examiner Tips and Tricks
In order to ensure clarity and help examiners read your work clearly, it is good practice to:
write the dominant allele first, followed by the recessive allele
choose a letter that is obviously different as a capital than in lower case, e.g. Aa rather than Cc
Family trees
Family tree diagrams are usually used to trace the pattern of inheritance of a specific characteristic (usually a disease) through generations of a family
This can be used to work out the probability that someone in the family will inherit a genetic disorder
Family tree example
Horizontal lines between males and females indicate that two individuals are the parents of the vertically linked offspring
In this family tree:
Males are indicated by squares and females are represented by circles
Affected individuals are red outline shapes and unaffected are blue solid shapes
The family tree shows:
Both males and females are affected
Every generation has affected individuals
There is one immediate family group that has no affected parents or children
The other two families have one affected parent and at least one affected child

Predicting probability
Higher Tier Only
Offspring characteristics can be predicted by calculating the probabilities of the different phenotypes that could occur
For example, in the second genetic cross that was given in part (b) above, two plants with the genotype Tt were bred together
The possible combinations of offspring bred from these two parent plants are: TT (tall), Tt (tall), tt (short
The offspring genotypes showed a 3:1 ratio of tall : short
Using this ratio, we can calculate the probabilities of the offspring phenotypes
The probability of offspring being tall is 75%
The probability of offspring being short is 25%

Unlock more, it's free!
Join the 100,000+ Students that ❤️ Save My Exams
the (exam) results speak for themselves:

Was this revision note helpful?
Build on this topic