Hypothesis Testing for Correlation (DP IB Applications & Interpretation (AI)) : Revision Note

Hypothesis Testing for Correlation
What is a hypothesis test for correlation?
You can use a t-test to test whether there is linear correlation between two normally distributed variables
If specifically testing for positive (or negative) linear correlation then a one-tailed test is used
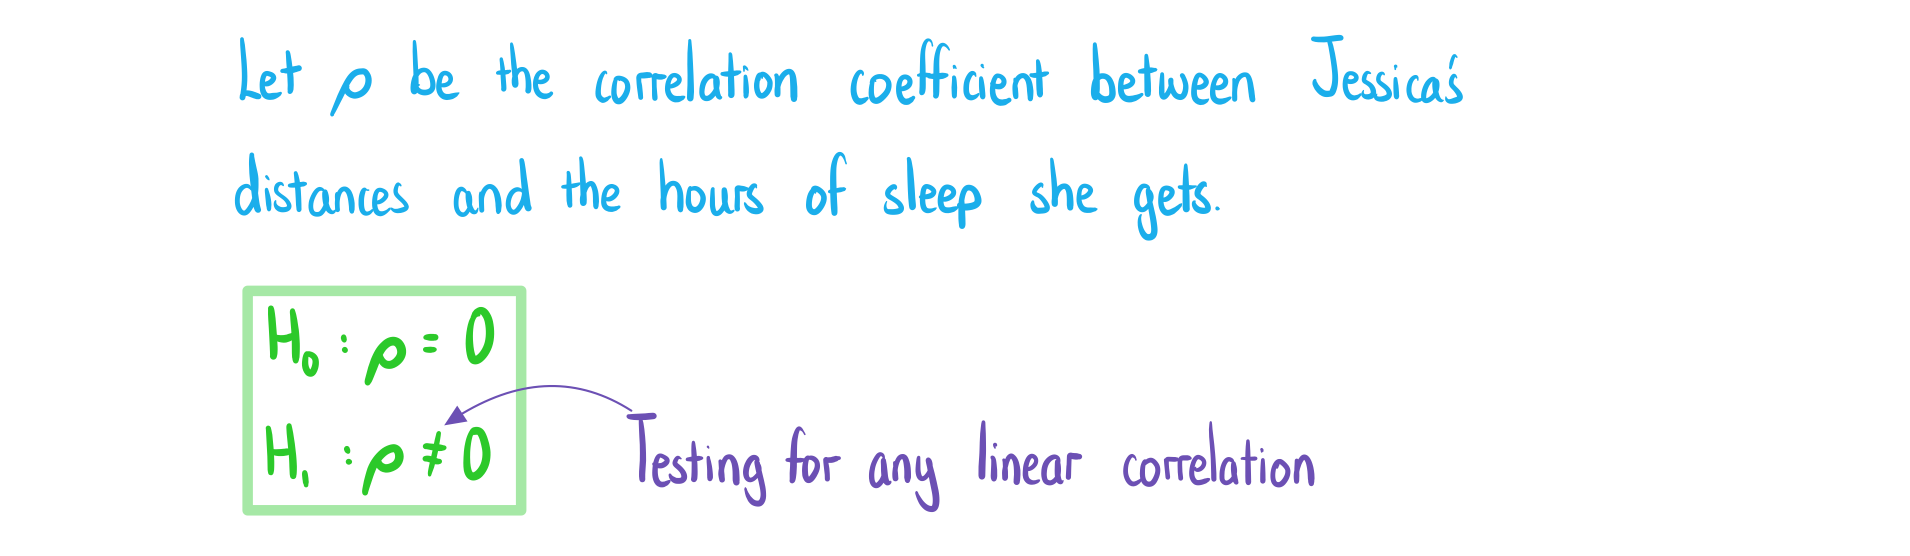
If testing for any linear correlation then a two-tailed test is used
A sample will be taken and the raw data will be given
You might be asked to calculate the PMCC (Pearson's product-moment correlation coefficient)
What are the steps for a hypothesis test for correlation?
STEP 1: Write the hypotheses
H0 : ρ = 0
Clearly state that ρ represents population correlation coefficient between the two variables
In words this means there is no correlation
H1 : ρ < 0, H1 : ρ > 0 or H1 : ρ ≠ 0
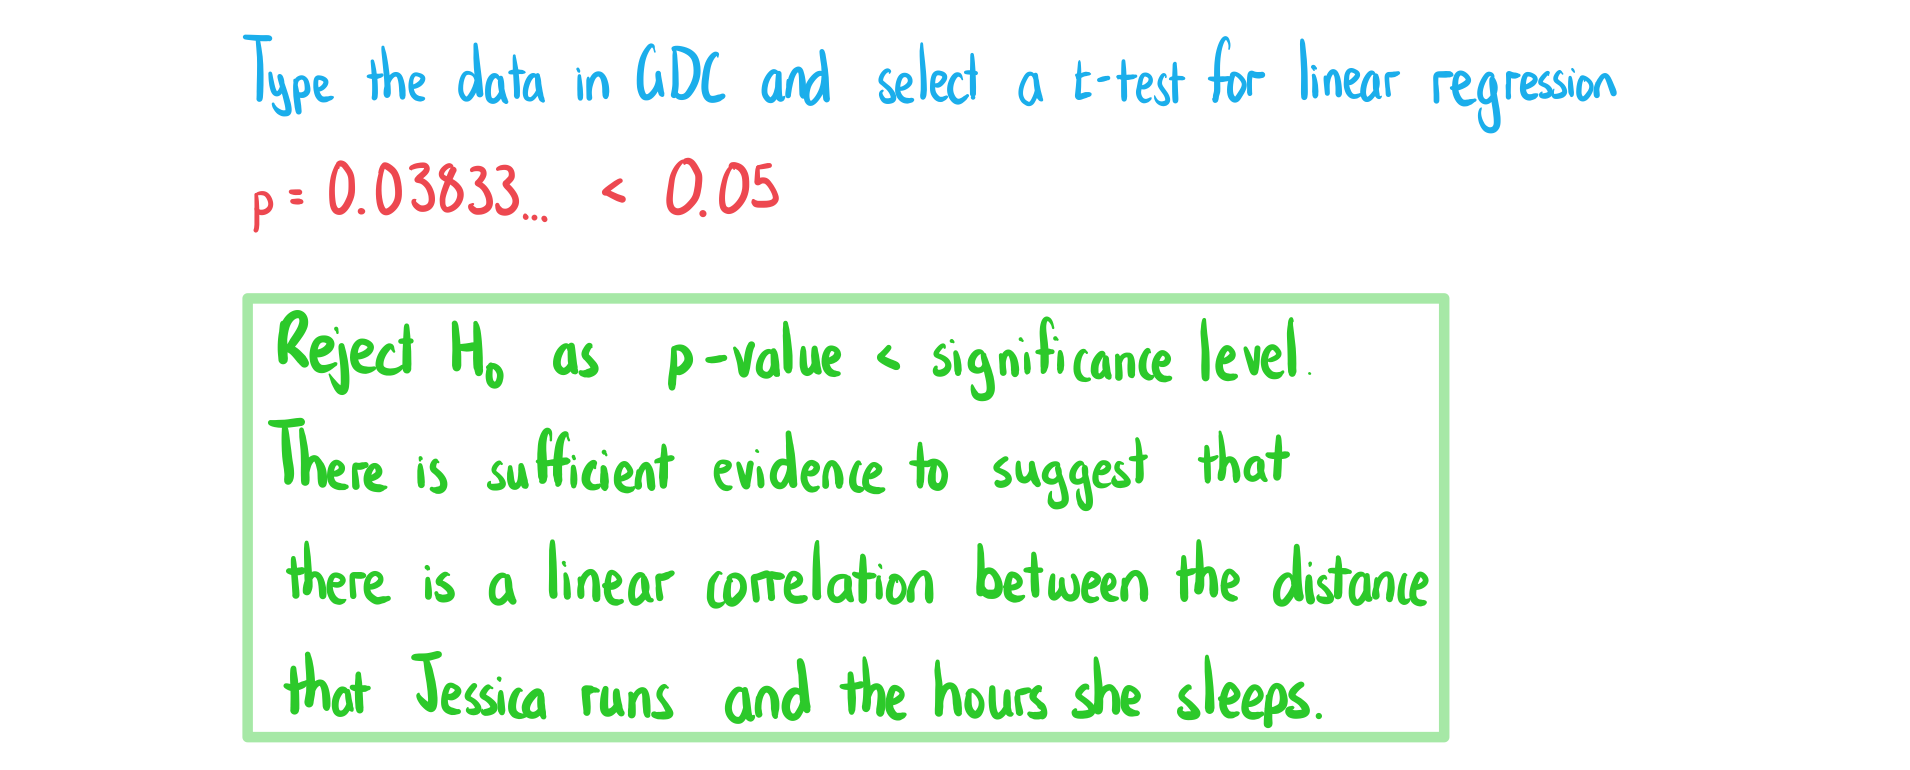
STEP 2: Calculate the p-value or the PMCC
Choose a t-test for linear regression
Enter the data as two lists into GDC
STEP 3: Decide whether there is evidence to reject the null hypothesis
If the p-value < significance level then reject H0
If the absolute value of the PMCC is bigger than the absolute value of the critical value then reject H0
If you are expected to use the PMCC you will be given the critical value in the exam
STEP 4: Write your conclusion
If you reject H0 then there is evidence to suggest that...
There is a negative linear correlation between the two variables (for H1 : ρ < 0)
There is a positive linear correlation between the two variables (for H1 : ρ > 0)
There is a linear correlation between the two variables (for H1 : ρ ≠ 0)
If you accept H0 then there is insufficient evidence to reject the null hypothesis which suggests that...
There is not a negative linear correlation between the two variables (for H1 : ρ < 0)
There is not a positive linear correlation between the two variables (for H1 : ρ > 0)
There is not a linear correlation between the two variables (for H1 : ρ ≠ 0)
Worked Example
Jessica wants to test whether there is any linear correlation between the distance she runs in a day, ![]() km, and the amount of sleep she has the night after her run,
km, and the amount of sleep she has the night after her run, ![]() hours. Over the period of a month she takes a random sample of 9 days, the results are recorded in the table.
hours. Over the period of a month she takes a random sample of 9 days, the results are recorded in the table.
Distance ( | 1.2 | 2.3 | 1.5 | 1.3 | 2.5 | 1.8 | 1.9 | 2.0 | 1.1 |
Sleep ( | 7.9 | 8.1 | 7.6 | 7.3 | 8.1 | 8.4 | 7.8 | 7.9 | 6.8 |
a) Write down null and alternative hypotheses that Jessica can use for her test.
b) Perform the hypothesis test for linear correlation using a 5% significance level. Clearly state your conclusion.

You've read 0 of your 5 free revision notes this week
Unlock more, it's free!
Did this page help you?