Statistics Toolkit (DP IB Applications & Interpretation (AI): SL): Exam Questions

3 hours28 questions
1a
2 marks

An orangutan sanctuary weighs each of its orangutans every week.

The weights, to the nearest kg, of all 18 adult males in the sanctuary are listed below.

52, 57, 63, 80, 56, 66, 101, 68, 55, 96, 70, 62, 66, 64, 99, 91, 55, 92

A convenience sample of size six is taken by using the first six weights in the list.

Calculate the mean weight of the orangutans in this sample.

1b
2 marks

Starting from the third data value, take a systematic sample of size six and re-calculate the mean weight of the male orangutans from the data set above.

1c
2 marks

Hence, state with a reason which sampling method gives the more reliable estimate of the mean weight of the 18 adult males.

2a
3 marks

A supermarket wants to find out how far its customers have travelled to shop there. One lunchtime, an employee stands at the door of the supermarket for half an hour and asks every customer who enters how far they have travelled.

(i) State the sampling method the employee is using.

(ii) State one advantage and one disadvantage of this method.

2b
2 marks

The employee is asked instead to use a different non-random sampling method to obtain a sample of 30 customers.

State the name of this method, and describe briefly how the employee could use it to obtain the sample.

3
4 marks

A pharmacy sells face masks in a variety of sizes. Its sales over a week are recorded in the table below:


Kids

Adults

Size

Small

Large

S

M

L

XL

Frequency f

29

4

8

24

15

4

(i) Write down the mode for this data.

(ii) Explain why, in this case, the mode from part (i) would not be particularly helpful to the shop owner when reordering masks.

(iii) Given that the shop is open every day of the week, calculate the mean number of masks sold per day.

4
3 marks

A wildlife research team measures the lengths, l cm, of a sample of nine otters, to the nearest centimetre. The lengths are shown below.

76 77 91 65 63 83 92 61 88

Find the mean and the standard deviation of these lengths.

5a
4 marks

Jeanette works for a conservation charity that rescues orphaned otters. Over many years, she records the weight, in grams, of each otter when it first arrives. The data are shown in the following box and whisker diagram.

ib5-ai-sl-4-1-ib-maths-medium

(i) Write down the median weight of the otters.

(ii) Write down the lower quartile.

(iii) Find the interquartile range.

5b
3 marks

The otters are then weighed every week to track their growth. Summary statistics for the weights, in grams, of the otters after one month are shown in the following table.

Statistic

Weight (g)

Smallest weight

125

Range

48

Median

152

Upper quartile

164

Interquartile range

33

On the grid, draw a box and whisker diagram to represent these data.

ib6a-ai-sl-3-4-ib-maths-veryhard
6a
5 marks

The heights, in metres, of a flock of 20 flamingos are recorded and shown below in order of size.

0.4, 0.9, 1.0, 1.0, 1.2, 1.2, 1.2, 1.2, 1.2, 1.2,

1.3, 1.3, 1.3, 1.4, 1.4, 1.4, 1.4, 1.5, 1.5, 1.6

An outlier is a value that is less than Q1−1.5×IQR or greater than Q3+1.5×IQR.

(i) Find the lower quartile, Q1, the median, Q2, and the upper quartile, Q3.

(ii) Find the interquartile range.

(iii) Identify any outliers in these data.

6b
3 marks

Using your answers to part (a), draw a box and whisker diagram for these data on the grid below. Indicate any outliers with a cross.

ib6-ai-sl-4-1-ib-maths-medium
7a
3 marks

120 competitors enter an elimination race for charity.  Runners set off from the same start running as many laps of the course as possible.  Their total distance is tracked and the competitor who runs the furthest over a 6-hour period is the winner.  The distances runners achieved are recorded in the table below:

Distance d (miles)

Frequency f

25 ≤ d < 30

8

30 ≤ d < 35

10

35 ≤ d < 40

32

40 ≤ d < 45

54

45 ≤ d < 50

10

50 ≤ d < 55

6

On the grid below, draw a cumulative frequency graph for the information in the table.

ib6b-ai-sl-4-1-ib-maths-medium
7b
3 marks

Use your graph to estimate

(i) the median distance;

(ii) the interquartile range.

8a
2 marks

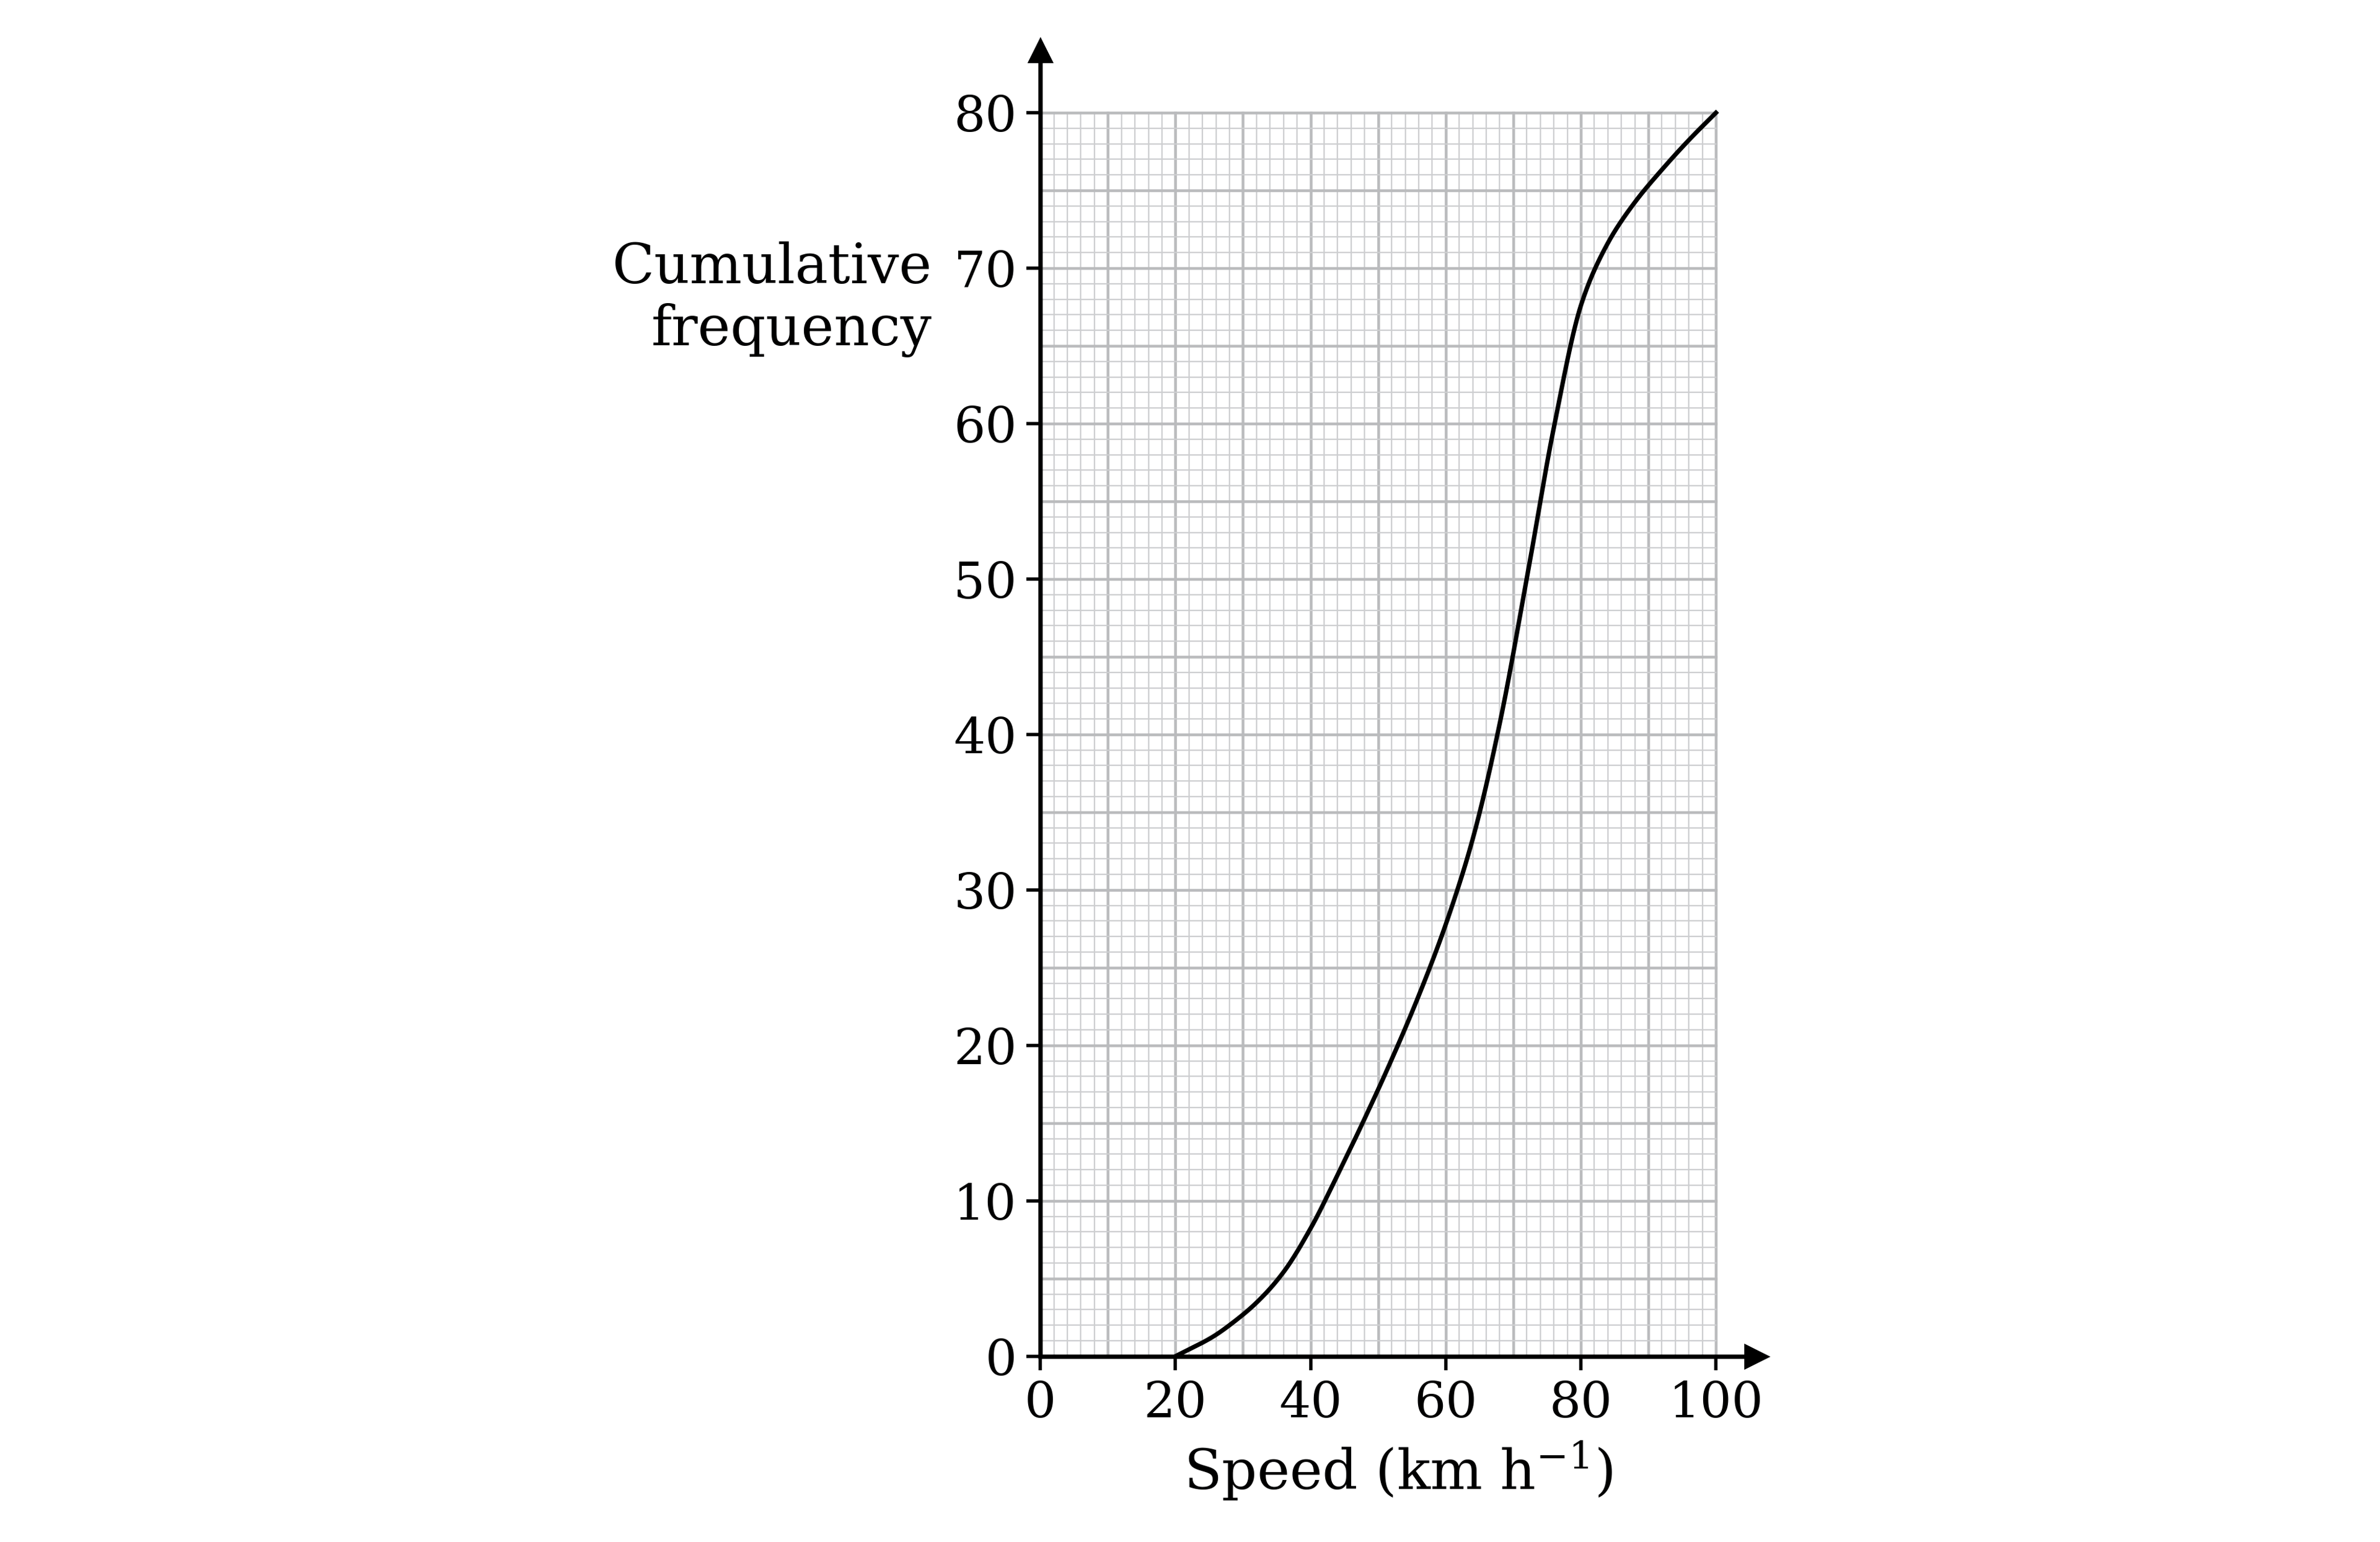
The police check the speeds of vehicles travelling along a stretch of highway. The following cumulative frequency curve shows the speeds, in km h−1, of 80 vehicles.

Cumulative frequency curve for the speeds of 80 vehicles, with speed in km per hour from 0 to 100 on the horizontal axis and cumulative frequency from 0 to 80 on the vertical axis, on a grid

Use the cumulative frequency curve to find an estimate for the median speed.

8b
3 marks

The speed limit on this stretch of highway is 80 km h−1. The police stop every vehicle that is travelling at more than 10% over the speed limit.

Use the cumulative frequency curve to estimate the percentage of these vehicles that the police stop.

9a
2 marks

The following cumulative frequency curve shows the number of hours, h, students took to complete their online driving course.  The data is taken from 80 students, randomly selected from a large sample over a 12 month period.

ib9a-ai-sl-4-1-ib-maths-medium

Find the median number of hours spent completing the online driving course.

9b
2 marks

Find the number of students whose online course time was within 1 hour of the median.

9c
2 marks

Find the interquartile range.

9d
3 marks

The same information is represented in the following table.

Hours, h

0<h≤2

2<h≤4

4<h≤7

7<h≤10

Frequency

9

p

q

6

Find the value of p and the value of q.

9e
3 marks

It is known that 10% of the students took more than d hours to complete the online driving course.

Find the value of d.

9f
3 marks

It is known that over a 12 month period, 4000 students in total sat the online driving course.

Estimate the number of students over a 12 month period who took less than 3 hours to complete the course.

10a
1 mark

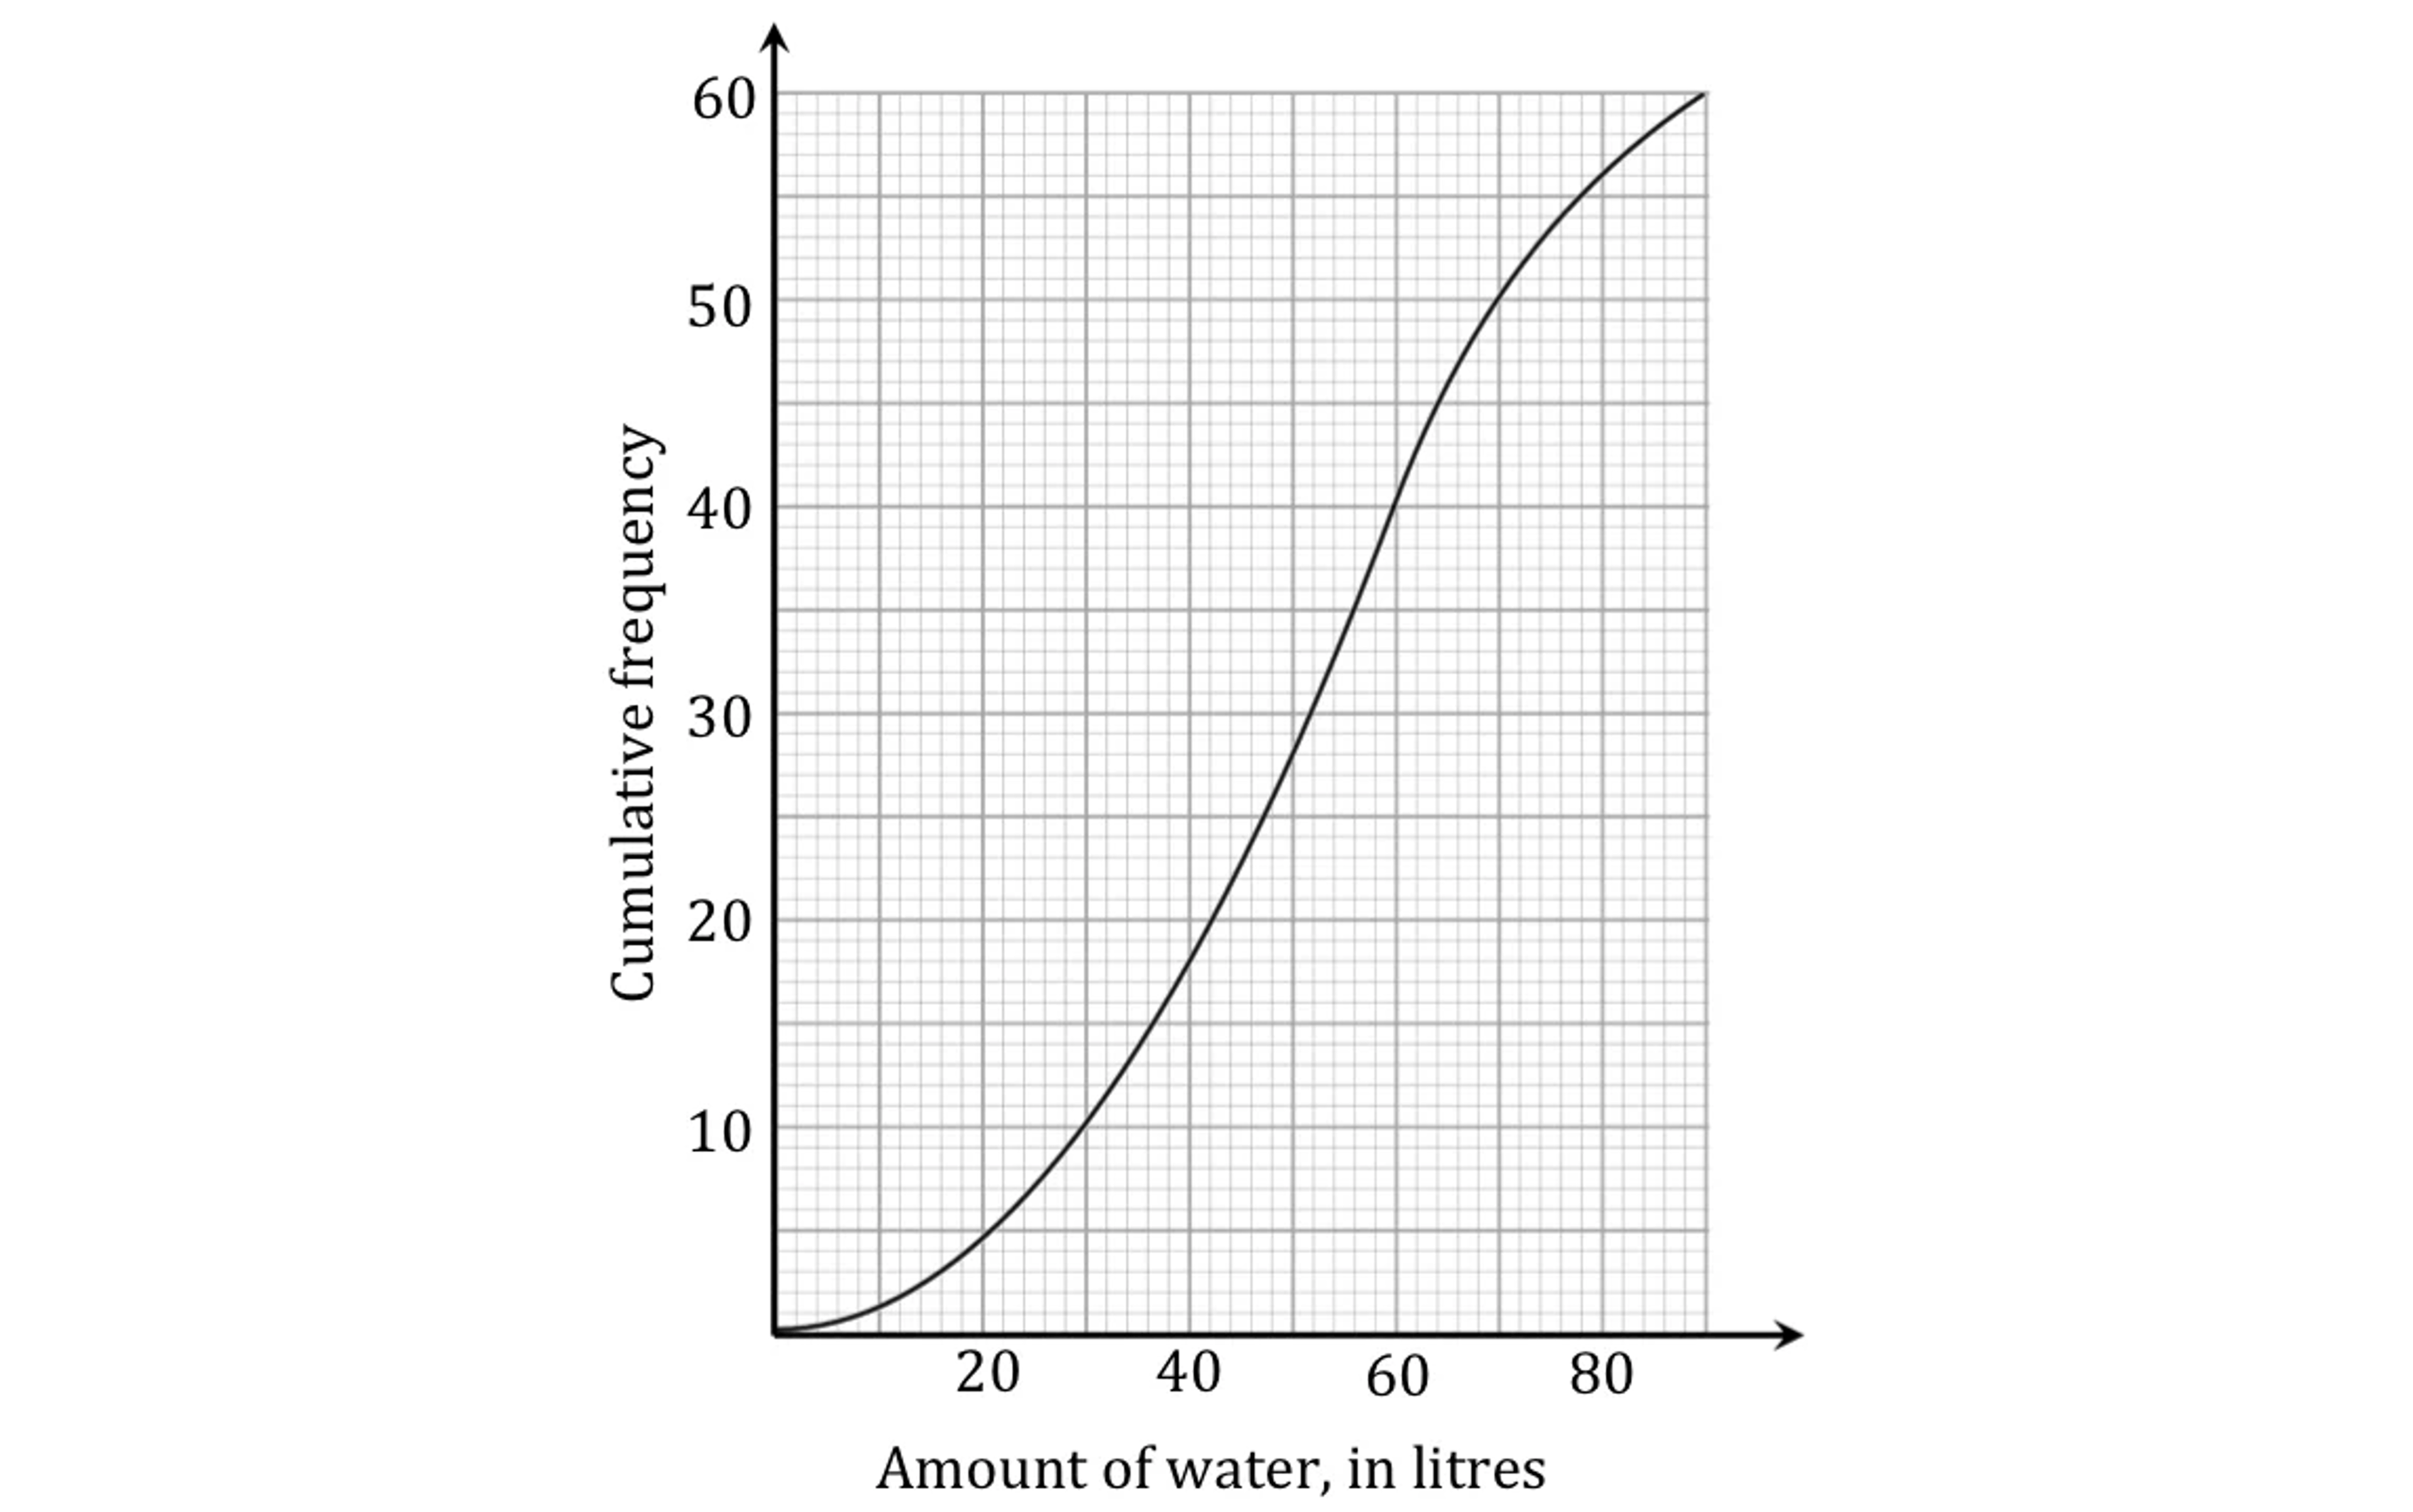
The following cumulative frequency curve shows the amount of water, in litres, that 60 people drink over a month.

ib2a-ai-sl-4-1-ib-maths-hard

State whether the data is discrete or continuous.

10b
6 marks

Complete the following frequency table.

 Litres of water, L

0≤L≤30

30<L≤50

50<L≤70

70<L≤90

 Frequency

 Cumulative Frequency 

11a
1 mark

The table below shows the points scored by two basketball players, Anna and Karo, in each of 9 games.

Anna

22

25

27

22

21

20

31

29

28

Karo

17

12

8

6

19

18

20

19

96

State a statistical measure that would help a coach who wants to measure the consistency of the players' scoring.

11b
6 marks

For both players, find

(i) the mean.

(ii) the standard deviation.

(iii) the median.

(iv) the range.

(v) the interquartile range.

11c
1 mark

Determine whether the mean or median is a better representation of Karo’s scoring ability. Justify your answer.

12
2 marks

25 people are invited to the premiere of the movie "ICE" and are asked to give the movie a whole-number score from 1 to 10. The table below shows the distribution of the scores.

Score

1

2

3

4

5

6

7

8

9

10

Frequency

1

2

1

4

5

5

1

a

3

b

It is known that a>b. Every score was given at least once.

Find the value of a and the value of b.

13a
1 mark

A shoe store wants to know which shoe size is the most popular, so it records the shoe sizes of 30 customers.

Shoe size

7

7.5

8

8.5

9

9.5

10

11

12

13

Frequency

5

1

4

p

3

3

2

1

q

1

State whether the data is discrete or continuous.

13b
2 marks

It is known that p=4q.

Find the value of

(i) p

(ii) q

13c
3 marks

Find

(i) the mean;

(ii) the median;

(iii) the mode.

13d
1 mark

State which statistical measure is most useful for the shoe store. Justify your answer.

1a
3 marks

The following cumulative frequency curve shows the distances, in kilometres, travelled to work by 160 people in Cape Town, South Africa, during 2021.

ib1a-ai-sl-4-1-ib-maths-hard

Use the cumulative frequency curve to estimate

(i) the median distance;

(ii) the lower quartile;

(iii) the upper quartile.

1b
3 marks

Draw a box and whisker diagram to represent these data.

1c
2 marks

An outlier is a value that is less than Q1−1.5×IQR or greater than Q3+1.5×IQR.

Find the largest distance travelled to work that would not be considered an outlier.

2a
3 marks

The following cumulative frequency curve shows the number of hours spent gaming per week by 120 high school students.

ib3a-ai-sl-4-1-ib-maths-hard

Find the

(i) median

(ii) interquartile range.

2b
2 marks

Find the percentage of the students who spent less than 17 hours gaming per week.

2c
1 mark

The 120 students were chosen at random by sampling 60 senior students and 60 junior students. The school has the same number of senior students as junior students.

State the sampling method used.

3a
1 mark

The histogram below shows the weights of kiwifruit, each measured to the nearest gram.

oKqm796q_image

Write down the modal weight of the kiwifruits.

3b
2 marks

Find the median weight of the kiwifruits.

3c
4 marks

An outlier is a value that is less than Q1−1.5×IQR or greater than Q3+1.5×IQR.

Find the weights, w grams, of kiwifruit that would be considered outliers.

4a
1 mark

A group of people who use a gym took part in a survey, and the ages of the participants were recorded in the following table.

Age, a years

15≤a<18

18≤a<30

30≤a<50

50≤a<65

65≤a<80

Frequency

4

x

34

28

14

It is known that 34<x<40.

Write down the mid-interval value of the class 18≤a<30.

4b
2 marks

Determine the class in which the lower quartile lies.

4c
2 marks

Use the mid-interval values to find an estimate of the mean age of the participants aged 30 or over.

4d
1 mark

The participants in this survey were chosen by selecting every person who entered the gym who was not wearing headphones.

State the sampling method used.

5a
4 marks

The table below shows the number of deliveries made by each of a group of food delivery drivers on one working day in Berlin.

Deliveries

6

7

8

9

10

11

Frequency

15

18

22

41

12

5

Find

(i) the mean number of deliveries;

(ii) the standard deviation;

(iii) the median;

(iv) the interquartile range.

5b
2 marks

An outlier is a value that is less than Q1−1.5×IQR or greater than Q3+1.5×IQR.

Determine whether a driver who made 4 deliveries is an outlier.

5c
1 mark

The delivery drivers were selected for the survey by listing their names alphabetically and then selecting every 20th name.

State the sampling method used.

6a
3 marks

The following table shows the number of passes made by each of the 11 players in a rugby team during a match.

Player

1

2

3

4

5

6

7

8

9

10

11

Number of passes

12

18

22

41

9

18

22

28

30

21

18

Find

(i) the mean;

(ii) the median;

(iii) the mode.

6b
3 marks

Find the interquartile range.

6c
3 marks

An outlier is a value that is less than Q1−1.5×IQR or greater than Q3+1.5×IQR.

Show that none of the players' numbers of passes is an outlier.

7a
4 marks

The table below shows the number of TVs in the homes of a group of school students.

Number of TVs

0

1

2

3

4

5

Frequency

12

42

56

42

30

15

Find

(i) the mean;

(ii) the standard deviation;

(iii) the median;

(iv) the interquartile range.

7b
2 marks

An outlier is a value that is less than Q1−1.5×IQR or greater than Q3+1.5×IQR.

Show that a student who has seven TVs would be considered an outlier.

7c
1 mark

The students were selected for the survey by using a random number generator to choose student ID numbers.

State the sampling method used.

8a
4 marks

The number of days off taken by employees in a company during a two-year period was recorded. The data was organised into a box and whisker diagram as shown below:

ib9a-ai-sl-4-1-ib-maths-hard

For this data, write down

(i) the maximum number of days off by an employee during the two years.

(ii) the median.

(iii) the interquartile range.

8b
2 marks

Steven claims that this box and whisker diagram can be used to infer that the percentage of employees who took between 13 and 30 days off is greater than the percentage of employees who took 25 days or more off.

State whether Steven is correct. Justify your answer.

9a
1 mark

A medium rare steak should have an internal temperature of 55°C to 56°C. Max visits 10 different steak houses. At each one he measures the internal temperature of a medium rare steak, and records the following temperatures, in C∘.

51.0, 52.1, 62.9, 49.0, 59.8, 50.2, 54.3, 47.7, 48.6, 65.4

Find the mean internal temperature of Max's recordings.

9b
3 marks

Max visits 5 more steak houses. He calculates the mean internal temperature of the steaks from all 15 steak houses to be 55.2°C.

Calculate the mean internal temperature of the steaks from the 5 additional steak houses.

9c
3 marks

Max records one final steak, which has an internal temperature of T°C.

Find the range of values of T for which the mean internal temperature of all 16 steaks is within the range for a medium rare steak.

10a
2 marks

The following table shows the percentage change in the value of an investor's portfolio in each of 12 months.

Month

Percentage change

1

−5.51

2

6.86

3

4.00

4

1.67

5

2.18

6

0.17

7

1.43

8

−2.31

9

3.31

10

−3.35

11

1.81

12

−3.24

Find

(i) the mean;

(ii) the standard deviation.

10b
1 mark

State which statistical measure, calculated in part (a), gives an indication of the volatility of the investor’s portfolio.

10c
3 marks

The value of the investor's portfolio at the beginning of the 12 months was 6000 dollars.

Find the value of the portfolio at the end of the 12 months. Give your answer correct to two decimal places.

11a
3 marks

A data set has a mean of 22 and a standard deviation of 6.

Each element of the data set has 4 subtracted from it.

Find the value of

(i) the new mean

(ii) the new standard deviation.

11b
3 marks

After each element has 4 subtracted from it, each element is divided by  23 .

Find the value of

(i) the new mean

(ii) the new variance.

12a
4 marks

At a swimming competition, the mean time of the first four swimmers, in order of finish, is 28.2 seconds. The times of the fifth and sixth swimmers are then recorded, and the mean time of the first six swimmers is 29.8 seconds. The difference between the fifth and sixth swimmers' times is 0.4 seconds.

Find the time achieved by

(i) the fifth swimmer;

(ii) the sixth swimmer.

12b
1 mark

The first swimmer's time is 25.7 seconds.

Find the range of the six times.

13a
2 marks

A group of Netflix subscribers took part in a survey, and the ages of the participants were recorded in the following table.

Age, a years

15≤a<25

25≤a<35

35≤a<45

45≤a<55

55≤a<65

Number of participants

11

62

56

x

12

It is known that 56<x<62.

Write down

(i) the modal class;

(ii) the mid-interval value of the modal class.

13b
2 marks

Determine the class in which the upper quartile lies.

13c
2 marks

Using the mid-interval values the mean of the data can be estimated to be 39.95.

Find the value of x.

13d
1 mark

The participants in this survey were chosen by randomly selecting people entering a supermarket. However, to be more efficient, the surveyor only selected people who were in groups of at least 3.

State the sampling method used.

1a
1 mark

The following box and whisker diagram shows the number of social media posts made by a group of content creators over a week.

ib5a-ai-sl-4-1-ib-maths-veryhard

State whether the data is discrete or continuous.

1b
3 marks

It is given that 7a=4b and a+b=22.

Calculate the value of

(i) a

(ii) b

1c
4 marks

An outlier is a value that is less than Q1−1.5×IQR or greater than Q3+1.5×IQR.

A content creator made k posts, where k<a. The number of posts, k, is an outlier.

Find the largest possible value of k.

2a
3 marks

The table below shows the average temperature, T °C, in a city over a normal year (not a leap year).

Temperature

 −5≤T<5

 5≤T<15

 15≤T<25

 25≤T<35

Frequency

124

 p

109

 q

It is given that p=11q.

Calculate the values of

(i) p

(ii) q

2b
3 marks

Using your GDC, estimate the value of

(i) the mean

(ii) the standard deviation.

2c
2 marks

It Is given that the mean temperature of the city over the year is 14.2 °C.

Calculate the percentage error between your estimate of the mean temperature, found in part (b) (i), and the actual mean temperature.