Did this video help you?
Frequency Tables (DP IB Maths: AI SL): Revision Note
Ungrouped Data
How are frequency tables used for ungrouped data?
- Frequency tables can be used for ungrouped data when you have lots of the same values within a data set
- They can be used to collect and present data easily
- If the value 4 has a frequency of 3 this means that there are three 4’s in the data set
How are measures of central tendency calculated from frequency tables with ungrouped data?
- The mode is the value that has the highest frequency
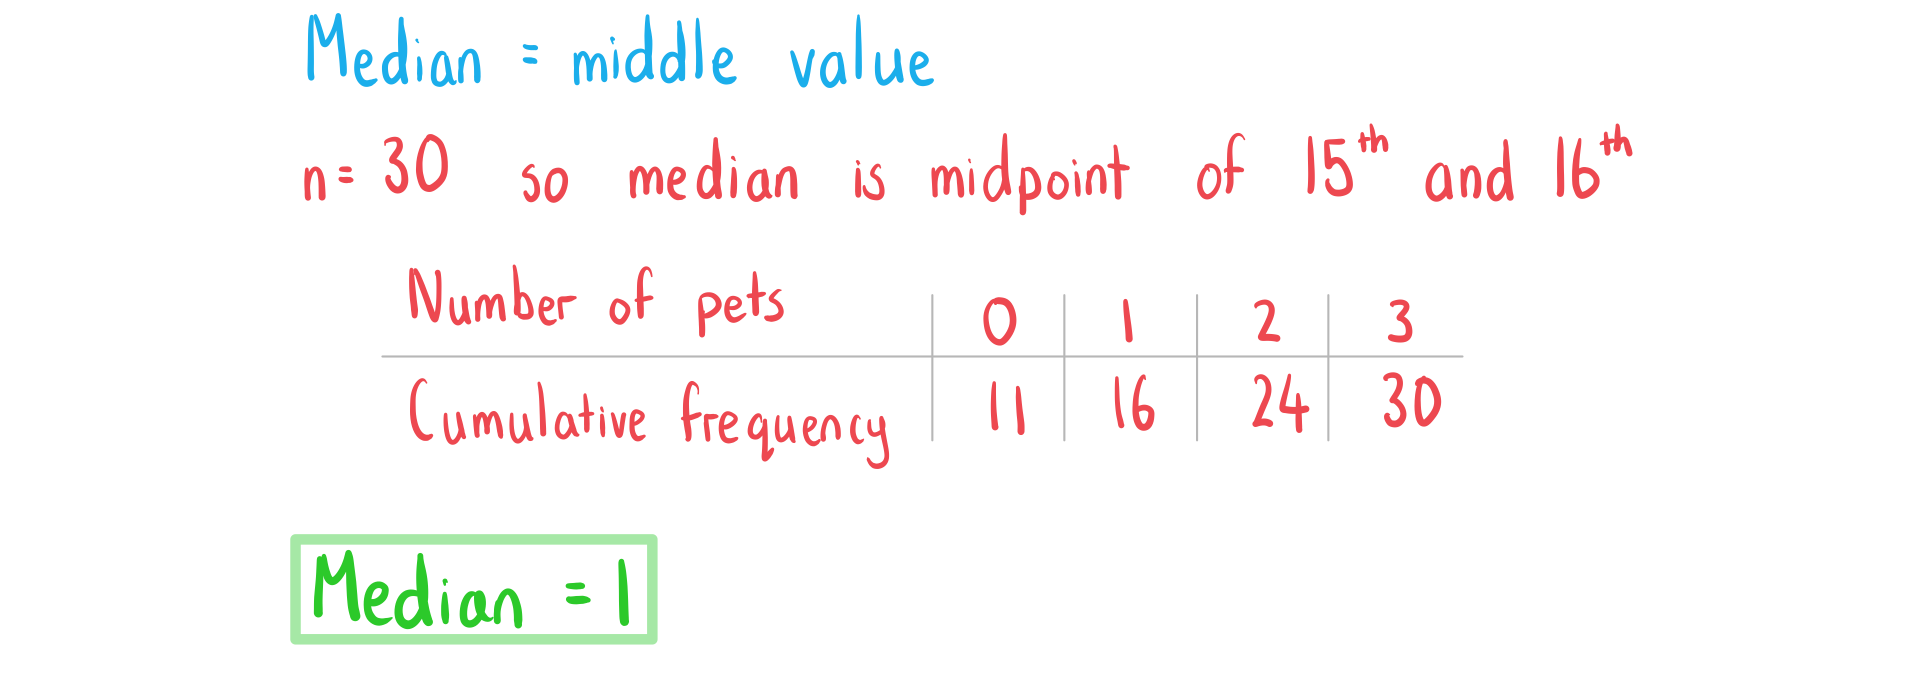
- The median is the middle value
- Use cumulative frequencies (running totals) to find the median
- The mean can be calculated by
- Multiplying each value xi by its frequency fi
- Summing to get Σfixi
- Dividing by the total frequency n = Σfi
- This is given in the formula booklet
-
- Your GDC can calculate these statistical measures if you input the values and their frequencies using the statistics mode
How are measures of dispersion calculated from frequency tables with ungrouped data?
- The range is the largest value of the data minus the smallest value of the data
- The interquartile range is calculated by
-
- The quartiles can be found by using your GDC and inputting the values and their frequencies
- The standard deviation and variance can be calculated by hand using the formulae
- Variance
-
- Standard deviation
-
- You do not need to learn these formulae as you will be expected to use your GDC to find the standard deviation and variance
- You may want to see these formulae to deepen your understanding
- You do not need to learn these formulae as you will be expected to use your GDC to find the standard deviation and variance
Examiner Tip
- Always check whether your answers make sense when using your GDC
- The value for a measure of central tendency should be within the range of data
Worked example
The frequency table below gives information number of pets owned by 30 students in a class.
| Number of pets | 0 | 1 | 2 | 3 |
| Frequency | 11 | 5 | 8 | 6 |
Find
a)
the mode.

b)
the median.

c)
the mean.

d)
the standard deviation.

Did this video help you?
Grouped Data
How are frequency tables used for grouped data?
- Frequency tables can be used for grouped data when you have lots of the same values within the same interval
- Class intervals will be written using inequalities and without gaps
and
- If the class interval
has a frequency of 3 this means there are three values in that interval
- You do not know the exact data values when you are given grouped data
- Class intervals will be written using inequalities and without gaps
How are measures of central tendency calculated from frequency tables with grouped data?
- The modal class is the class that has the highest frequency
- This is for equal class intervals only
- The median is the middle value
- The exact value can not be calculated but it can be estimated by using a cumulative frequency graph
- The exact mean can not be calculated as you do not have the raw data
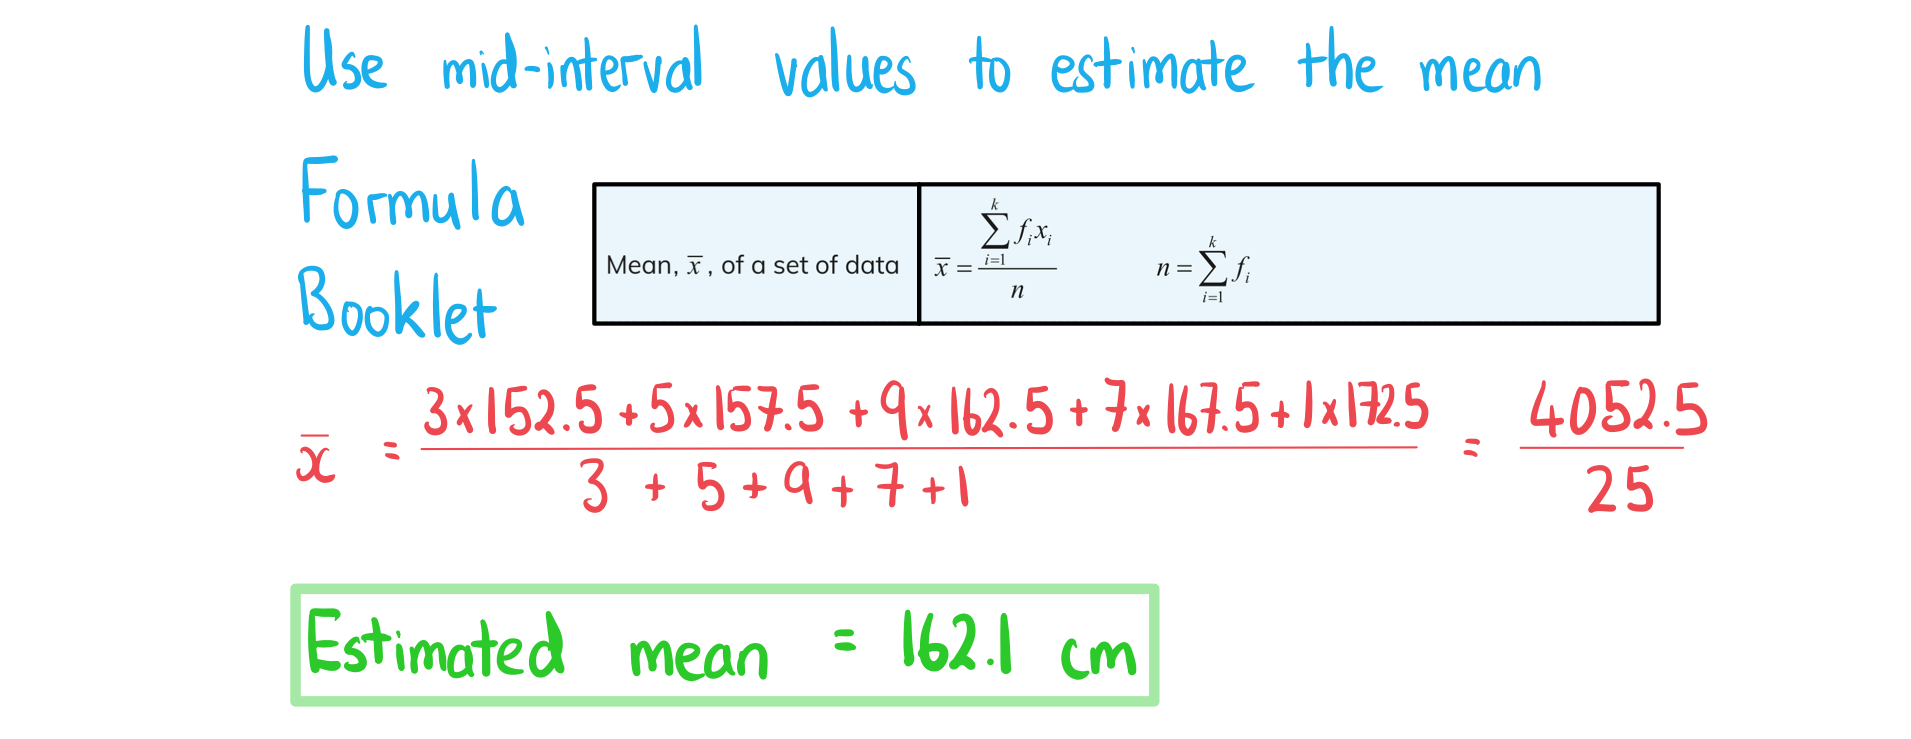
- The mean can be estimated by
- Identifying the mid-interval value (midpoint) xi for each class
- Multiplying each value by the class frequency fi
- Summing to get Σfixi
- Dividing by the total frequency n = Σfi
- This is given in the formula booklet
-
- Your GDC can estimate the mean if you input the mid-interval values and the class frequencies using the statistics mode
How are measures of dispersion calculated from frequency tables with grouped data?
- The exact range can not be calculated as the largest and smallest values are unknown
- The interquartile range can be estimated by
-
- Estimates of the quartiles can be found by using a cumulative frequency graph
- The standard deviation and variance can be estimated using the mid-interval values xi in the formulae
- Variance
-
- Standard deviation
-
- You do not need to learn these formulae as you will be expected to use your GDC to estimate the standard deviation and variance using the mid-interval values
- You may want to use these formulae to deepen your understanding
- You do not need to learn these formulae as you will be expected to use your GDC to estimate the standard deviation and variance using the mid-interval values
Examiner Tip
- As you can only estimate statistical measures from a grouped frequency table it is good practice to indicate that the values are not exact
- You can do this by rounding values rather than leaving as surds and fractions
(3sf) rather than
Worked example
The table below shows the heights in cm of a group of 25 students.
| Height, |
Frequency |
| 3 | |
| 5 | |
| 9 | |
| 7 | |
| 1 |
a)
Write down the modal class.

b)
Write down the mid-interval value of the modal class.

c)
Calculate an estimate for the mean height.


You've read 0 of your 5 free revision notes this week
Sign up now. It’s free!
Did this page help you?
