Properties of Graphs (DP IB Applications & Interpretation (AI)) : Revision Note
Did this video help you?
Quadratic Functions & Graphs
What are the key features of quadratic graphs?
A quadratic graph is of the form
where
.
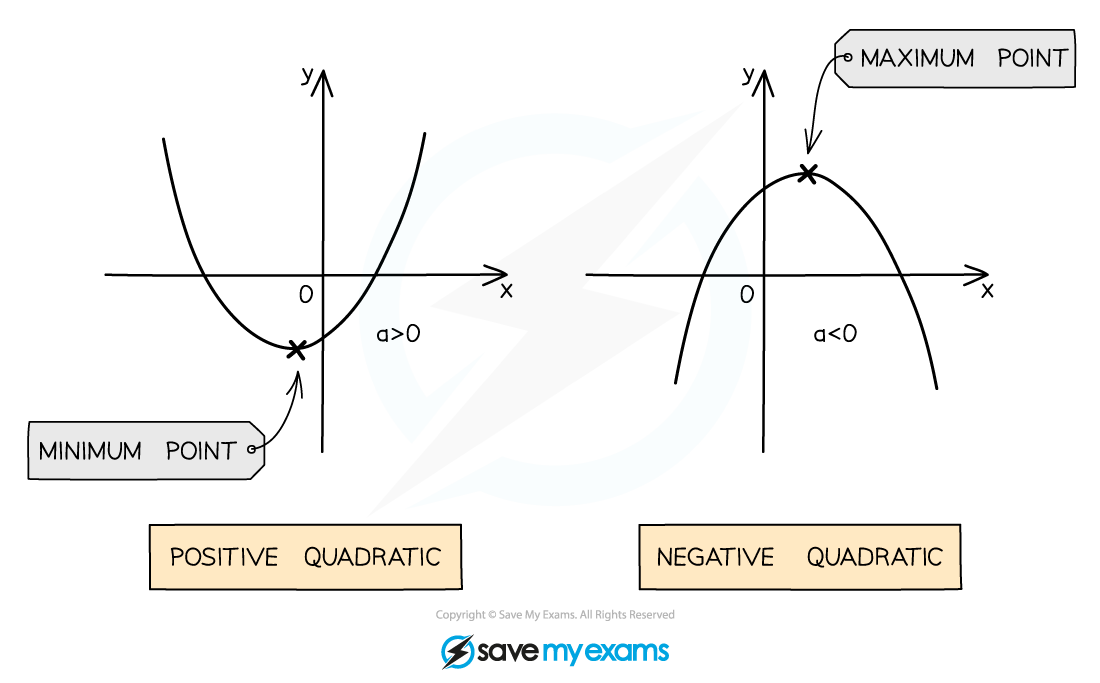
The value of a affects the shape of the curve
If a is positive the shape is
If a is negative the shape is
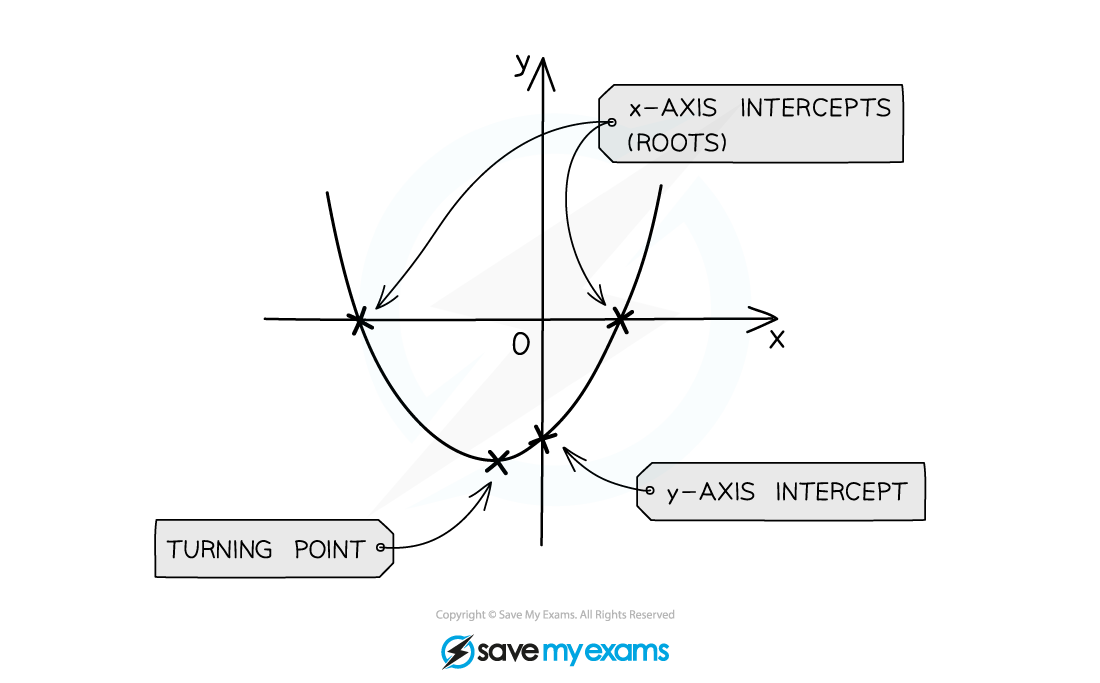
The y-intercept is at the point (0, c)
The zeros or roots are the solutions to
These can be found using your GDC or the quadratic formula
These are also called the x-intercepts
There can be 0, 1 or 2 x-intercepts
There is an axis of symmetry at
This is given in your formula booklet
If there are two x-intercepts then the axis of symmetry goes through the midpoint of them
The vertex lies on the axis of symmetry
The x-coordinate is
The y-coordinate can be found using the GDC or by calculating y when
If a is positive then the vertex is the minimum point
If a is negative then the vertex is the maximum point


Examiner Tips and Tricks
Use your GDC to find the roots and the turning point of a quadratic function
You do not need to factorise or complete the square
It is good exam technique to sketch the graph from your GDC as part of your working
Worked Example
a) Write down the equation of the axis of symmetry for the graph .

b) Sketch the graph .

Did this video help you?
Cubic Functions & Graphs
What are the key features of cubic graphs?
A cubic graph is of the form
where
.
The value of a affects the shape of the curve
If a is positive the graph goes from bottom left to top right
If a is negative the graph goes from top left to bottom right
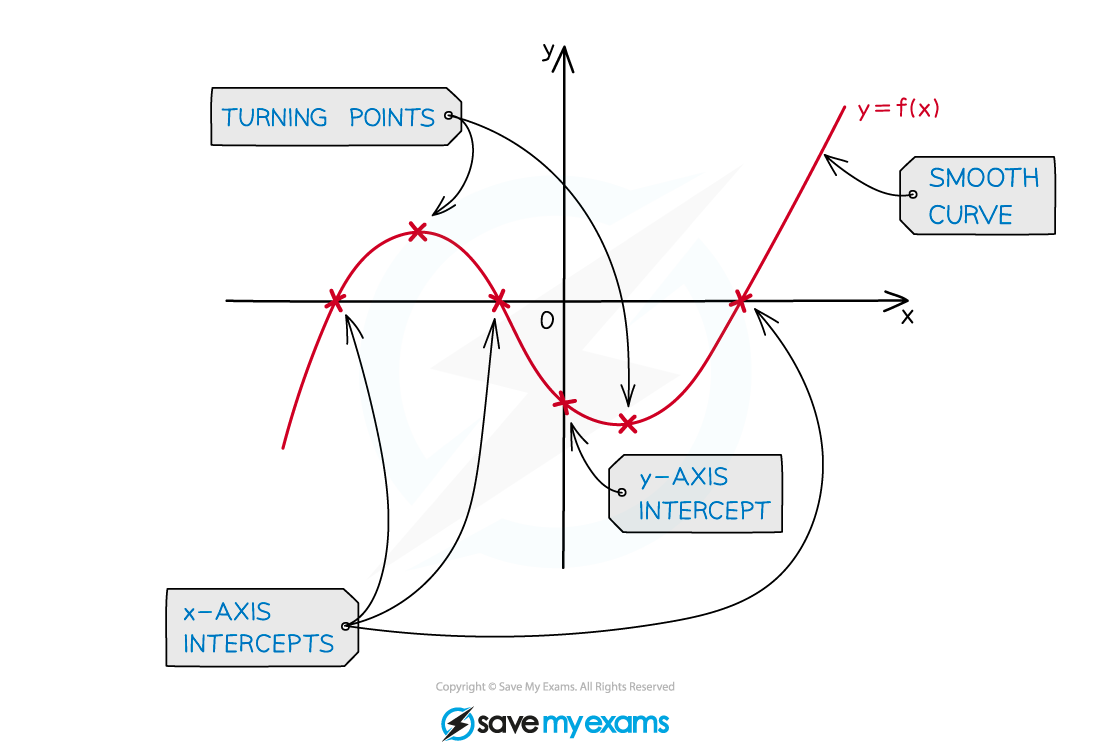
The y-intercept is at the point (0, d)
The zeros or roots are the solutions to
These can be found using your GDC
These are also called the x-intercepts
There can be 1, 2 or 3 x-intercepts
There is always at least 1
There are either 0 or 2 local minimums/maximums
If there are 0 then the curve is monotonic (always increasing or always decreasing)
If there are 2 then one is a local minimum and one is a local maximum

Examiner Tips and Tricks
You can use your GDC to find the roots, the local maximum and local minimum of a cubic function
When drawing/sketching the graph of a cubic function be sure to label all the key features
and
axes intercepts
the local maximum point
the local minimum point
Worked Example
Sketch the graph .

Did this video help you?
Exponential Functions & Graphs
What are the key features of exponential graphs?
An exponential graph is of the form
or
where
Where e is the mathematical constant 2.718…
The y-intercept is at the point (0, k + c)
There is a horizontal asymptote at y = c
The value of k determines whether the graph is above or below the asymptote
If k is positive the graph is above the asymptote
So the range is
If k is negative the graph is below the asymptote
So the range is
The coefficient of x and the constant k determine whether the graph is increasing or decreasing
If the coefficient of x and k have the same sign then graph is increasing
If the coefficient of x and k have different signs then the graph is decreasing
There is at most 1 root
It can be found using your GDC

Examiner Tips and Tricks
You may have to change the viewing window settings on your GDC to make asymptotes clear
A small scale can make it look as though the curve and an asymptote intercept
Be careful about how two exponential graphs drawn on the same axes look
Particularly which one is "on top" either side of the
-axis
Worked Example
a) On the same set of axes sketch the graphs and
. Clearly label each graph.

b) Sketch the graph .

Did this video help you?
Sinusoidal Functions & Graphs
What are the key features of sinusoidal graphs?
A sinusoidal graph is of the form
The y-intercept is at the point
(0, d) for
(0, a + d) for
The period of the graph is the length of the interval of a full cycle
This is
The maximum value is y = a + d
The minimum value is y = -a + d
The principal axis is the horizontal line halfway between the maximum and minimum values
This is y = d
The amplitude is the vertical distance from the principal axis to the maximum value
This is a

Examiner Tips and Tricks
Pay careful attention to the angles between which you are required to use or draw/sketch a sinusoidal graph
e.g. 0° ≤ x ≤ 360°
Worked Example
a) Sketch the graph for the values
.

b) State the equation of the principal axis of the curve.

c) State the period and amplitude.


You've read 0 of your 5 free revision notes this week
Unlock more, it's free!
Did this page help you?
