Graphing Functions & Their Key Features (DP IB Applications & Interpretation (AI)): Revision Note
Did this video help you?
Graphing functions
How do I sketch the graph of y = f(x)?
The function
can be sketched using the equation
where
the
-axis shows the inputs (domain)
the
-axis shows the outputs (range)
e.g. if
then
is a point on the graph
Examiner Tips and Tricks
You can use your GDC in graphing mode to sketch .
You could be asked to sketch the sum or difference of two functions
Use your GDC to plot
or
What is the difference between“sketch” and “draw”?
If asked to sketch then you need to create an image that includes
the coordinate axes
labelled
and
the general shape of a curve
drawn freehand
this does not have to be exact
key points labelled with coordinates
e.g. points of intersections with axes
If asked to draw then you need to
use a pencil and ruler
draw to scale
add labelled axes
plot any points accurately
you may need a table of values
join points with a straight line or smooth curve
How do I use my GDC to help sketch a graph?
First use your GDC to plot the graph
then find any key points
including their coordinates
then create a sketch of the graph shown on the GDC screen
Examiner Tips and Tricks
Check the scales and the zoom on your GDC to make sure you capture the full shape of the graph.
Did this video help you?
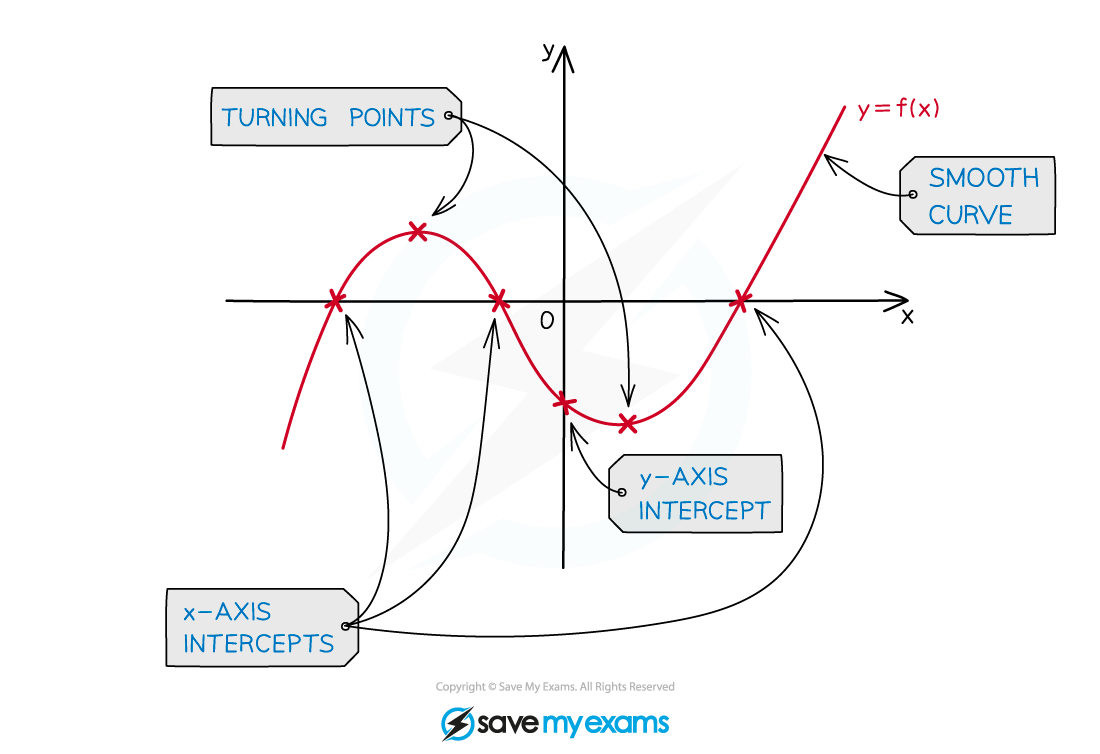
Key features of graphs
What are the key features of graphs?
You should be familiar with the following key features and know how to use your GDC to find them
Local minimums/maximums
Also called turning points
where the graph changes its direction between upwards and downwards
A graph can have multiple local minimums/maximums
A local minimum/maximum is not necessarily the minimum/maximum of the whole graph
This would be called the global minimum/maximum
For quadratic graphs the minimum/maximum is called the vertex
Intercepts
– intercepts are where the graph crosses the
-axis
At these points
– intercepts are where the graph crosses the
-axis
At these points
These points are also called the zeros of the function
or roots of the equation
Symmetry
Some graphs have symmetry
e.g. a quadratic has a vertical line of symmetry
Asymptotes
These are lines which the graph will get closer to but not cross
These can be horizontal or vertical
Exponential graphs have horizontal asymptotes
e.g.
has the asymptote
Reciprocal graphs have horizontal and vertical asymptotes
e.g.
has the asymptotes
and

Examiner Tips and Tricks
If you have answered a question by plotting a graph on your GDC, it is a good idea to sketch the graph as part of your working.
Examiner Tips and Tricks
Most GDCs do not plot or highlight asymptotes, which can make them easy to miss.
Try looking at the equation of the graph instead, e.g. has an asymptote at
.
Worked Example
Two functions are defined by
and
(a) Draw the graph of .
Answer:

(b) Sketch the graph of .
Answer:


Unlock more, it's free!
Was this revision note helpful?
