Taro discovers a group of rocks and decides to measure their thickness, , and weight,
. The results are shown below.
|
Thickness, |
2.2 |
4.5 |
3.2 |
2.8 |
3.7 |
|
Weight, |
2.6 |
3.6 |
2.7 |
3.0 |
2.9 |
Taro draws a line of best fit through the data points using the equation .
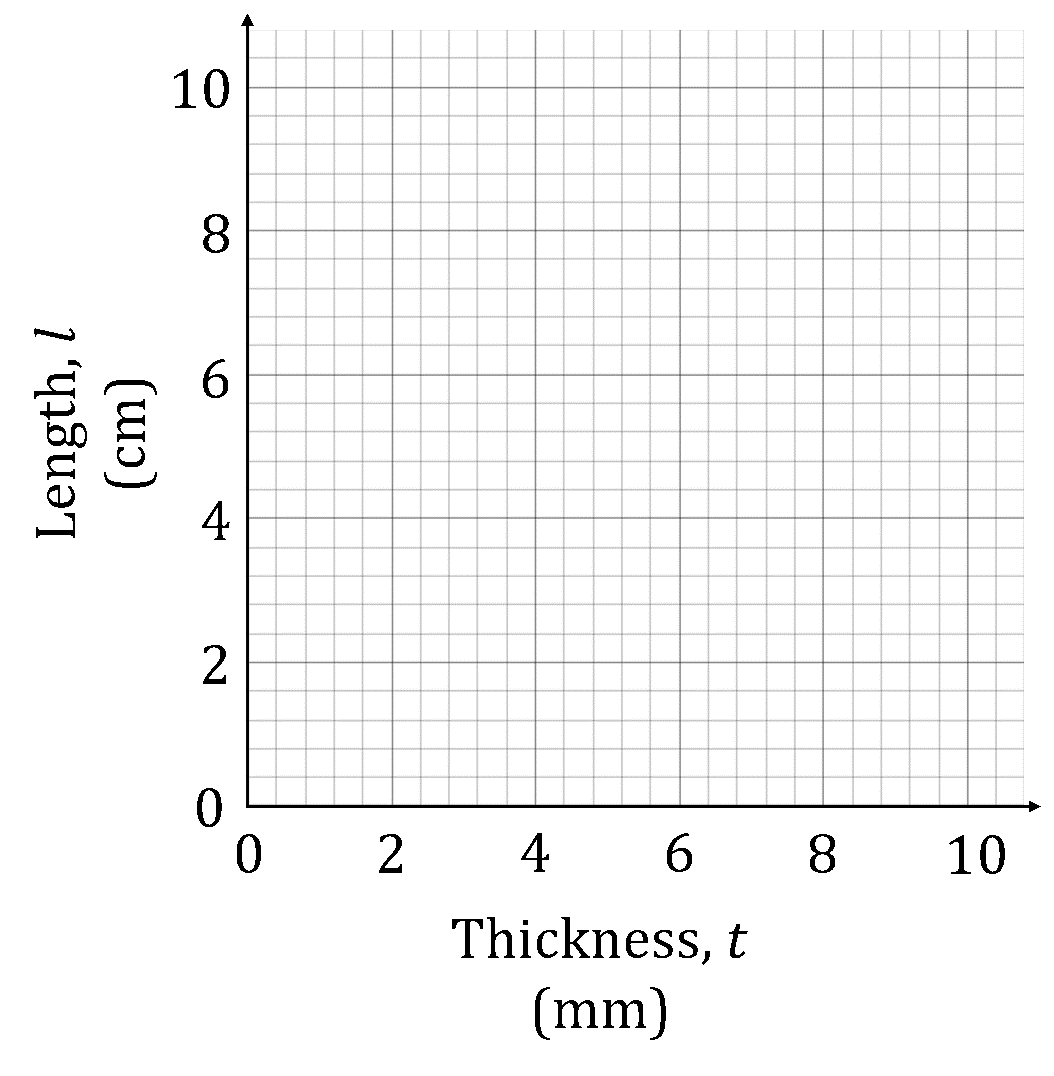
Draw a scatter diagram of the data and sketch the given line of best fit on the same axes.
Calculate the residual of each point.
Hence find the sum of the squared residuals, .
Comment on the fit of the model to the data.
Did this page help you?


