Voronoi Diagrams (DP IB Applications & Interpretation (AI)) : Revision Note

Did this video help you?
Drawing Voronoi Diagrams
What are Voronoi Diagrams?
A Voronoi diagram shows the region containing the set of all points which are closer to one given site than to any other site on the diagram
A site is located at the coordinates of a specific place of interest on a Voronoi diagram
It will be partitioned into a number of regions
These regions are often called Voronoi cells and will be polygons
There will be the same number of regions as sites on the diagram
For example, if a city contains five parks a Voronoi diagram could be drawn for that city dividing it into five regions based on their closest park
The edges of each region will be the perpendicular bisector of two of the sites
The edges may also be called boundaries
The vertices of each region are the intersections of three of these perpendicular bisectors
The perpendicular bisectors of three individual points will always intersect at the point that is equidistant from the three points
How are Voronoi diagrams drawn for three sites?
You will not be expected to draw a Voronoi diagram from scratch, however you should understand how one is constructed
First, the perpendicular bisector of the line segment joining each pair of sites will be constructed
These should be constructed using dashed lines as only a part of each line will be needed for the final diagram
The points of intersection of these perpendicular bisectors will create the vertices
Each perpendicular bisector should stop when it meets another perpendicular bisector
Remove the part of the perpendicular bisector that is not in the region of the two sites
No perpendicular bisector should cross over another
This will form the regions, or cells
How are Voronoi diagrams drawn for more than three sites?
It is challenging to draw a Voronoi diagram from scratch if it has more than three sites
In this case it is easiest to draw the Voronoi diagram for three sites first and then add the next sites one by one following these steps
STEP 1: The fourth site will be in one of the cells containing an existing site
Draw the perpendicular bisector of the line segment between these two sites
STEP 2: Stop this new line at the point where it meets an existing boundary in the Voronoi diagram
STEP 3: There will now be an existing edge in the region of the new site
This should be shortened to meet the new boundary
STEP 4: The fourth site will now be in the same cell as a different existing site
Draw the perpendicular bisector of the line segment between these two sites
This is the step you will most likely carry out in an exam
You may be asked to find the equation of a missing edge
This will mean finding the equation of the perpendicular bisector between the two sites that are both within one region
You may be asked to add the location of a missing site to the Voronoi diagram
This will mean using the given edge of one or two of the regions and finding the second site that would make this edge a perpendicular bisector
Draw a perpendicular line from the site to the edge
Check the distance of this line and then continue it on the other site of the edge for the same distance
This will be the location of your new site
You may need to find the gradients of the edges you have and then use the negative reciprocal to find the gradient of the perpendicular bisector of the current and new site
Examiner Tips and Tricks
Make sure that you have a straight edge and an eraser with you in the exam so that any perpendicular bisectors that you draw are clear and any mistakes that are made can be erased
If you are asked to adjust a given Voronoi diagram and a perpendicular bisector that needs to be removed or shortened, you can put a series of little lines along it to indicate that it is crossed out
Worked Example
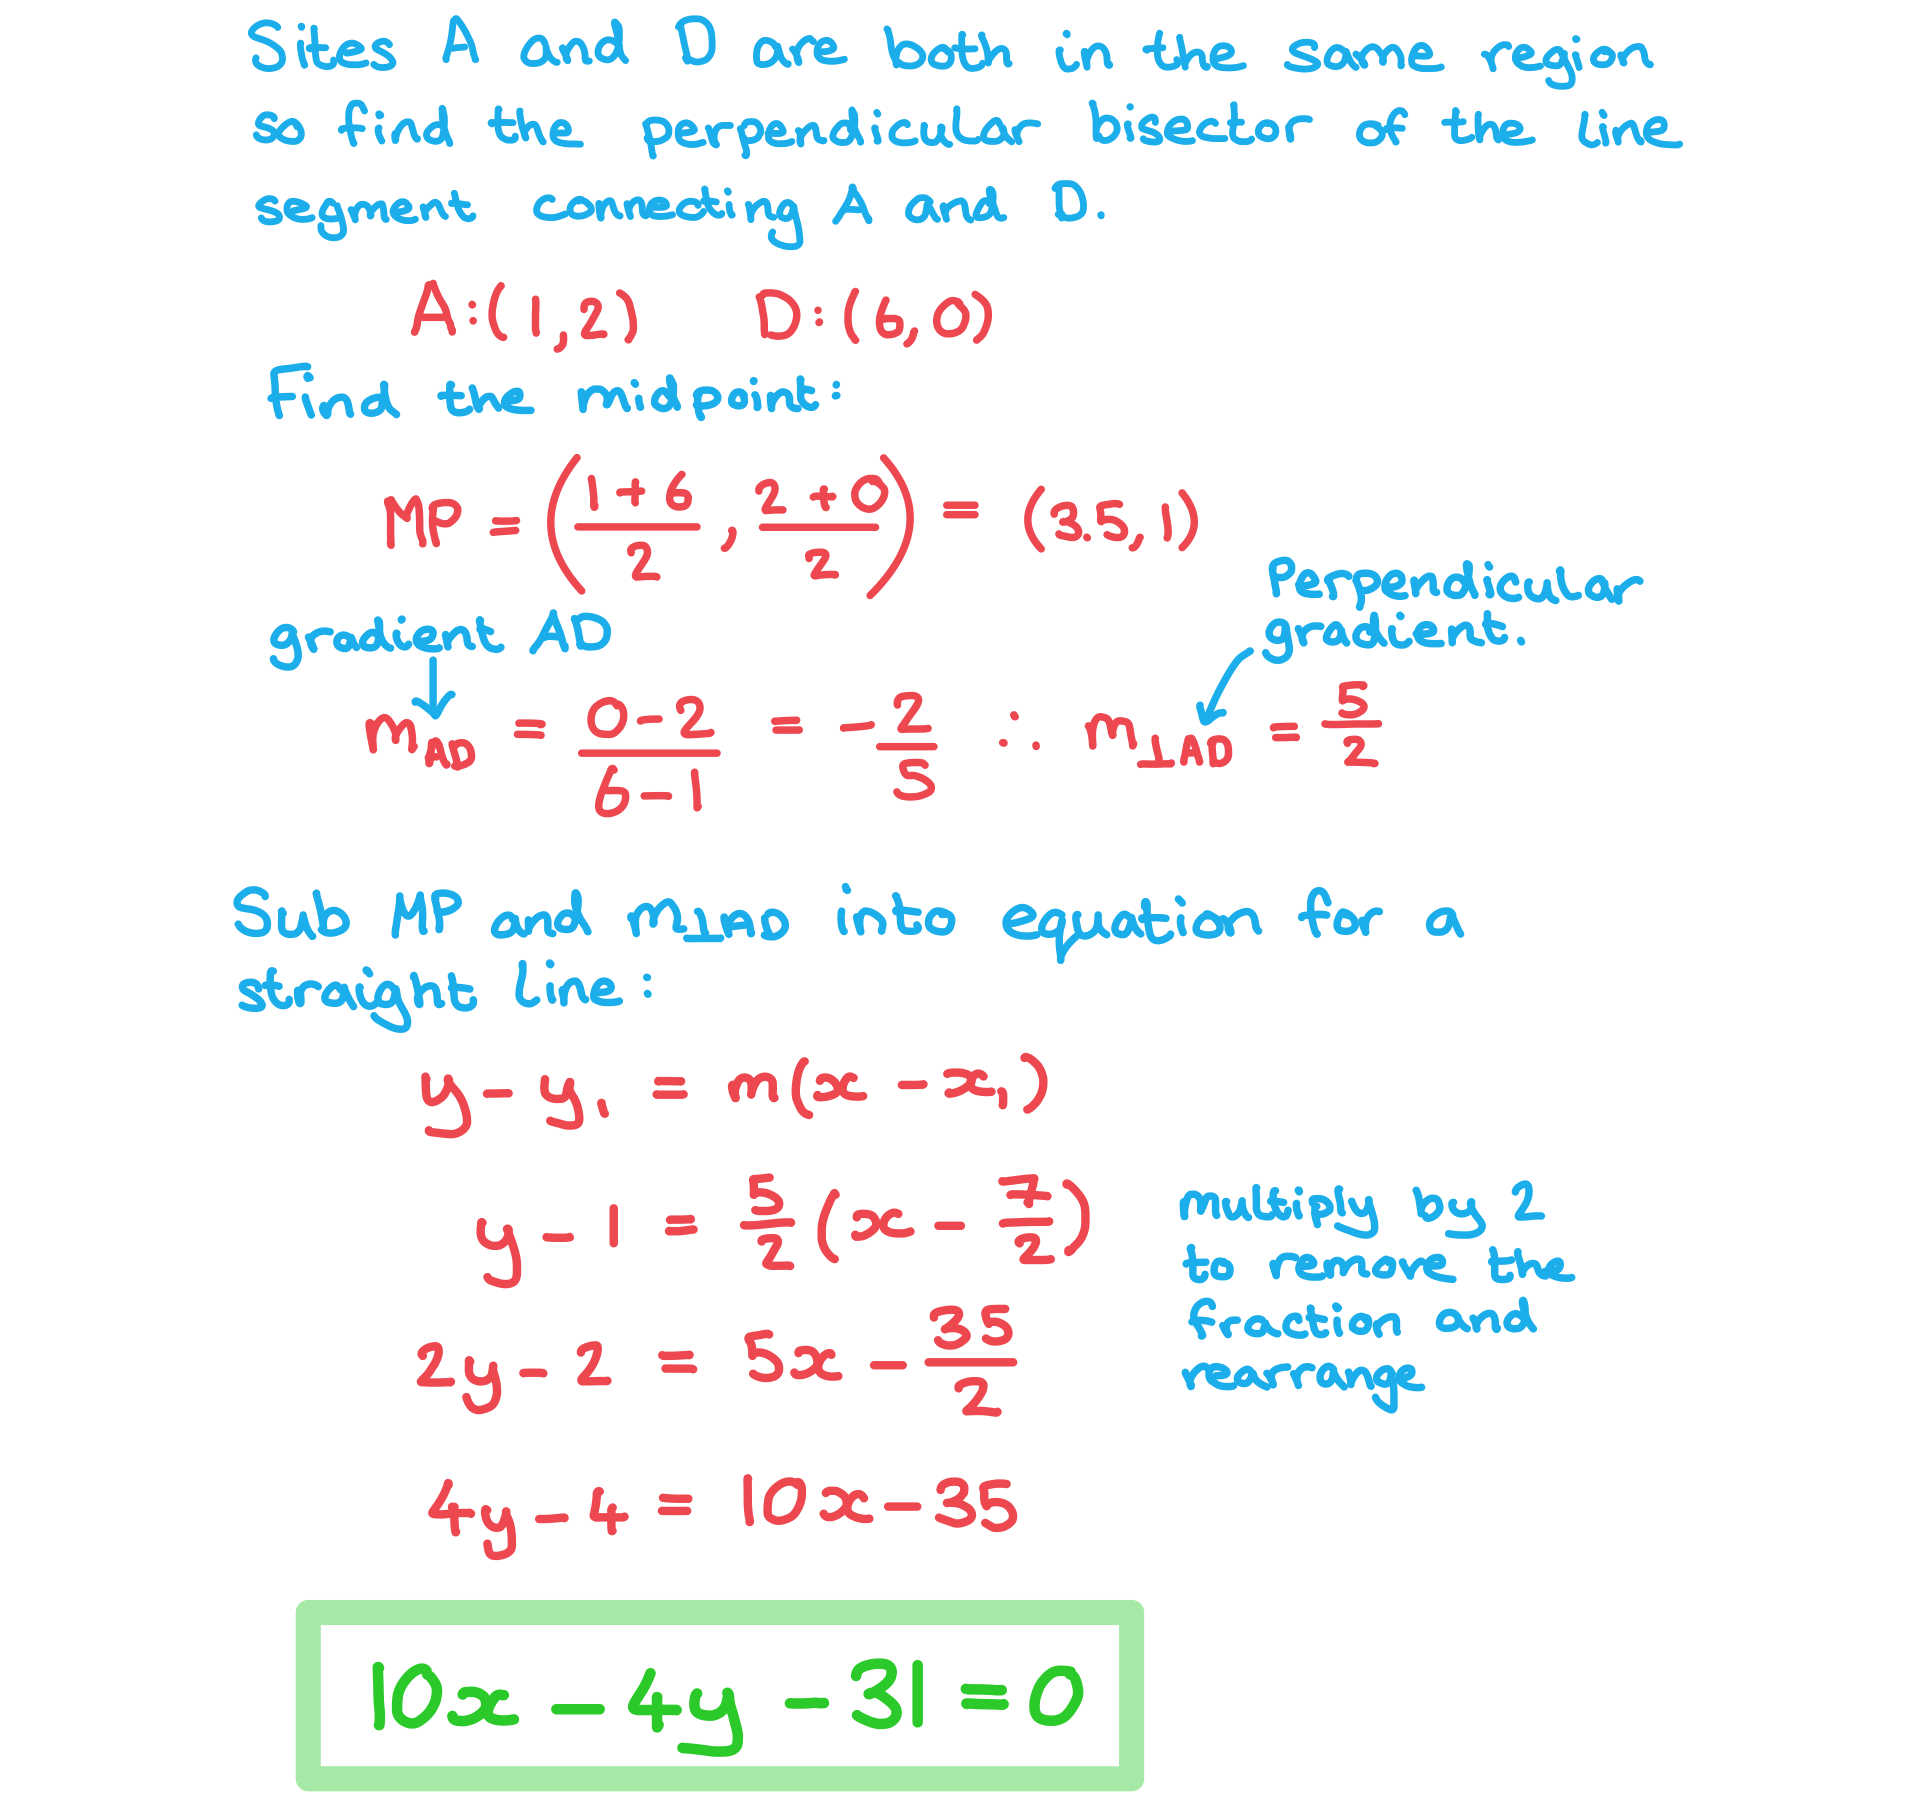
The Voronoi diagram below shows sites A, B, C and D.
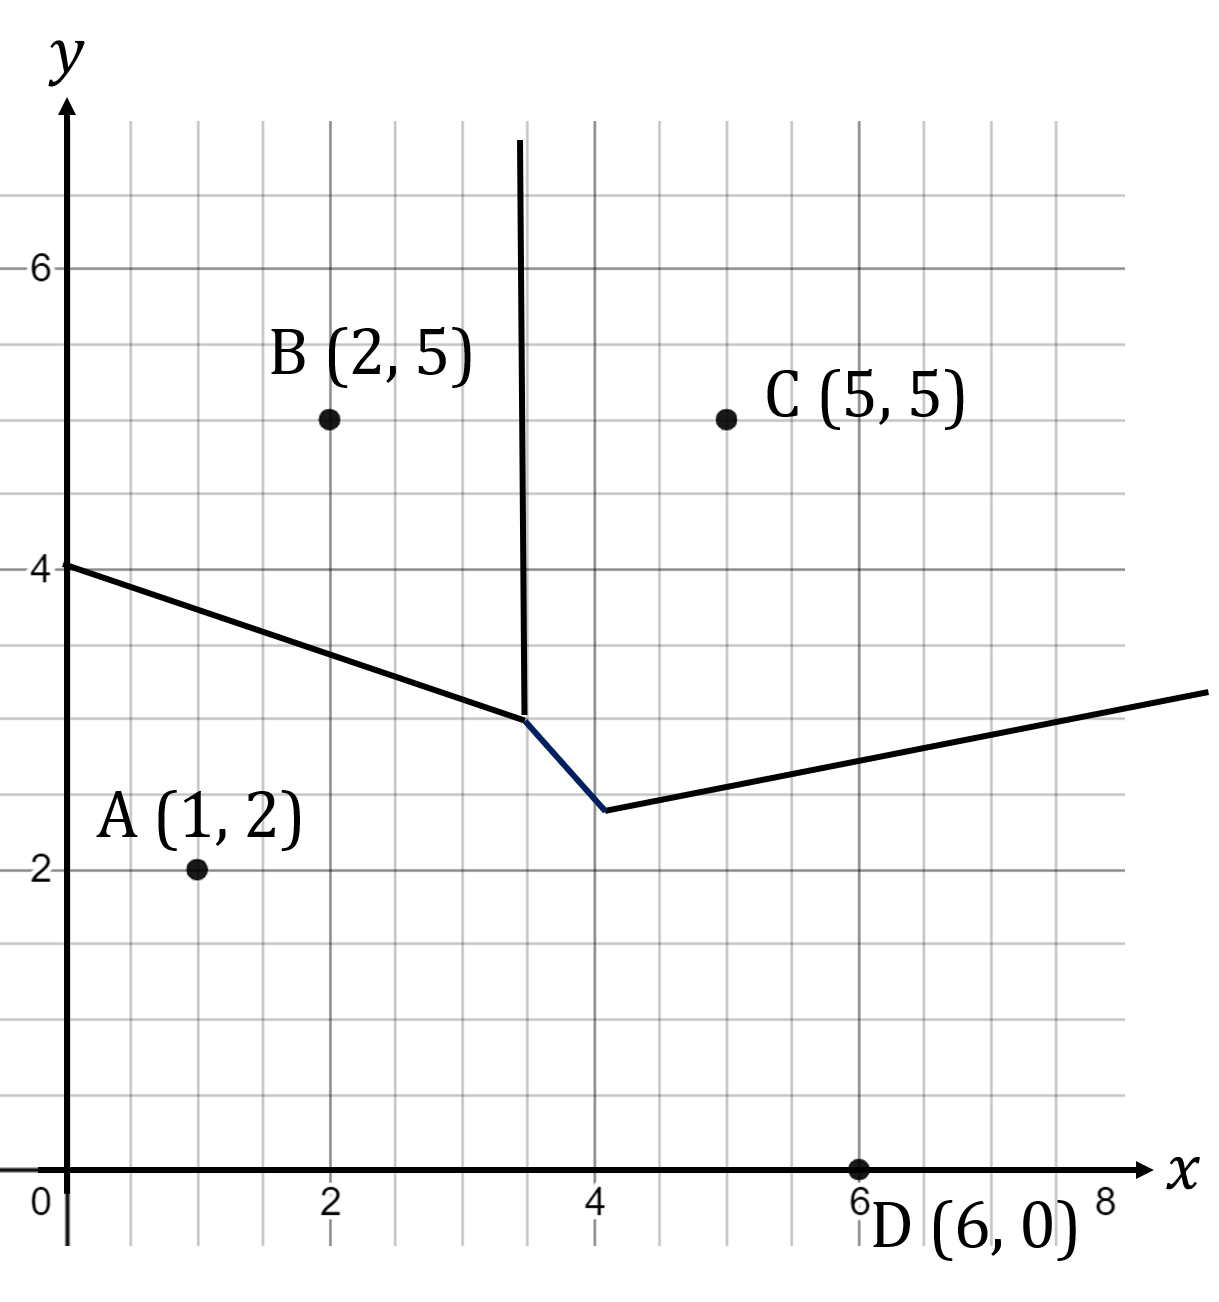
a) Explain how you know that the Voronoi diagram is incomplete.

b) Find the equation of the line which would complete the Voronoi cell containing site A.
Give your answer in the form ![]() where
where ![]() .
.
Did this video help you?
Interpreting Voronoi Diagrams
What is a Voronoi diagram used for?
Voronoi diagrams are often used in land management to work out where the best location would be according to where sites are already situated
They can show where to put something to make sure that it is
Closest to a particular site
Closer to one site than another
Equidistant from two or three specific sites
As far as possible from any other site
What do I need to know about Voronoi diagrams?
You may be asked to find the shortest distance from a point to its closest site
Use Pythagoras’ Theorem to find the distance between the given coordinate and the site in the same region as it
If the coordinate is on an edge then there will be two sites equidistant from it
You may be asked to find the point which is furthest from any of the sites
This will be one of the vertices
To choose which vertex look at which is the centre of the largest empty circle
You may be asked to estimate the success of a new site
This is done by looking at the data for the nearest site
The prediction for the new site would be assumed to be the same
This is called nearest neighbour interpolation
Worked Example
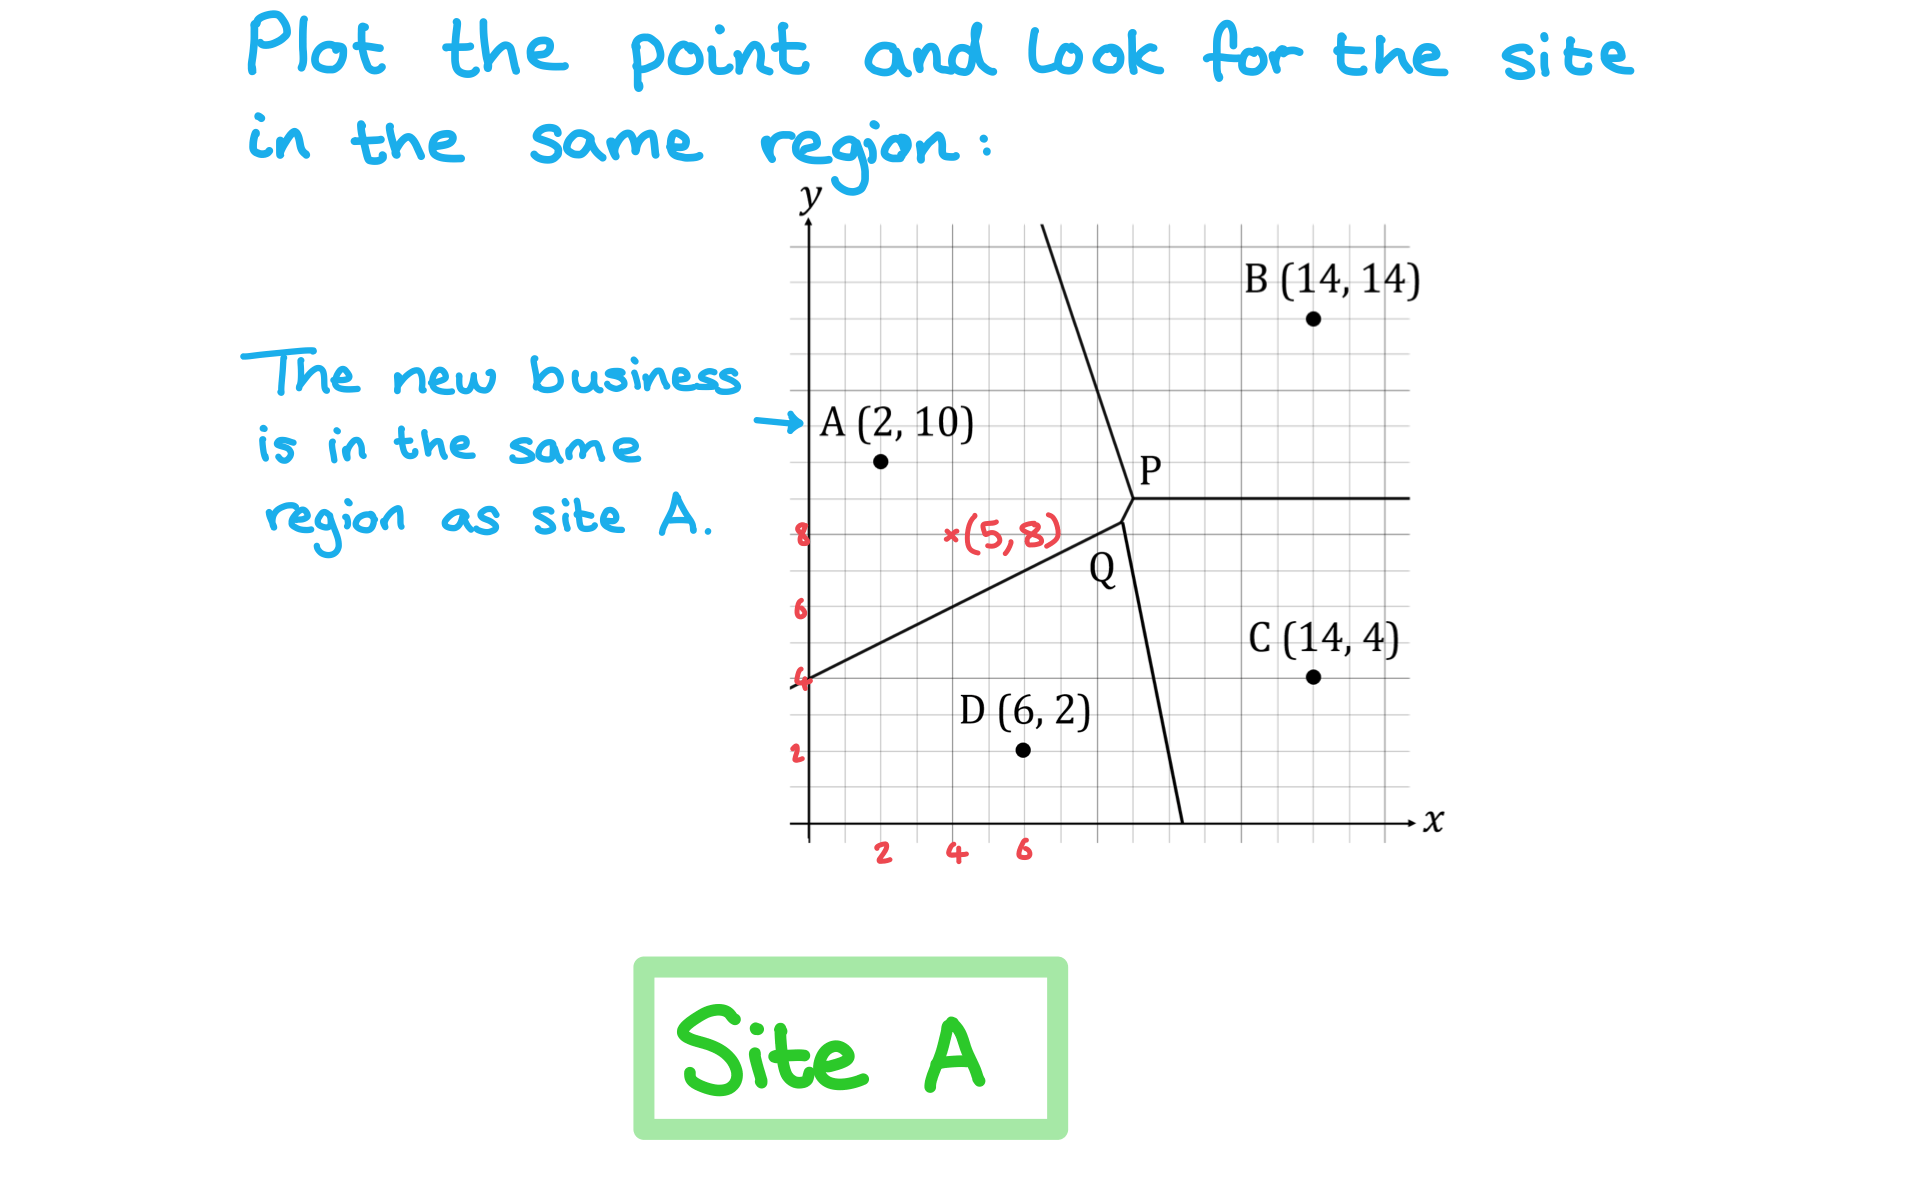
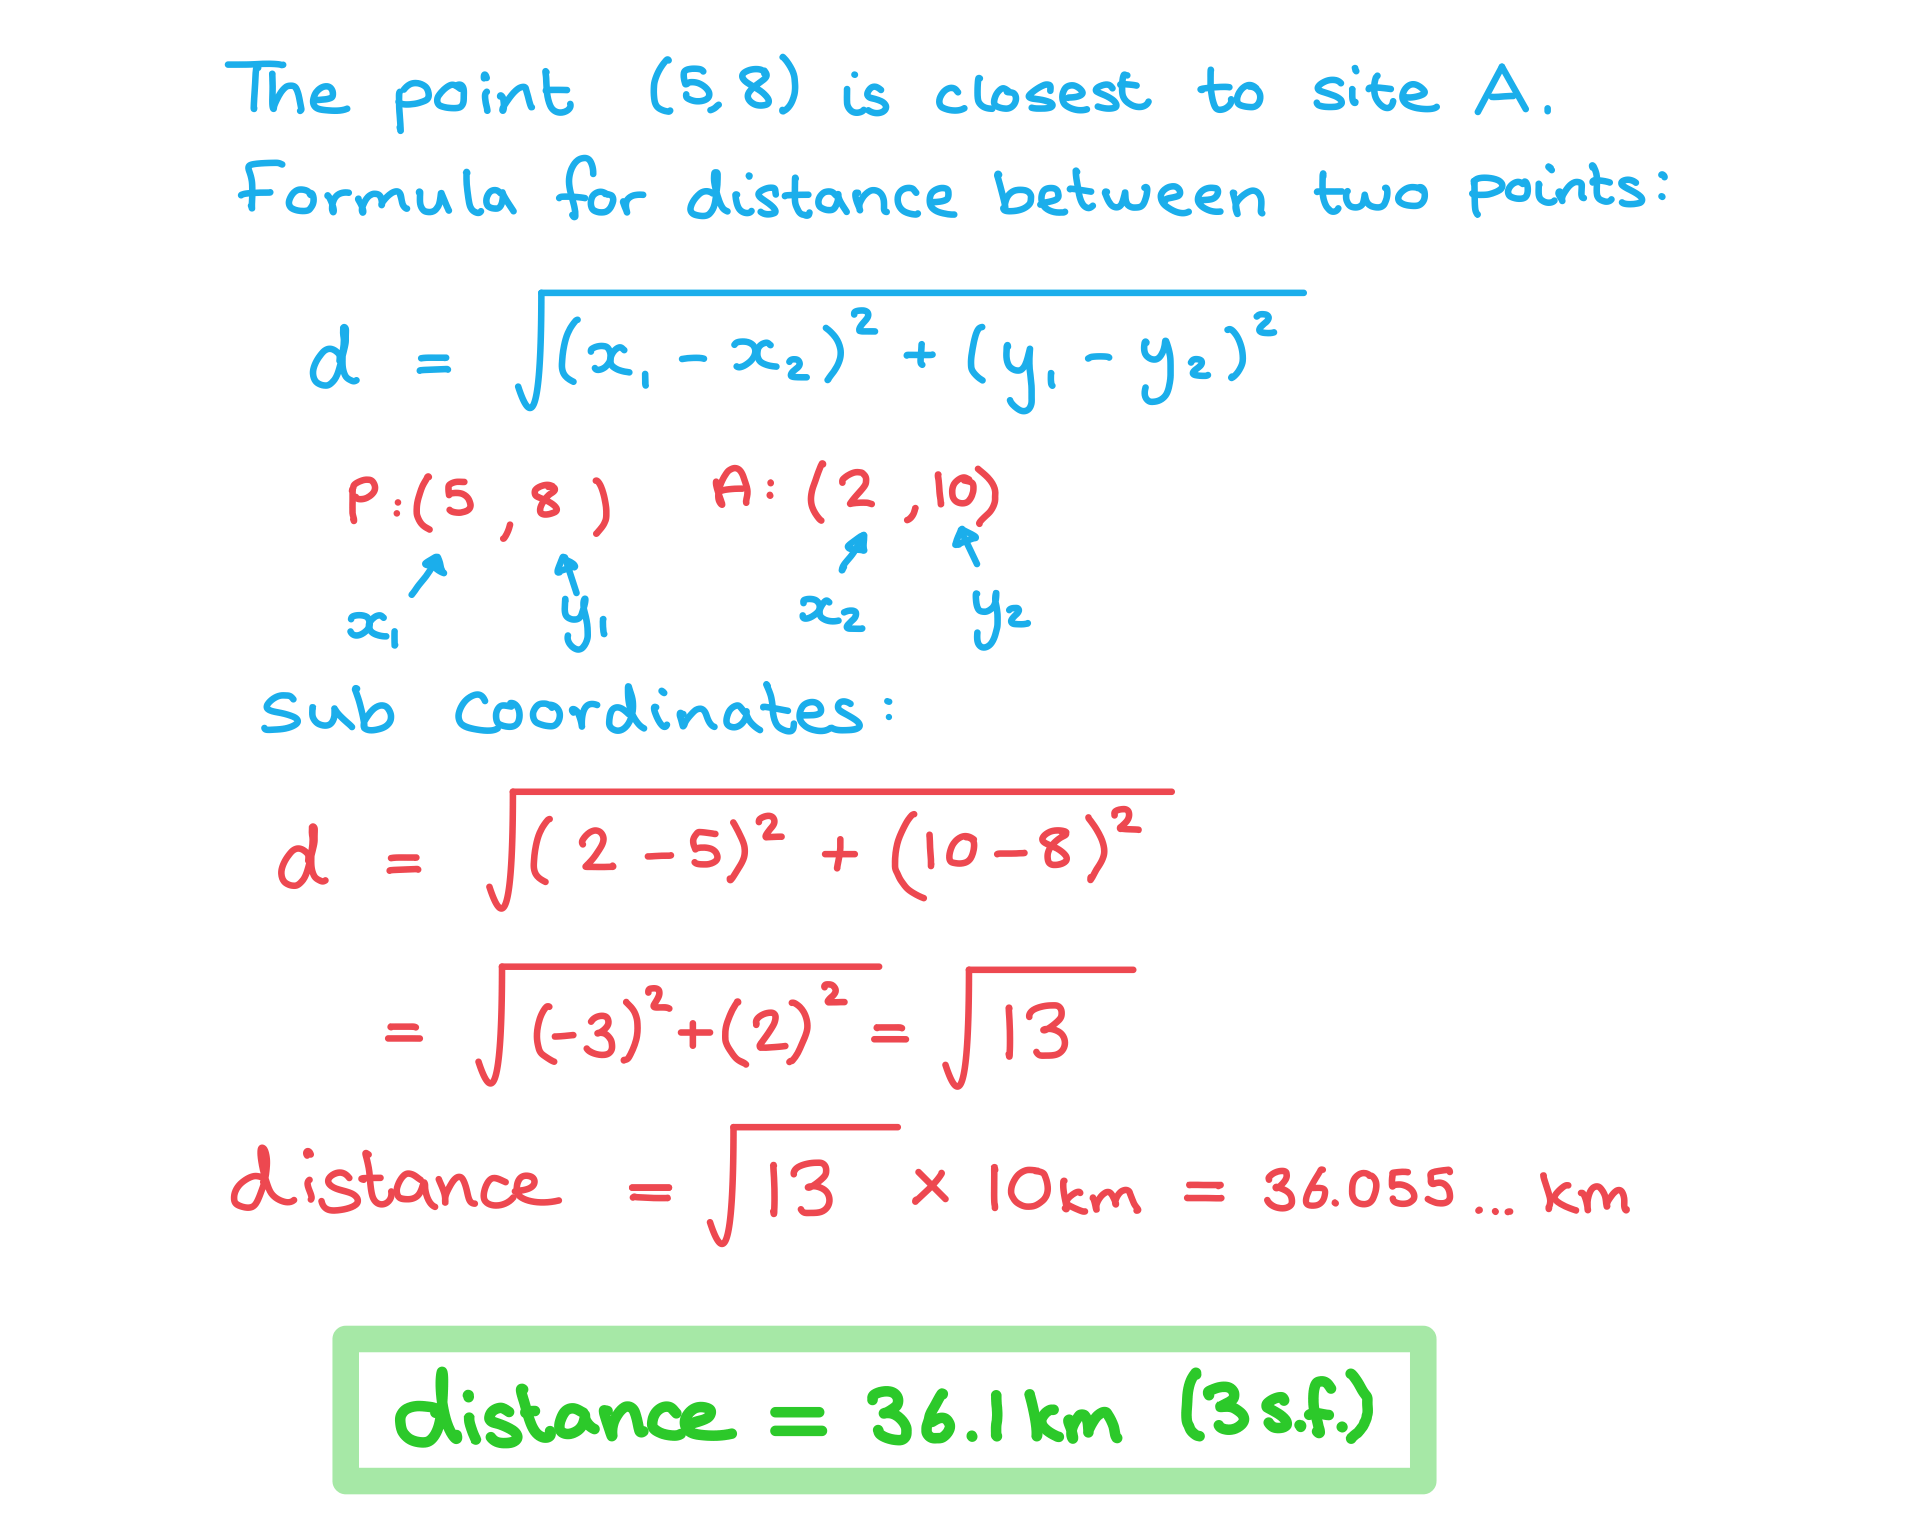
The Voronoi diagram below shows the four sites A, B, C and D with coordinates (2, 10), (14, 14), (14, 4), and (6, 2) respectively. 1 unit represents 10 km.
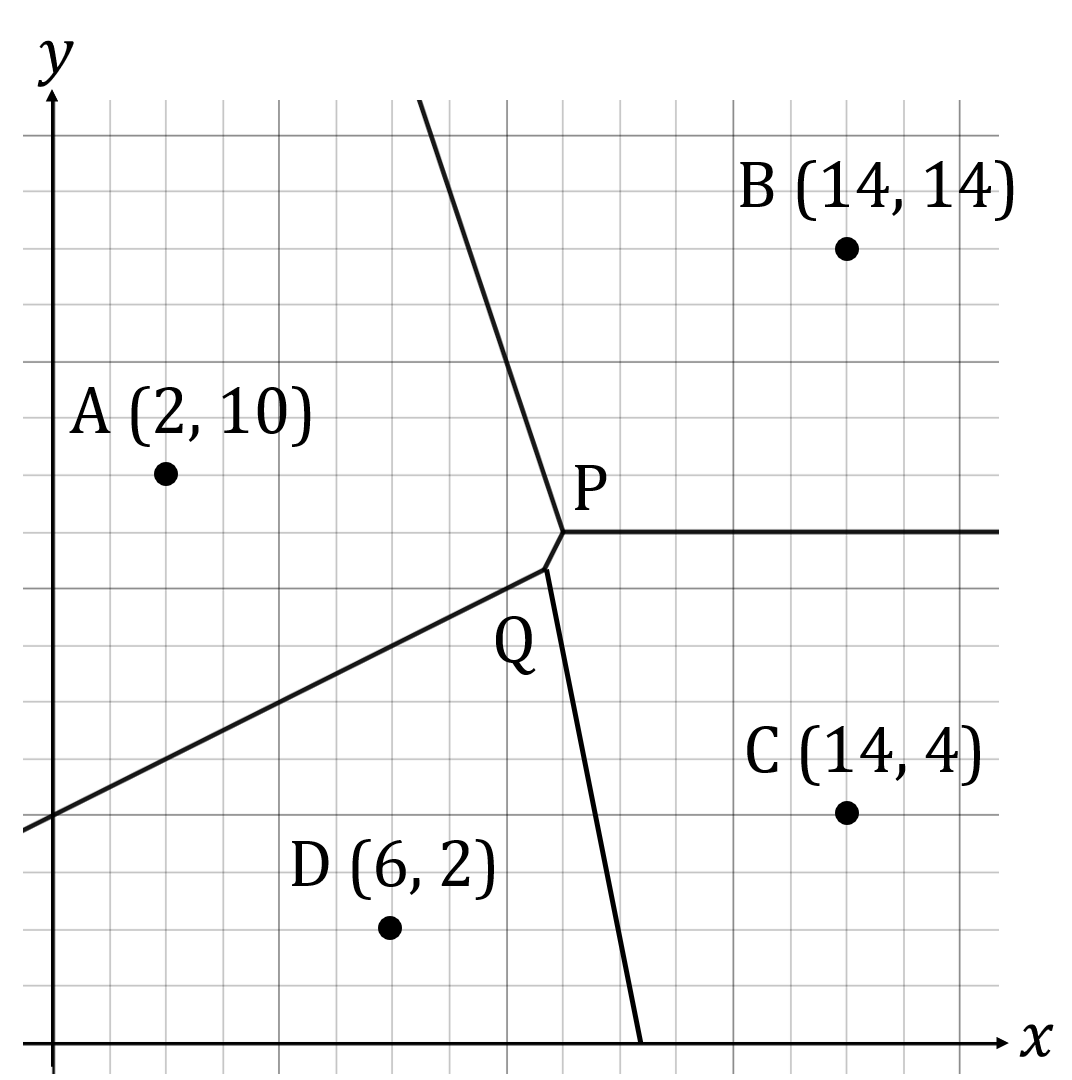
i) State which site a new business opening at the coordinate (5, 8) should look at to predict future sales.
ii) Find the shortest distance from the point (5, 8) to its nearest site.

You've read 0 of your 5 free revision notes this week
Unlock more, it's free!
Did this page help you?