Comparison of Correlation Coefficients (DP IB Applications & Interpretation (AI): SL): Revision Note

Appropriateness & limitations
Which correlation coefficient should I use?
Pearson’s PMCC tests for a linear relationship between two variables
It will not tell you if the variables have a non-linear relationship
Such as exponential growth
Use this if you are interested in a linear relationship
Spearman’s rank tests for a monotonic relationship (always increasing or always decreasing) between two variables
It will not tell you what function can be used to model the relationship
Both linear relationships and exponential relationships can be monotonic
Use this if you think there is a non-linear monotonic relationship
How are Pearson’s and Spearman’s correlation coefficients connected?
If there is linear correlation then the relationship is also monotonic
format('truetype')%3Bfont-weight%3Anormal%3Bfont-style%3Anormal%3B%7D%3C%2Fstyle%3E%3C%2Fdefs%3E%3Ctext%20font-family%3D%22Times%20New%20Roman%22%20font-size%3D%2218%22%20font-style%3D%22italic%22%20text-anchor%3D%22middle%22%20x%3D%223.5%22%20y%3D%2216%22%3Er%3C%2Ftext%3E%3Ctext%20font-family%3D%22math1877ea5b692234ab93be555217a%22%20font-size%3D%2216%22%20text-anchor%3D%22middle%22%20x%3D%2215.5%22%20y%3D%2216%22%3E%3D%3C%2Ftext%3E%3Ctext%20font-family%3D%22Times%20New%20Roman%22%20font-size%3D%2218%22%20text-anchor%3D%22middle%22%20x%3D%2228.5%22%20y%3D%2216%22%3E1%3C%2Ftext%3E%3Ctext%20font-family%3D%22math1877ea5b692234ab93be555217a%22%20font-size%3D%2216%22%20text-anchor%3D%22middle%22%20x%3D%2247.5%22%20y%3D%2216%22%3E%26%23x21D2%3B%3C%2Ftext%3E%3Ctext%20font-family%3D%22Times%20New%20Roman%22%20font-size%3D%2218%22%20font-style%3D%22italic%22%20text-anchor%3D%22middle%22%20x%3D%2264.5%22%20y%3D%2216%22%3Er%3C%2Ftext%3E%3Ctext%20font-family%3D%22Times%20New%20Roman%22%20font-size%3D%2213%22%20font-style%3D%22italic%22%20text-anchor%3D%22middle%22%20x%3D%2270.5%22%20y%3D%2224%22%3Es%3C%2Ftext%3E%3Ctext%20font-family%3D%22math1877ea5b692234ab93be555217a%22%20font-size%3D%2216%22%20text-anchor%3D%22middle%22%20x%3D%2282.5%22%20y%3D%2216%22%3E%3D%3C%2Ftext%3E%3Ctext%20font-family%3D%22Times%20New%20Roman%22%20font-size%3D%2218%22%20text-anchor%3D%22middle%22%20x%3D%2295.5%22%20y%3D%2216%22%3E1%3C%2Ftext%3E%3C%2Fsvg%3E)
format('truetype')%3Bfont-weight%3Anormal%3Bfont-style%3Anormal%3B%7D%3C%2Fstyle%3E%3C%2Fdefs%3E%3Ctext%20font-family%3D%22Times%20New%20Roman%22%20font-size%3D%2218%22%20font-style%3D%22italic%22%20text-anchor%3D%22middle%22%20x%3D%223.5%22%20y%3D%2216%22%3Er%3C%2Ftext%3E%3Ctext%20font-family%3D%22math1424218fbc130afca87f6d51bff%22%20font-size%3D%2216%22%20text-anchor%3D%22middle%22%20x%3D%2215.5%22%20y%3D%2216%22%3E%3D%3C%2Ftext%3E%3Ctext%20font-family%3D%22math1424218fbc130afca87f6d51bff%22%20font-size%3D%2216%22%20text-anchor%3D%22middle%22%20x%3D%2232.5%22%20y%3D%2216%22%3E%26%23x2212%3B%3C%2Ftext%3E%3Ctext%20font-family%3D%22Times%20New%20Roman%22%20font-size%3D%2218%22%20text-anchor%3D%22middle%22%20x%3D%2245.5%22%20y%3D%2216%22%3E1%3C%2Ftext%3E%3Ctext%20font-family%3D%22math1424218fbc130afca87f6d51bff%22%20font-size%3D%2216%22%20text-anchor%3D%22middle%22%20x%3D%2264.5%22%20y%3D%2216%22%3E%26%23x21D2%3B%3C%2Ftext%3E%3Ctext%20font-family%3D%22Times%20New%20Roman%22%20font-size%3D%2218%22%20font-style%3D%22italic%22%20text-anchor%3D%22middle%22%20x%3D%2281.5%22%20y%3D%2216%22%3Er%3C%2Ftext%3E%3Ctext%20font-family%3D%22Times%20New%20Roman%22%20font-size%3D%2213%22%20font-style%3D%22italic%22%20text-anchor%3D%22middle%22%20x%3D%2287.5%22%20y%3D%2224%22%3Es%3C%2Ftext%3E%3Ctext%20font-family%3D%22math1424218fbc130afca87f6d51bff%22%20font-size%3D%2216%22%20text-anchor%3D%22middle%22%20x%3D%2299.5%22%20y%3D%2216%22%3E%3D%3C%2Ftext%3E%3Ctext%20font-family%3D%22math1424218fbc130afca87f6d51bff%22%20font-size%3D%2216%22%20text-anchor%3D%22middle%22%20x%3D%22116.5%22%20y%3D%2216%22%3E%26%23x2212%3B%3C%2Ftext%3E%3Ctext%20font-family%3D%22Times%20New%20Roman%22%20font-size%3D%2218%22%20text-anchor%3D%22middle%22%20x%3D%22129.5%22%20y%3D%2216%22%3E1%3C%2Ftext%3E%3C%2Fsvg%3E)
However the converse is not true
It is possible for Spearman’s rank to be 1 (or -1) but for the PMCC to be different
For example: data that follows an exponential growth model
format('truetype')%3Bfont-weight%3Anormal%3Bfont-style%3Anormal%3B%7D%3C%2Fstyle%3E%3C%2Fdefs%3E%3Ctext%20font-family%3D%22Times%20New%20Roman%22%20font-size%3D%2218%22%20font-style%3D%22italic%22%20text-anchor%3D%22middle%22%20x%3D%223.5%22%20y%3D%2216%22%3Er%3C%2Ftext%3E%3Ctext%20font-family%3D%22Times%20New%20Roman%22%20font-size%3D%2213%22%20font-style%3D%22italic%22%20text-anchor%3D%22middle%22%20x%3D%229.5%22%20y%3D%2224%22%3Es%3C%2Ftext%3E%3Ctext%20font-family%3D%22math17f39f8317fbdb1988ef4c628eb%22%20font-size%3D%2216%22%20text-anchor%3D%22middle%22%20x%3D%2221.5%22%20y%3D%2216%22%3E%3D%3C%2Ftext%3E%3Ctext%20font-family%3D%22Times%20New%20Roman%22%20font-size%3D%2218%22%20text-anchor%3D%22middle%22%20x%3D%2234.5%22%20y%3D%2216%22%3E1%3C%2Ftext%3E%3C%2Fsvg%3E) as the points are always increasing
as the points are always increasingformat('truetype')%3Bfont-weight%3Anormal%3Bfont-style%3Anormal%3B%7D%3C%2Fstyle%3E%3C%2Fdefs%3E%3Ctext%20font-family%3D%22Times%20New%20Roman%22%20font-size%3D%2218%22%20font-style%3D%22italic%22%20text-anchor%3D%22middle%22%20x%3D%223.5%22%20y%3D%2216%22%3Er%3C%2Ftext%3E%3Ctext%20font-family%3D%22math1072b030ba126b2f4b2374f342b%22%20font-size%3D%2216%22%20text-anchor%3D%22middle%22%20x%3D%2215.5%22%20y%3D%2216%22%3E%26lt%3B%3C%2Ftext%3E%3Ctext%20font-family%3D%22Times%20New%20Roman%22%20font-size%3D%2218%22%20text-anchor%3D%22middle%22%20x%3D%2227.5%22%20y%3D%2216%22%3E1%3C%2Ftext%3E%3C%2Fsvg%3E) as the points do not lie on a straight line
as the points do not lie on a straight line
Are Pearson’s and Spearman’s correlation coefficients affected by outliers?
Pearson’s PMCC is affected by outliers
as it uses the numerical value of each data point
Spearman’s rank is not usually affected by outliers
as it only uses the ranks of each data point
Examiner Tips and Tricks
You can use your GDC to plot the scatter diagram to help you visualise the data.
Worked Example
The table below shows the scores of eight students for a maths test and an English test.
Maths | 7 | 18 | 37 | 52 | 61 | 68 | 75 | 82 |
English | 5 | 3 | 9 | 12 | 17 | 41 | 49 | 97 |
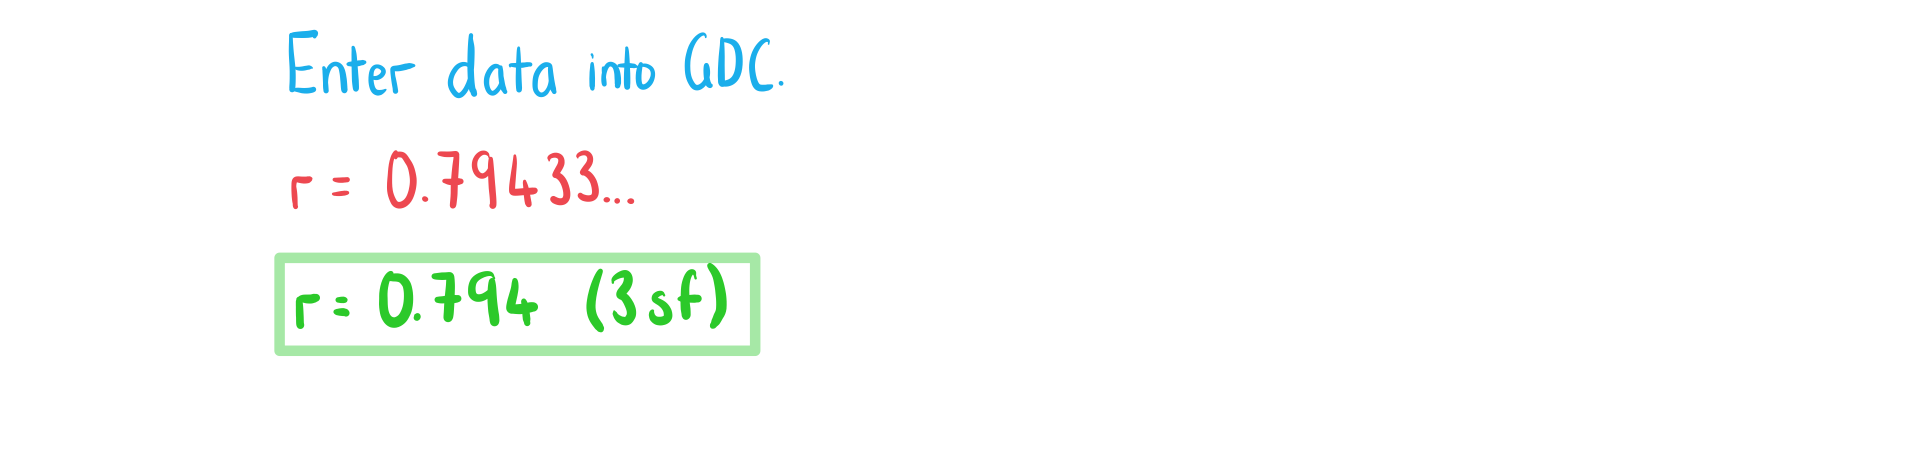
a) Write down the value of Pearson’s product-moment correlation coefficient, ![]() .
.
Answer:
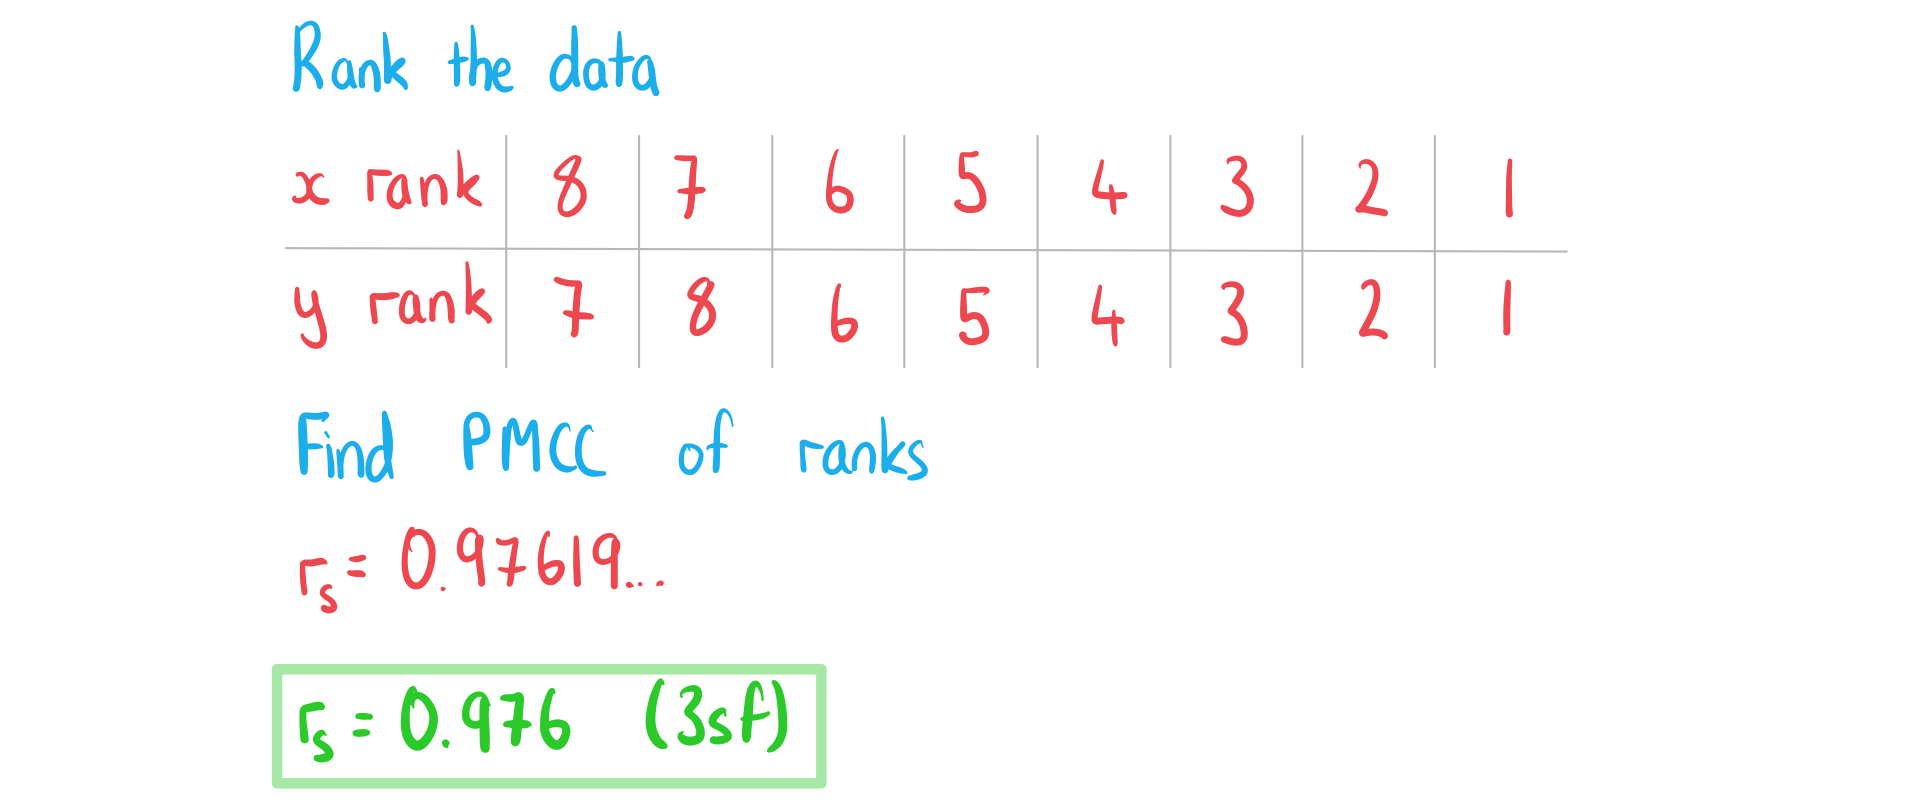
b) Find the value of Spearman’s rank correlation coefficient, ![]() .
.
Answer:
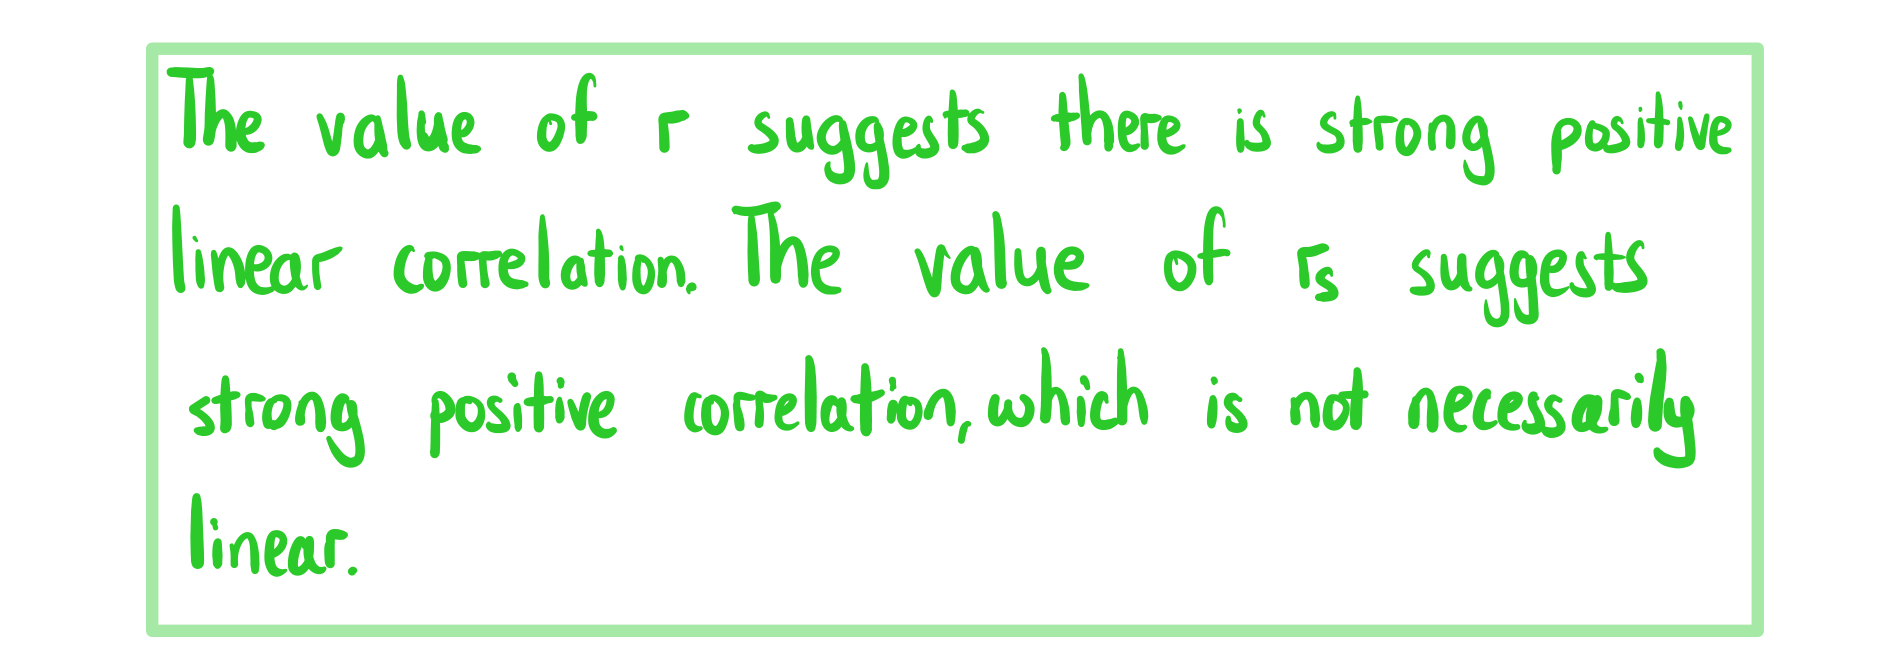
c) Comment on the values of the two correlation coefficients.
Answer:

Unlock more, it's free!
Join the 100,000+ Students that ❤️ Save My Exams
the (exam) results speak for themselves:

Was this revision note helpful?
