Graphs of Trigonometric Functions (DP IB Analysis & Approaches (AA)) : Revision Note

Did this video help you?
Graphs of Trigonometric Functions
What are the graphs of trigonometric functions?
The trigonometric functions sin, cos and tan all have special periodic graphs
You’ll need to know their properties and how to sketch them for a given domain in either degrees or radians
Sketching the trigonometric graphs can help to
Solve trigonometric equations and find all solutions
Understand transformations of trigonometric functions
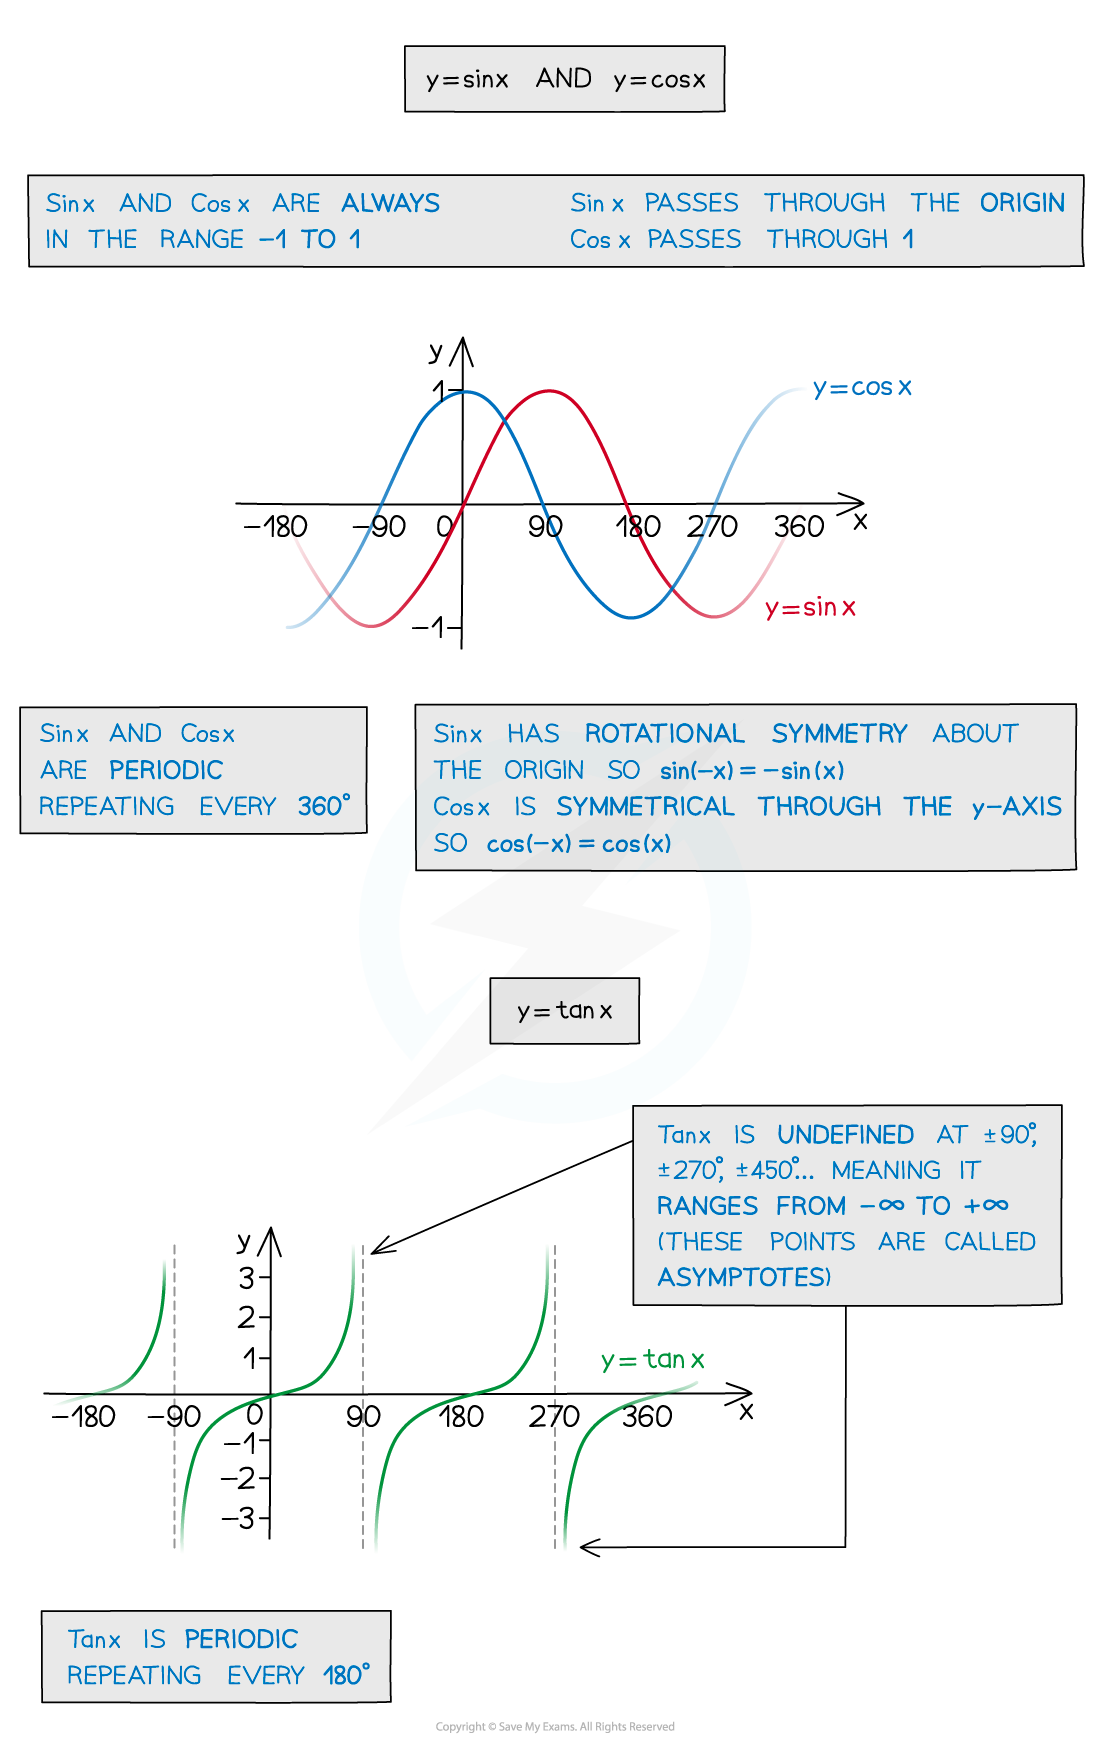
What are the properties of the graphs of sin x and cos x?
The graphs of sin x and cos x are both periodic
They repeat every 360° (2π radians)
The angle will always be on the x-axis
Either in degrees or radians
The graphs of sin x and cos x are always in the range -1 ≤ y ≤ 1
Domain:
format('truetype')%3Bfont-weight%3Anormal%3Bfont-style%3Anormal%3B%7D%3C%2Fstyle%3E%3C%2Fdefs%3E%3Ctext%20font-family%3D%22Times%20New%20Roman%22%20font-size%3D%2218%22%20text-anchor%3D%22middle%22%20x%3D%224.5%22%20y%3D%2216%22%3E%7B%3C%2Ftext%3E%3Ctext%20font-family%3D%22Times%20New%20Roman%22%20font-size%3D%2218%22%20text-anchor%3D%22middle%22%20x%3D%2289.5%22%20y%3D%2216%22%3E%7D%3C%2Ftext%3E%3Ctext%20font-family%3D%22Times%20New%20Roman%22%20font-size%3D%2218%22%20font-style%3D%22italic%22%20font-weight%3D%22bold%22%20text-anchor%3D%22middle%22%20x%3D%2214.5%22%20y%3D%2216%22%3Ex%3C%2Ftext%3E%3Ctext%20font-family%3D%22math110fad8c4e8597264278582a569%22%20font-size%3D%2216%22%20text-anchor%3D%22middle%22%20x%3D%2228.5%22%20y%3D%2216%22%3E%7C%3C%2Ftext%3E%3Ctext%20font-family%3D%22Times%20New%20Roman%22%20font-size%3D%2218%22%20font-style%3D%22italic%22%20font-weight%3D%22bold%22%20text-anchor%3D%22middle%22%20x%3D%2242.5%22%20y%3D%2216%22%3Ex%3C%2Ftext%3E%3Ctext%20font-family%3D%22math110fad8c4e8597264278582a569%22%20font-size%3D%2216%22%20text-anchor%3D%22middle%22%20x%3D%2260.5%22%20y%3D%2216%22%3E%26%23x2208%3B%3C%2Ftext%3E%3Ctext%20font-family%3D%22math110fad8c4e8597264278582a569%22%20font-size%3D%2216%22%20text-anchor%3D%22middle%22%20x%3D%2278.5%22%20y%3D%2216%22%3E%26%23x211D%3B%3C%2Ftext%3E%3C%2Fsvg%3E)
Range:
format('truetype')%3Bfont-weight%3Anormal%3Bfont-style%3Anormal%3B%7D%3C%2Fstyle%3E%3C%2Fdefs%3E%3Ctext%20font-family%3D%22Times%20New%20Roman%22%20font-size%3D%2218%22%20text-anchor%3D%22middle%22%20x%3D%224.5%22%20y%3D%2216%22%3E%7B%3C%2Ftext%3E%3Ctext%20font-family%3D%22Times%20New%20Roman%22%20font-size%3D%2218%22%20text-anchor%3D%22middle%22%20x%3D%22133.5%22%20y%3D%2216%22%3E%7D%3C%2Ftext%3E%3Ctext%20font-family%3D%22Times%20New%20Roman%22%20font-size%3D%2218%22%20font-style%3D%22italic%22%20font-weight%3D%22bold%22%20text-anchor%3D%22middle%22%20x%3D%2214.5%22%20y%3D%2216%22%3Ey%3C%2Ftext%3E%3Ctext%20font-family%3D%22math105870d177921851ce329aaa3b2%22%20font-size%3D%2216%22%20text-anchor%3D%22middle%22%20x%3D%2228.5%22%20y%3D%2216%22%3E%7C%3C%2Ftext%3E%3Ctext%20font-family%3D%22math105870d177921851ce329aaa3b2%22%20font-size%3D%2216%22%20text-anchor%3D%22middle%22%20x%3D%2240.5%22%20y%3D%2216%22%3E%26%23x2212%3B%3C%2Ftext%3E%3Ctext%20font-family%3D%22Times%20New%20Roman%22%20font-size%3D%2218%22%20text-anchor%3D%22middle%22%20x%3D%2253.5%22%20y%3D%2216%22%3E1%3C%2Ftext%3E%3Ctext%20font-family%3D%22math105870d177921851ce329aaa3b2%22%20font-size%3D%2216%22%20text-anchor%3D%22middle%22%20x%3D%2272.5%22%20y%3D%2216%22%3E%26%23x2264%3B%3C%2Ftext%3E%3Ctext%20font-family%3D%22Times%20New%20Roman%22%20font-size%3D%2218%22%20font-style%3D%22italic%22%20font-weight%3D%22bold%22%20text-anchor%3D%22middle%22%20x%3D%2289.5%22%20y%3D%2216%22%3Ey%3C%2Ftext%3E%3Ctext%20font-family%3D%22math105870d177921851ce329aaa3b2%22%20font-size%3D%2216%22%20text-anchor%3D%22middle%22%20x%3D%22108.5%22%20y%3D%2216%22%3E%26%23x2264%3B%3C%2Ftext%3E%3Ctext%20font-family%3D%22Times%20New%20Roman%22%20font-size%3D%2218%22%20text-anchor%3D%22middle%22%20x%3D%22124.5%22%20y%3D%2216%22%3E1%3C%2Ftext%3E%3C%2Fsvg%3E)
The graphs of sin x and cos x are identical however one is a translation of the other
sin x passes through the origin
cos x passes through (0, 1)
The amplitude of the graphs of sin x and cos x is 1
What are the properties of the graph of tan x?
The graph of tan x is periodic
It repeats every 180° (π radians)
The angle will always be on the x-axis
Either in degrees or radians
The graph of tan x is undefined at the points ± 90°, ± 270° etc
There are asymptotes at these points on the graph
In radians this is at the points ±
format('truetype')%3Bfont-weight%3Anormal%3Bfont-style%3Anormal%3B%7D%3C%2Fstyle%3E%3C%2Fdefs%3E%3Cline%20stroke%3D%22%23000%22%20stroke-linecap%3D%22square%22%20stroke-width%3D%221%22%20x1%3D%222.5%22%20x2%3D%2216.5%22%20y1%3D%2218.5%22%20y2%3D%2218.5%22%2F%3E%3Ctext%20font-family%3D%22math1437d7d1d97917cd627a34a6a0f%22%20font-size%3D%2214%22%20text-anchor%3D%22middle%22%20x%3D%229.5%22%20y%3D%2214%22%3E%26%23x3C0%3B%3C%2Ftext%3E%3Ctext%20font-family%3D%22Times%20New%20Roman%22%20font-size%3D%2216%22%20text-anchor%3D%22middle%22%20x%3D%2210.5%22%20y%3D%2235%22%3E2%3C%2Ftext%3E%3C%2Fsvg%3E) , ±
, ± format('truetype')%3Bfont-weight%3Anormal%3Bfont-style%3Anormal%3B%7D%3C%2Fstyle%3E%3C%2Fdefs%3E%3Cline%20stroke%3D%22%23000%22%20stroke-linecap%3D%22square%22%20stroke-width%3D%221%22%20x1%3D%222.5%22%20x2%3D%2224.5%22%20y1%3D%2220.5%22%20y2%3D%2220.5%22%2F%3E%3Ctext%20font-family%3D%22Times%20New%20Roman%22%20font-size%3D%2216%22%20text-anchor%3D%22middle%22%20x%3D%228.5%22%20y%3D%2215%22%3E3%3C%2Ftext%3E%3Ctext%20font-family%3D%22math1437d7d1d97917cd627a34a6a0f%22%20font-size%3D%2214%22%20text-anchor%3D%22middle%22%20x%3D%2217.5%22%20y%3D%2215%22%3E%26%23x3C0%3B%3C%2Ftext%3E%3Ctext%20font-family%3D%22Times%20New%20Roman%22%20font-size%3D%2216%22%20text-anchor%3D%22middle%22%20x%3D%2214.5%22%20y%3D%2237%22%3E2%3C%2Ftext%3E%3C%2Fsvg%3E) etc
etc
The range of the graph of tan x is
Domain:
format('truetype')%3Bfont-weight%3Anormal%3Bfont-style%3Anormal%3B%7D%40font-face%7Bfont-family%3A'brack_sm1837c52e4f2c6bfec104885'%3Bsrc%3Aurl(data%3Afont%2Ftruetype%3Bcharset%3Dutf-8%3Bbase64%2CAAEAAAAMAIAAAwBAT1MvMi7PH4UAAADMAAAATmNtYXA3kjw6AAABHAAAAGxjdnQgAQYDiAAAAYgAAAASZ2x5ZkyYQ7YAAAGcAAACQmhlYWQLyR8fAAAD4AAAADZoaGVhAq0XCAAABBgAAAAkaG10eDEjA%2FUAAAQ8AAAAJGxvY2EAAEKZAAAEYAAAAChtYXhwBJsEcQAABIgAAAAgbmFtZW7QvZAAAASoAAAB5XBvc3QArQBVAAAGkAAAACBwcmVwu5WEAAAABrAAAAAHAAACDAGQAAUAAAQABAAAAAAABAAEAAAAAAAAAQEAAAAAAAAAAAAAAAAAAAAAAAAAAAAAAAAAAAAAACAgICAAAAAg9AMD%2FP%2F8AAABVAABAAAAAAACAAEAAQAAABQAAwABAAAAFAAEAFgAAAASABAAAwACI6cjqCOpI6ojqyOsI60jrv%2F%2FAAAjpyOoI6kjqiOrI6wjrSOu%2F%2F%2FcWtxa3FrcWtxa3FrcWtxaAAEAAAAAAAAAAAAAAAAAAAAAAAAAAAFUAFQBAAArAIwAgACoAAcAAAACAAAAAADVAQEAAwAHAAAxMxEjFyM1M9XVq4CAAQHWqwABAAAAAAEAAVUABwAjGAGxAAA%2FsQcC%2FbEDB%2FywBDwAsQAAP7AHPLEDAfaxBAT9MTAxNDY3FQ4BFWuVa0BrwCoqK8BAAAH%2FgAAAAFUBVAAJACEYAbEFAD%2BwATyxBgL9sAA8ALEFAD%2BwBjyxAQE%2FsAA8MTATIxQHFhUzNCc2VVWAgFWAgAFUVVRWVVVWVAABAAAAAAEAAVQABwAjGAGxAAA%2FsQcC%2FbEDB%2FywBDwAsQABP7AHPLEDAfaxBAT9MTARFBYXNS4BNWuVa0ABVGrAKispwEAAAQAAAAAAVQFUAAMAIBgBsAQQsAA8sAM8sQEC9bACPACwAy%2BwAjyxAAH1sAE8ETMRI1VVAVT%2BrAABAAAAAAEAAVQABwAlGAGwCS%2BwADyxAQL9sQUH%2FLAEPACxAAA%2FsAE8sQUB9rEEBP0xMCEjNCYnNR4BAQBVQGuVaz%2FAKyoqwQABAKsAAAGAAVQACQAiGAGwCy%2BxBgA8PLEFAv2wATwAsQUAP7AGPLEBAT%2BwADwxMAEjFBcGFTM0NyYBAFWAgFWAgAFUVFVWVVVWVQABAAAAAAEAAVQABwAlGAGwCS%2BwADyxAQL9sQUH%2FLAEPACxAAE%2FsAE8sQUB9rEEBP0xMAEjFAYHFT4BAQBVQWqVawFUVKsqKyvAAAEAqwAAAQABVAADACAYAbAFL7ABPLACPLEAAvWwAzwAsAMvsAI8sQAB9bABPBMzESOrVVUBVP6sAAAAAQAAAAEAAIsesexfDzz1AAMEAP%2F%2F%2F%2F%2FVre5k%2F%2F%2F%2F%2F9Wt7mT%2FgP%2F%2FAdYBWAAAAAoAAgABAAAAAAABAAABVP%2F%2FAAAXcP%2BA%2F4AB1gABAAAAAAAAAAAAAAAAAAAACQDVAAABAAAAAQD%2FgAEAAAABAAAAAQAAAAEAAKsBAAAAAQAAqwAAAAAAAAAhAAAAZQAAAK4AAAD0AAABLAAAAXQAAAG%2FAAACCQAAAkIAAQAAAAkACgACAAAAAAACAIAEAAAAAAAEAABlAAAAAAAAABUBAgAAAAAAAAABACYAAAAAAAAAAAACAA4AJgAAAAAAAAADAEQANAAAAAAAAAAEACYAeAAAAAAAAAAFABYAngAAAAAAAAAGABMAtAAAAAAAAAAIABwAxwABAAAAAAABACYAAAABAAAAAAACAA4AJgABAAAAAAADAEQANAABAAAAAAAEACYAeAABAAAAAAAFABYAngABAAAAAAAGABMAtAABAAAAAAAIABwAxwADAAEECQABACYAAAADAAEECQACAA4AJgADAAEECQADAEQANAADAAEECQAEACYAeAADAAEECQAFABYAngADAAEECQAGABMAtAADAAEECQAIABwAxwBCAHIAYQBjAGsAZQB0AHMAIABzAG0AYQBsAGwAIABzAGkAegBlAFIAZQBnAHUAbABhAHIATQBhAHQAaABzACAARgBvAHIAIABNAG8AcgBlACAAQgByAGEAYwBrAGUAdABzACAAcwBtAGEAbABsACAAcwBpAHoAZQBCAHIAYQBjAGsAZQB0AHMAIABzAG0AYQBsAGwAIABzAGkAegBlAFYAZQByAHMAaQBvAG4AIAAyAC4AMEJyYWNrZXRzX3NtYWxsX3NpemUATQBhAHQAaABzACAARgBvAHIAIABNAG8AcgBlAAAAAAMAAAAAAAAAqgBVAAAAAAAAAAAAAAAAAAAAAAAAAAC5B%2F8AAo2FAA%3D%3D)format('truetype')%3Bfont-weight%3Anormal%3Bfont-style%3Anormal%3B%7D%3C%2Fstyle%3E%3C%2Fdefs%3E%3Ctext%20font-family%3D%22brack_sm1837c52e4f2c6bfec104885%22%20font-size%3D%2218%22%20text-anchor%3D%22start%22%20x%3D%223.5%22%20y%3D%227%22%3E%26%23x23A7%3B%3C%2Ftext%3E%3Ctext%20font-family%3D%22brack_sm1837c52e4f2c6bfec104885%22%20font-size%3D%2218%22%20text-anchor%3D%22start%22%20x%3D%223.5%22%20y%3D%2213%22%3E%26%23x23AA%3B%3C%2Ftext%3E%3Ctext%20font-family%3D%22brack_sm1837c52e4f2c6bfec104885%22%20font-size%3D%2218%22%20text-anchor%3D%22start%22%20x%3D%223.5%22%20y%3D%2219%22%3E%26%23x23AA%3B%3C%2Ftext%3E%3Ctext%20font-family%3D%22brack_sm1837c52e4f2c6bfec104885%22%20font-size%3D%2218%22%20text-anchor%3D%22start%22%20x%3D%223.5%22%20y%3D%2225%22%3E%26%23x23A8%3B%3C%2Ftext%3E%3Ctext%20font-family%3D%22brack_sm1837c52e4f2c6bfec104885%22%20font-size%3D%2218%22%20text-anchor%3D%22start%22%20x%3D%223.5%22%20y%3D%2231%22%3E%26%23x23AA%3B%3C%2Ftext%3E%3Ctext%20font-family%3D%22brack_sm1837c52e4f2c6bfec104885%22%20font-size%3D%2218%22%20text-anchor%3D%22start%22%20x%3D%223.5%22%20y%3D%2237%22%3E%26%23x23AA%3B%3C%2Ftext%3E%3Ctext%20font-family%3D%22brack_sm1837c52e4f2c6bfec104885%22%20font-size%3D%2218%22%20text-anchor%3D%22start%22%20x%3D%223.5%22%20y%3D%2243%22%3E%26%23x23A9%3B%3C%2Ftext%3E%3Ctext%20font-family%3D%22brack_sm1837c52e4f2c6bfec104885%22%20font-size%3D%2218%22%20text-anchor%3D%22start%22%20x%3D%22195.5%22%20y%3D%227%22%3E%26%23x23AB%3B%3C%2Ftext%3E%3Ctext%20font-family%3D%22brack_sm1837c52e4f2c6bfec104885%22%20font-size%3D%2218%22%20text-anchor%3D%22start%22%20x%3D%22195.5%22%20y%3D%2213%22%3E%26%23x23AE%3B%3C%2Ftext%3E%3Ctext%20font-family%3D%22brack_sm1837c52e4f2c6bfec104885%22%20font-size%3D%2218%22%20text-anchor%3D%22start%22%20x%3D%22195.5%22%20y%3D%2219%22%3E%26%23x23AE%3B%3C%2Ftext%3E%3Ctext%20font-family%3D%22brack_sm1837c52e4f2c6bfec104885%22%20font-size%3D%2218%22%20text-anchor%3D%22start%22%20x%3D%22195.5%22%20y%3D%2225%22%3E%26%23x23AC%3B%3C%2Ftext%3E%3Ctext%20font-family%3D%22brack_sm1837c52e4f2c6bfec104885%22%20font-size%3D%2218%22%20text-anchor%3D%22start%22%20x%3D%22195.5%22%20y%3D%2231%22%3E%26%23x23AE%3B%3C%2Ftext%3E%3Ctext%20font-family%3D%22brack_sm1837c52e4f2c6bfec104885%22%20font-size%3D%2218%22%20text-anchor%3D%22start%22%20x%3D%22195.5%22%20y%3D%2237%22%3E%26%23x23AE%3B%3C%2Ftext%3E%3Ctext%20font-family%3D%22brack_sm1837c52e4f2c6bfec104885%22%20font-size%3D%2218%22%20text-anchor%3D%22start%22%20x%3D%22195.5%22%20y%3D%2243%22%3E%26%23x23AD%3B%3C%2Ftext%3E%3Ctext%20font-family%3D%22Times%20New%20Roman%22%20font-size%3D%2218%22%20font-style%3D%22italic%22%20font-weight%3D%22bold%22%20text-anchor%3D%22middle%22%20x%3D%2214.5%22%20y%3D%2227%22%3Ex%3C%2Ftext%3E%3Ctext%20font-family%3D%22math12eb8730e7a9c2a19e14e19f87f%22%20font-size%3D%2216%22%20text-anchor%3D%22middle%22%20x%3D%2228.5%22%20y%3D%2227%22%3E%7C%3C%2Ftext%3E%3Ctext%20font-family%3D%22Times%20New%20Roman%22%20font-size%3D%2218%22%20font-style%3D%22italic%22%20font-weight%3D%22bold%22%20text-anchor%3D%22middle%22%20x%3D%2242.5%22%20y%3D%2227%22%3Ex%3C%2Ftext%3E%3Ctext%20font-family%3D%22math12eb8730e7a9c2a19e14e19f87f%22%20font-size%3D%2216%22%20text-anchor%3D%22middle%22%20x%3D%2261.5%22%20y%3D%2227%22%3E%26%23x2260%3B%3C%2Ftext%3E%3Cline%20stroke%3D%22%23000%22%20stroke-linecap%3D%22square%22%20stroke-width%3D%221%22%20x1%3D%2272.5%22%20x2%3D%2289.5%22%20y1%3D%2220.5%22%20y2%3D%2220.5%22%2F%3E%3Ctext%20font-family%3D%22math12eb8730e7a9c2a19e14e19f87f%22%20font-size%3D%2216%22%20font-style%3D%22italic%22%20font-weight%3D%22bold%22%20text-anchor%3D%22middle%22%20x%3D%2280.5%22%20y%3D%2216%22%3E%26%23x3C0%3B%3C%2Ftext%3E%3Ctext%20font-family%3D%22Times%20New%20Roman%22%20font-size%3D%2218%22%20text-anchor%3D%22middle%22%20x%3D%2281.5%22%20y%3D%2238%22%3E2%3C%2Ftext%3E%3Ctext%20font-family%3D%22math12eb8730e7a9c2a19e14e19f87f%22%20font-size%3D%2216%22%20text-anchor%3D%22middle%22%20x%3D%22100.5%22%20y%3D%2227%22%3E%2B%3C%2Ftext%3E%3Ctext%20font-family%3D%22Times%20New%20Roman%22%20font-size%3D%2218%22%20font-style%3D%22italic%22%20font-weight%3D%22bold%22%20text-anchor%3D%22middle%22%20x%3D%22114.5%22%20y%3D%2227%22%3Ek%3C%2Ftext%3E%3Ctext%20font-family%3D%22math12eb8730e7a9c2a19e14e19f87f%22%20font-size%3D%2216%22%20font-style%3D%22italic%22%20font-weight%3D%22bold%22%20text-anchor%3D%22middle%22%20x%3D%22125.5%22%20y%3D%2227%22%3E%26%23x3C0%3B%3C%2Ftext%3E%3Ctext%20font-family%3D%22math12eb8730e7a9c2a19e14e19f87f%22%20font-size%3D%2216%22%20text-anchor%3D%22middle%22%20x%3D%22135.5%22%20y%3D%2227%22%3E%2C%3C%2Ftext%3E%3Ctext%20font-family%3D%22Times%20New%20Roman%22%20font-size%3D%2218%22%20font-style%3D%22italic%22%20font-weight%3D%22bold%22%20text-anchor%3D%22middle%22%20x%3D%22153.5%22%20y%3D%2227%22%3Ek%3C%2Ftext%3E%3Ctext%20font-family%3D%22math12eb8730e7a9c2a19e14e19f87f%22%20font-size%3D%2216%22%20text-anchor%3D%22middle%22%20x%3D%22171.5%22%20y%3D%2227%22%3E%26%23x2208%3B%3C%2Ftext%3E%3Ctext%20font-family%3D%22math12eb8730e7a9c2a19e14e19f87f%22%20font-size%3D%2216%22%20text-anchor%3D%22middle%22%20x%3D%22188.5%22%20y%3D%2227%22%3E%26%23x2124%3B%3C%2Ftext%3E%3C%2Fsvg%3E)
Range:
format('truetype')%3Bfont-weight%3Anormal%3Bfont-style%3Anormal%3B%7D%3C%2Fstyle%3E%3C%2Fdefs%3E%3Ctext%20font-family%3D%22Times%20New%20Roman%22%20font-size%3D%2218%22%20text-anchor%3D%22middle%22%20x%3D%224.5%22%20y%3D%2216%22%3E%7B%3C%2Ftext%3E%3Ctext%20font-family%3D%22Times%20New%20Roman%22%20font-size%3D%2218%22%20text-anchor%3D%22middle%22%20x%3D%2289.5%22%20y%3D%2216%22%3E%7D%3C%2Ftext%3E%3Ctext%20font-family%3D%22Times%20New%20Roman%22%20font-size%3D%2218%22%20font-style%3D%22italic%22%20font-weight%3D%22bold%22%20text-anchor%3D%22middle%22%20x%3D%2214.5%22%20y%3D%2216%22%3Ey%3C%2Ftext%3E%3Ctext%20font-family%3D%22math110fad8c4e8597264278582a569%22%20font-size%3D%2216%22%20text-anchor%3D%22middle%22%20x%3D%2228.5%22%20y%3D%2216%22%3E%7C%3C%2Ftext%3E%3Ctext%20font-family%3D%22Times%20New%20Roman%22%20font-size%3D%2218%22%20font-style%3D%22italic%22%20font-weight%3D%22bold%22%20text-anchor%3D%22middle%22%20x%3D%2242.5%22%20y%3D%2216%22%3Ey%3C%2Ftext%3E%3Ctext%20font-family%3D%22math110fad8c4e8597264278582a569%22%20font-size%3D%2216%22%20text-anchor%3D%22middle%22%20x%3D%2260.5%22%20y%3D%2216%22%3E%26%23x2208%3B%3C%2Ftext%3E%3Ctext%20font-family%3D%22math110fad8c4e8597264278582a569%22%20font-size%3D%2216%22%20text-anchor%3D%22middle%22%20x%3D%2278.5%22%20y%3D%2216%22%3E%26%23x211D%3B%3C%2Ftext%3E%3C%2Fsvg%3E)
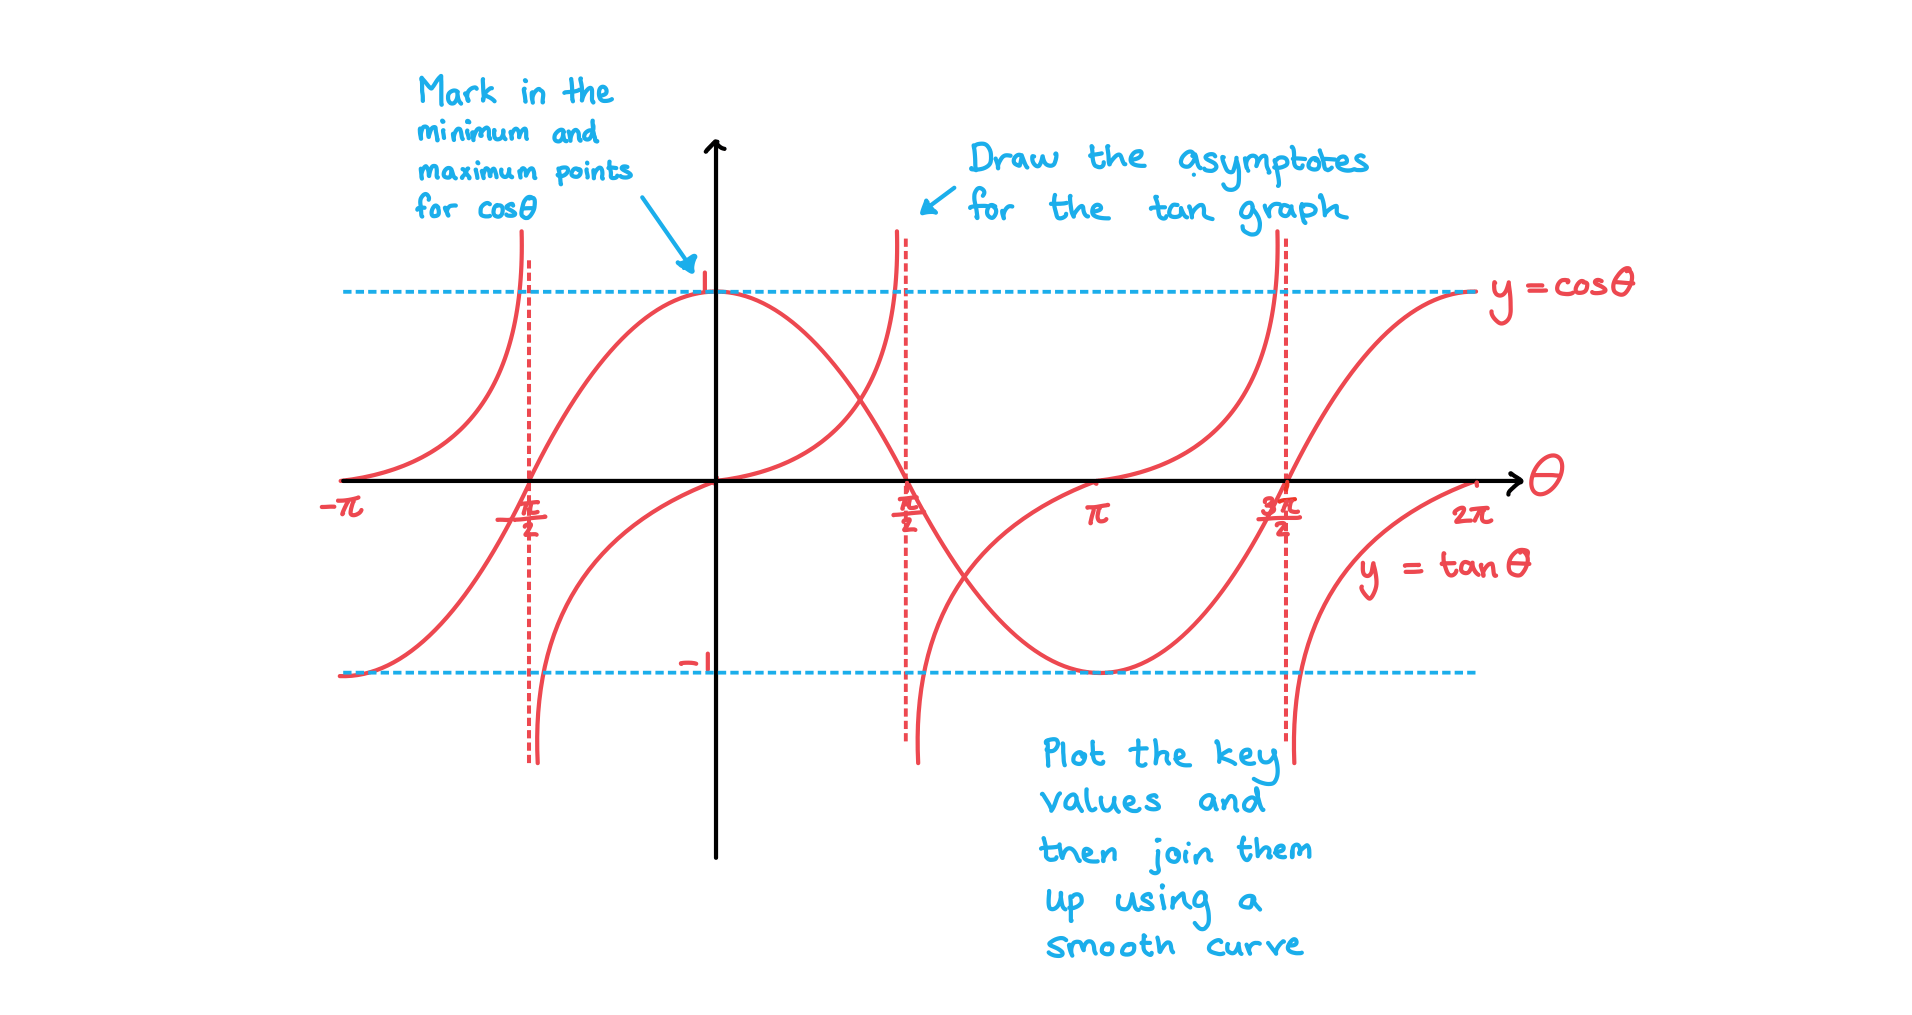
How do I sketch trigonometric graphs?
You may need to sketch a trigonometric graph so you will need to remember the key features of each one
The following steps may help you sketch a trigonometric graph
STEP 1: Check whether you should be working in degrees or radians
You should check the domain given for this
If you see π in the given domain then you should work in radians
STEP 2: Label the x-axis in multiples of 90°
This will be multiples of
if you are working in radiansMake sure you cover the whole domain on the x-axis
STEP 3: Label the y-axis
The range for the y-axis will be – 1 ≤ y ≤ 1 for sin or cos
For tan you will not need any specific points on the y-axis
STEP 4: Draw the graph
Knowing exact values will help with this, such as remembering that sin(0) = 0 and
cos(0) = 1Mark the important points on the axis first
If you are drawing the graph of tan x put the asymptotes in first
If you are drawing sin x or cos x mark in where the maximum and minimum points will be
Try to keep the symmetry and rotational symmetry as you sketch, as this will help when using the graph to find solutions
Examiner Tips and Tricks
Sketch all three trig graphs on your exam paper so you can refer to them as many times as you need to!
Worked Example
Sketch the graphs of y = cosθ and y = tanθ on the same set of axes in the interval -π ≤ θ ≤ 2π. Clearly mark the key features of both graphs.
Did this video help you?
Using Trigonometric Graphs
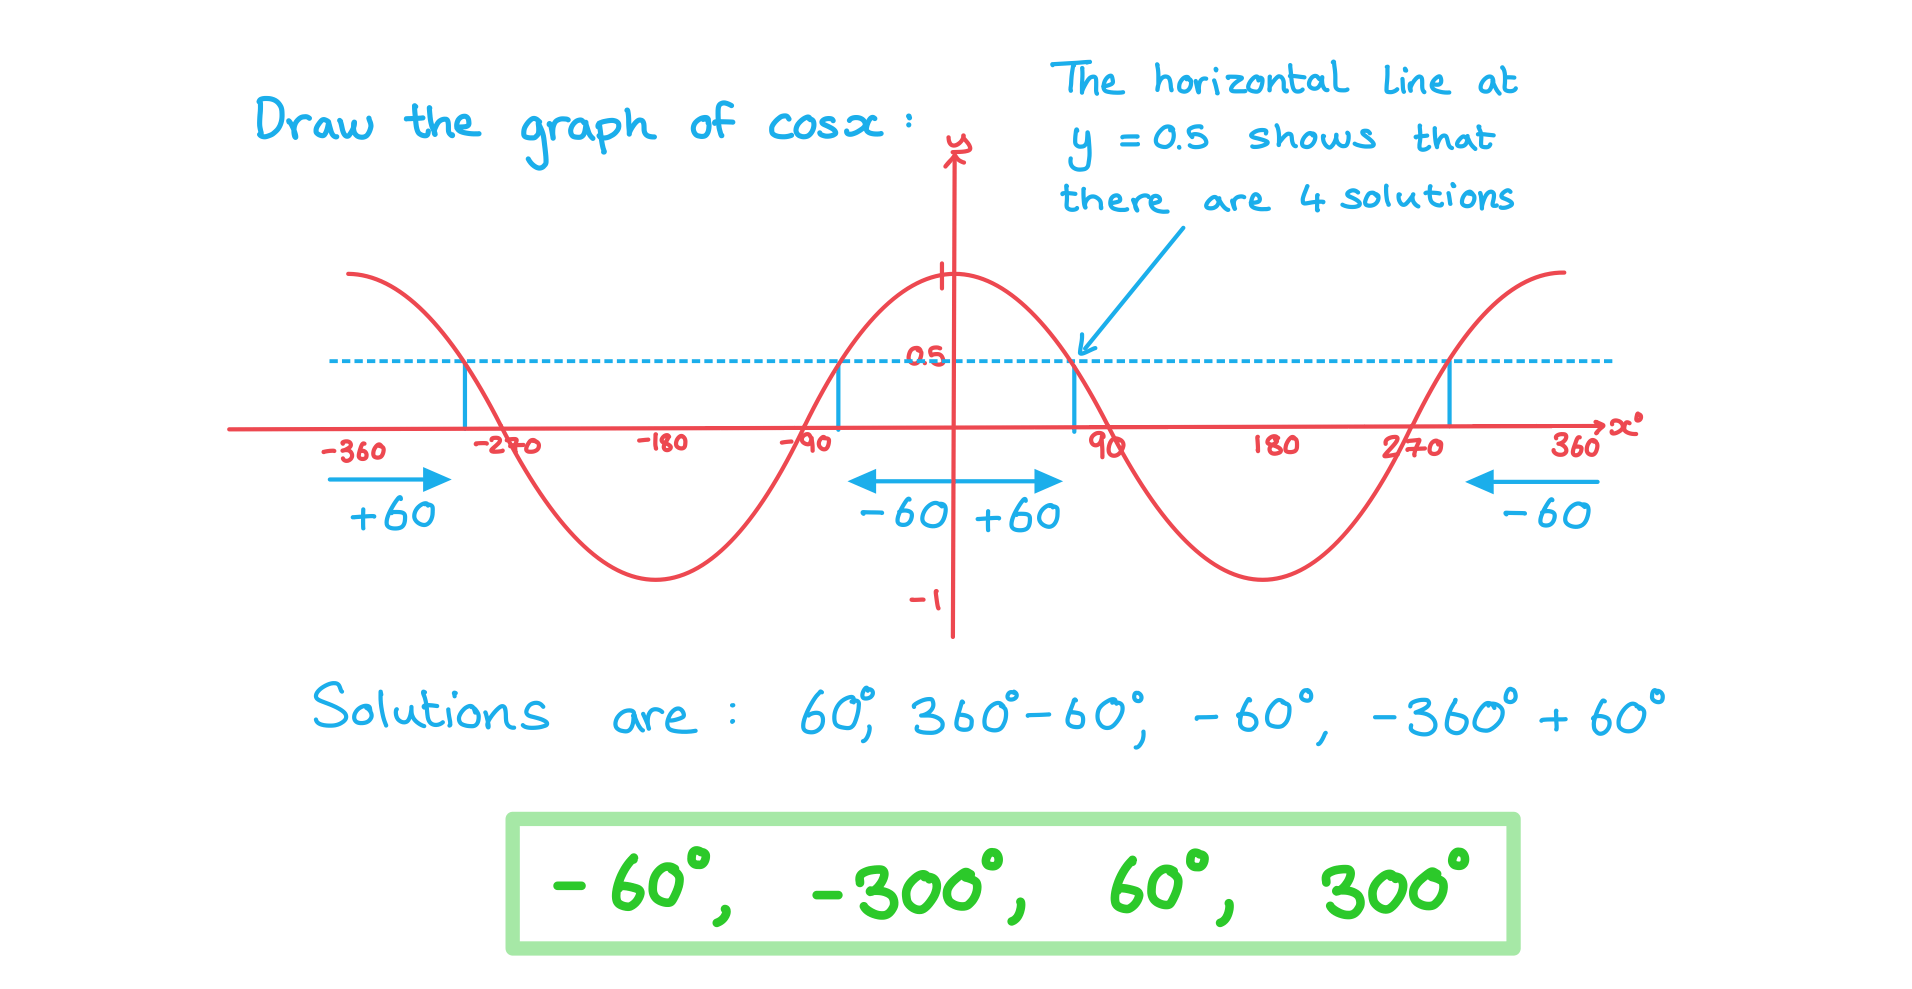
How can I use a trigonometric graph to find extra solutions?
Your calculator will only give you the first solution to a problem such as sin-1(0.5)
This solution is called the primary value
However, due to the periodic nature of the trig functions there could be an infinite number of solutions
Further solutions are called the secondary values
This is why you will be given a domain (interval) in which your solutions should be found
This could either be in degrees or in radians
If you see π or some multiple of π then you must work in radians
The following steps will help you use the trigonometric graphs to find secondary values
STEP 1: Sketch the graph for the given function and interval
Check whether you should be working in degrees or radians and label the axes with the key values
STEP 2: Draw a horizontal line going through the y-axis at the point you are trying to find the values for
For example if you are looking for the solutions to sin-1(-0.5) then draw the horizontal line going through the y-axis at -0.5
The number of times this line cuts the graph is the number of solutions within the given interval
STEP 3: Find the primary value and mark it on the graph
This will either be an exact value and you should know it
Or you will be able to use your calculator to find it
STEP 4: Use the symmetry of the graph to find all the solutions in the interval by adding or subtracting from the key values on the graph
What patterns can be seen from the graphs of trigonometric functions?
The graph of sin x has rotational symmetry about the origin
So sin(-x) = - sin(x)
sin(x) = sin(180° - x) or sin(π – x)
The graph of cos x has reflectional symmetry about the y-axis
So cos(-x) = cos(x)
cos(x) = cos(360° – x) or cos(2π – x)
The graph of tan x repeats every 180° (π radians)
So tan(x) = tan(x ± 180°) or tan(x ± π )
The graphs of sin x and cos x repeat every 360° (2π radians)
So sin(x) = sin(x ± 360°) or sin(x ± 2π)
cos(x) = cos(x ± 360°) or cos(x ± 2π)
Examiner Tips and Tricks
Take care to always check what the interval for the angle is that the question is focused on
Worked Example
One solution to cos x = 0.5 is 60°. Find all the other solutions in the range -360° ≤ x ≤ 360°.

You've read 0 of your 5 free revision notes this week
Unlock more, it's free!
Did this page help you?