1a 1 mark
The graph below shows the curve with equation ![]() in the interval
in the interval ![]() .
.
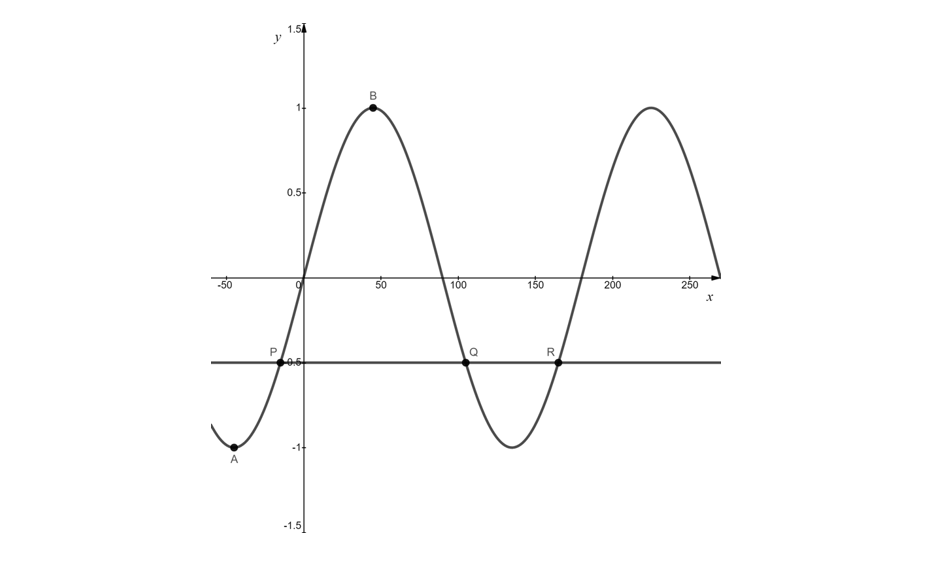
Point A has coordinates ![]() and is the minimum point closest to the origin. Point B is the maximum point closest to the origin. State the coordinates of B.
and is the minimum point closest to the origin. Point B is the maximum point closest to the origin. State the coordinates of B.
1b2 marks
A straight line with equation ![]() meets the graph of
meets the graph of ![]() at the three points P, Q and R, as shown in the diagram.
at the three points P, Q and R, as shown in the diagram.
Given that point P has coordinates ![]() , use graph symmetries to determine the coordinates of Q and R.
, use graph symmetries to determine the coordinates of Q and R.
Did this page help you?


