Probability Density Function (DP IB Analysis & Approaches (AA): HL): Revision Note

Calculating probabilities using PDF
A continuous random variable can take any value in an interval so is typically used when continuous quantities are involved (time, distance, weight, etc)
What is a probability density function (p.d.f.)?
For a continuous random variable, a function can be used to model probabilities
This function is called a probability density function (p.d.f.), denoted by f(x)
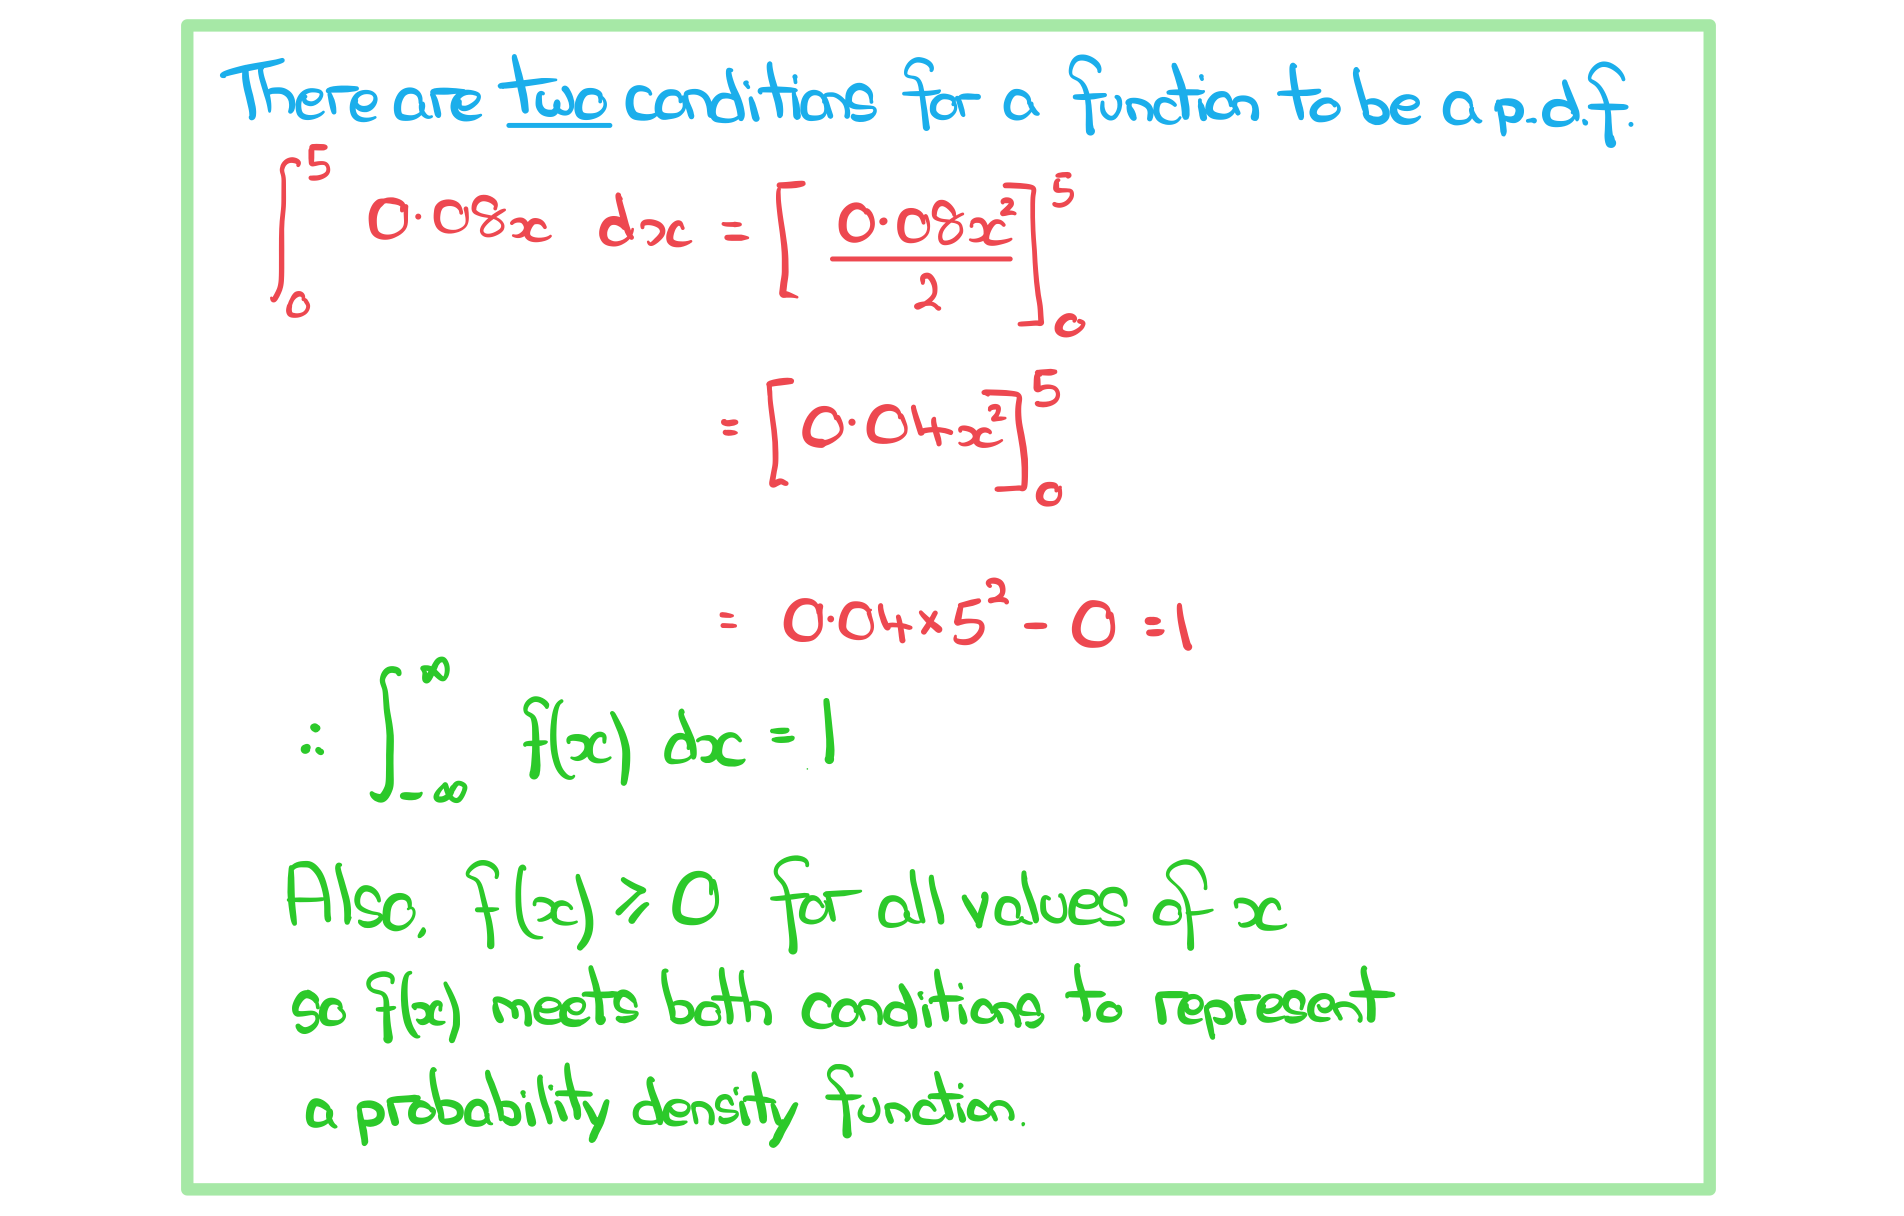
For f(x) to represent a p.d.f. the following conditions must apply:
f(x) ≥ 0 for all values of x
The area under the graph of y = f(x) must total 1
In most problems, the domain of f(x) is restricted to an interval, a ≤ x ≤ b say, with all values of x outside of the interval having f(x)=0
How do I find probabilities using a probability density function (p.d.f.)?
The probability that the continuous random variable X lies in the interval a ≤ X ≤ b, where X has the probability density function f(x), is given by
![]()
For any continuous random variable (including the normal distribution), the following are true:
%3C%2Fmo%3E%3C%2Fmath%3E--%3E%3Cdefs%3E%3Cstyle%20type%3D%22text%2Fcss%22%3E%40font-face%7Bfont-family%3A'math11daff391a550f9600c8318be97'%3Bsrc%3Aurl(data%3Afont%2Ftruetype%3Bcharset%3Dutf-8%3Bbase64%2CAAEAAAAMAIAAAwBAT1MvMi7iBBMAAADMAAAATmNtYXDEvmKUAAABHAAAAERjdnQgDVUNBwAAAWAAAAA6Z2x5ZoPi2VsAAAGcAAABv2hlYWQQC2qxAAADXAAAADZoaGVhCGsXSAAAA5QAAAAkaG10eE2rRkcAAAO4AAAAEGxvY2EAHTwYAAADyAAAABRtYXhwBT0FPgAAA9wAAAAgbmFtZaBxlY4AAAP8AAABn3Bvc3QB9wD6AAAFnAAAACBwcmVwa1uragAABbwAAAAUAAADSwGQAAUAAAQABAAAAAAABAAEAAAAAAAAAQEAAAAAAAAAAAAAAAAAAAAAAAAAAAAAAAAAAAAAACAgICAAAAAg1UADev96AAAD6ACWAAAAAAACAAEAAQAAABQAAwABAAAAFAAEADAAAAAIAAgAAgAAADwAPSJk%2F%2F8AAAA8AD0iZP%2F%2F%2F8X%2Fxd2fAAEAAAAAAAAAAAAAAVQDLACAAQAAVgAqAlgCHgEOASwCLABaAYACgACgANQAgAAAAAAAAAArAFUAgACrANUBAAErAAcAAAACAFUAAAMAA6sAAwAHAAAzESERJSERIVUCq%2F2rAgD%2BAAOr%2FFVVAwAAAgCAAFUCgAKrAAUACwBsGLBBGgCxAAATELEABuSxAAETELAJPLEBBfWwCjywABCxBQP1sQIF7bEEA%2FWxAwXtsAoQsQsD9bEIBe2xBgP1sQcF7QGwDBCxAQP2sgkACjw8PLEFBPWyAggLPDw8sQQE9bIGBwM8PDyxDQPmEwcFFzUnATUNARc3gQEBAP%2F%2FAQD%2FAP8AAf8Bq1aAgFaAASpWgIBWgAACAIAA6wLVAhUAAwAHAGUYAbAIELAG1LAGELAF1LAIELAB1LABELAA1LAGELAHPLAFELAEPLABELACPLAAELADPACwCBCwBtSwBhCwB9SwBxCwAdSwARCwAtSwBhCwBTywBxCwBDywARCwADywAhCwAzwxMBMhNSEdASE1gAJV%2FasCVQHAVdVVVQADAID%2FqwKAAqsAAwAHAAsALxgBALEJAD%2BxCAXksQIF9LEBBPSxBgX0sQME5LEFBPSxBAX0sQcBEDyxAAYQPDAxEwcBNRM1ARcBNSEVgQEB%2FwH%2BAAEB%2F%2F4AAatW%2FwBWAapW%2FwBW%2FlZVVQAAAQAAAAEAANV4zkFfDzz1AAMEAP%2F%2F%2F%2F%2FWOhNz%2F%2F%2F%2F%2F9Y6E3MAAP8gBIADqwAAAAoAAgABAAAAAAABAAAD6P9qAAAXcAAA%2F7YEgAABAAAAAAAAAAAAAAAAAAAABANSAFUDAACAA1YAgAMAAIAAAAAAAAAAKAAAAMwAAAFWAAABvwABAAAABABeAAUAAAAAAAIAgAQAAAAAAAQAAN4AAAAAAAAAFQECAAAAAAAAAAEAEgAAAAAAAAAAAAIADgASAAAAAAAAAAMAMAAgAAAAAAAAAAQAEgBQAAAAAAAAAAUAFgBiAAAAAAAAAAYACQB4AAAAAAAAAAgAHACBAAEAAAAAAAEAEgAAAAEAAAAAAAIADgASAAEAAAAAAAMAMAAgAAEAAAAAAAQAEgBQAAEAAAAAAAUAFgBiAAEAAAAAAAYACQB4AAEAAAAAAAgAHACBAAMAAQQJAAEAEgAAAAMAAQQJAAIADgASAAMAAQQJAAMAMAAgAAMAAQQJAAQAEgBQAAMAAQQJAAUAFgBiAAMAAQQJAAYACQB4AAMAAQQJAAgAHACBAE0AYQB0AGgAIABGAG8AbgB0AFIAZQBnAHUAbABhAHIATQBhAHQAaABzACAARgBvAHIAIABNAG8AcgBlACAATQBhAHQAaAAgAEYAbwBuAHQATQBhAHQAaAAgAEYAbwBuAHQAVgBlAHIAcwBpAG8AbgAgADEALgAwTWF0aF9Gb250AE0AYQB0AGgAcwAgAEYAbwByACAATQBvAHIAZQAAAwAAAAAAAAH0APoAAAAAAAAAAAAAAAAAAAAAAAAAALkHEQAAjYUYALIAAAAVFBOxAAE%2F)format('truetype')%3Bfont-weight%3Anormal%3Bfont-style%3Anormal%3B%7D%40font-face%7Bfont-family%3A'round_brackets18549f92a457f2409'%3Bsrc%3Aurl(data%3Afont%2Ftruetype%3Bcharset%3Dutf-8%3Bbase64%2CAAEAAAAMAIAAAwBAT1MvMjwHLFQAAADMAAAATmNtYXDf7xCrAAABHAAAADxjdnQgBAkDLgAAAVgAAAASZ2x5ZmAOz2cAAAFsAAABJGhlYWQOKih8AAACkAAAADZoaGVhCvgVwgAAAsgAAAAkaG10eCA6AAIAAALsAAAADGxvY2EAAARLAAAC%2BAAAABBtYXhwBIgEWQAAAwgAAAAgbmFtZXHR30MAAAMoAAACOXBvc3QDogHPAAAFZAAAACBwcmVwupWEAAAABYQAAAAHAAAGcgGQAAUAAAgACAAAAAAACAAIAAAAAAAAAQIAAAAAAAAAAAAAAAAAAAAAAAAAAAAAAAAAAAAAACAgICAAAAAo8AMGe%2F57AAAHPgGyAAAAAAACAAEAAQAAABQAAwABAAAAFAAEACgAAAAGAAQAAQACACgAKf%2F%2FAAAAKAAp%2F%2F%2F%2F2f%2FZAAEAAAAAAAAAAAFUAFYBAAAsAKgDgAAyAAcAAAACAAAAKgDVA1UAAwAHAAA1MxEjEyMRM9XVq4CAKgMr%2FQAC1QABAAD%2B0AIgBtAACQBNGAGwChCwA9SwAxCwAtSwChCwBdSwBRCwANSwAxCwBzywAhCwCDwAsAoQsAPUsAMQsAfUsAoQsAXUsAoQsADUsAMQsAI8sAcQsAg8MTAREAEzABEQASMAAZCQ%2FnABkJD%2BcALQ%2FZD%2BcAGQAnACcAGQ%2FnAAAQAA%2FtACIAbQAAkATRgBsAoQsAPUsAMQsALUsAoQsAXUsAUQsADUsAMQsAc8sAIQsAg8ALAKELAD1LADELAH1LAKELAF1LAKELAA1LADELACPLAHELAIPDEwARABIwAREAEzAAIg%2FnCQAZD%2BcJABkALQ%2FZD%2BcAGQAnACcAGQ%2FnAAAQAAAAEAAPW2NYFfDzz1AAMIAP%2F%2F%2F%2F%2FVre7u%2F%2F%2F%2F%2F9Wt7u4AAP7QA7cG0AAAAAoAAgABAAAAAAABAAAHPv5OAAAXcAAA%2F%2F4DtwABAAAAAAAAAAAAAAAAAAAAAwDVAAACIAAAAiAAAAAAAAAAAAAkAAAAowAAASQAAQAAAAMACgACAAAAAAACAIAEAAAAAAAEAABNAAAAAAAAABUBAgAAAAAAAAABAD4AAAAAAAAAAAACAA4APgAAAAAAAAADAFwATAAAAAAAAAAEAD4AqAAAAAAAAAAFABYA5gAAAAAAAAAGAB8A%2FAAAAAAAAAAIABwBGwABAAAAAAABAD4AAAABAAAAAAACAA4APgABAAAAAAADAFwATAABAAAAAAAEAD4AqAABAAAAAAAFABYA5gABAAAAAAAGAB8A%2FAABAAAAAAAIABwBGwADAAEECQABAD4AAAADAAEECQACAA4APgADAAEECQADAFwATAADAAEECQAEAD4AqAADAAEECQAFABYA5gADAAEECQAGAB8A%2FAADAAEECQAIABwBGwBSAG8AdQBuAGQAIABiAHIAYQBjAGsAZQB0AHMAIAB3AGkAdABoACAAYQBzAGMAZQBuAHQAIAAxADgANQA0AFIAZQBnAHUAbABhAHIATQBhAHQAaABzACAARgBvAHIAIABNAG8AcgBlACAAUgBvAHUAbgBkACAAYgByAGEAYwBrAGUAdABzACAAdwBpAHQAaAAgAGEAcwBjAGUAbgB0ACAAMQA4ADUANABSAG8AdQBuAGQAIABiAHIAYQBjAGsAZQB0AHMAIAB3AGkAdABoACAAYQBzAGMAZQBuAHQAIAAxADgANQA0AFYAZQByAHMAaQBvAG4AIAAyAC4AMFJvdW5kX2JyYWNrZXRzX3dpdGhfYXNjZW50XzE4NTQATQBhAHQAaABzACAARgBvAHIAIABNAG8AcgBlAAAAAAMAAAAAAAADnwHPAAAAAAAAAAAAAAAAAAAAAAAAAAC5B%2F8AAY2FAA%3D%3D)format('truetype')%3Bfont-weight%3Anormal%3Bfont-style%3Anormal%3B%7D%3C%2Fstyle%3E%3C%2Fdefs%3E%3Ctext%20font-family%3D%22Times%20New%20Roman%22%20font-size%3D%2218%22%20text-anchor%3D%22middle%22%20x%3D%225.5%22%20y%3D%2216%22%3EP%3C%2Ftext%3E%3Ctext%20font-family%3D%22round_brackets18549f92a457f2409%22%20font-size%3D%2218%22%20text-anchor%3D%22middle%22%20x%3D%2213.5%22%20y%3D%2216%22%3E(%3C%2Ftext%3E%3Ctext%20font-family%3D%22round_brackets18549f92a457f2409%22%20font-size%3D%2218%22%20text-anchor%3D%22middle%22%20x%3D%2283.5%22%20y%3D%2216%22%3E)%3C%2Ftext%3E%3Ctext%20font-family%3D%22Times%20New%20Roman%22%20font-size%3D%2218%22%20font-style%3D%22italic%22%20text-anchor%3D%22middle%22%20x%3D%2220.5%22%20y%3D%2216%22%3Ea%3C%2Ftext%3E%3Ctext%20font-family%3D%22math11daff391a550f9600c8318be97%22%20font-size%3D%2216%22%20text-anchor%3D%22middle%22%20x%3D%2233.5%22%20y%3D%2216%22%3E%26%23x2264%3B%3C%2Ftext%3E%3Ctext%20font-family%3D%22Times%20New%20Roman%22%20font-size%3D%2218%22%20font-style%3D%22italic%22%20text-anchor%3D%22middle%22%20x%3D%2247.5%22%20y%3D%2216%22%3EX%3C%2Ftext%3E%3Ctext%20font-family%3D%22math11daff391a550f9600c8318be97%22%20font-size%3D%2216%22%20text-anchor%3D%22middle%22%20x%3D%2263.5%22%20y%3D%2216%22%3E%26%23x2264%3B%3C%2Ftext%3E%3Ctext%20font-family%3D%22Times%20New%20Roman%22%20font-size%3D%2218%22%20font-style%3D%22italic%22%20text-anchor%3D%22middle%22%20x%3D%2275.5%22%20y%3D%2216%22%3Eb%3C%2Ftext%3E%3Ctext%20font-family%3D%22math11daff391a550f9600c8318be97%22%20font-size%3D%2216%22%20text-anchor%3D%22middle%22%20x%3D%2295.5%22%20y%3D%2216%22%3E%3D%3C%2Ftext%3E%3Ctext%20font-family%3D%22Times%20New%20Roman%22%20font-size%3D%2218%22%20text-anchor%3D%22middle%22%20x%3D%22109.5%22%20y%3D%2216%22%3EP%3C%2Ftext%3E%3Ctext%20font-family%3D%22round_brackets18549f92a457f2409%22%20font-size%3D%2218%22%20text-anchor%3D%22middle%22%20x%3D%22117.5%22%20y%3D%2216%22%3E(%3C%2Ftext%3E%3Ctext%20font-family%3D%22Times%20New%20Roman%22%20font-size%3D%2218%22%20font-style%3D%22italic%22%20text-anchor%3D%22middle%22%20x%3D%22124.5%22%20y%3D%2216%22%3Ea%3C%2Ftext%3E%3Ctext%20font-family%3D%22math11daff391a550f9600c8318be97%22%20font-size%3D%2216%22%20text-anchor%3D%22middle%22%20x%3D%22137.5%22%20y%3D%2216%22%3E%26lt%3B%3C%2Ftext%3E%3Ctext%20font-family%3D%22Times%20New%20Roman%22%20font-size%3D%2218%22%20font-style%3D%22italic%22%20text-anchor%3D%22middle%22%20x%3D%22151.5%22%20y%3D%2216%22%3EX%3C%2Ftext%3E%3Ctext%20font-family%3D%22math11daff391a550f9600c8318be97%22%20font-size%3D%2216%22%20text-anchor%3D%22middle%22%20x%3D%22167.5%22%20y%3D%2216%22%3E%26lt%3B%3C%2Ftext%3E%3Ctext%20font-family%3D%22Times%20New%20Roman%22%20font-size%3D%2218%22%20font-style%3D%22italic%22%20text-anchor%3D%22middle%22%20x%3D%22179.5%22%20y%3D%2216%22%3Eb%3C%2Ftext%3E%3Ctext%20font-family%3D%22round_brackets18549f92a457f2409%22%20font-size%3D%2218%22%20text-anchor%3D%22middle%22%20x%3D%22187.5%22%20y%3D%2216%22%3E)%3C%2Ftext%3E%3C%2Fsvg%3E)
I.e.
format('truetype')%3Bfont-weight%3Anormal%3Bfont-style%3Anormal%3B%7D%3C%2Fstyle%3E%3C%2Fdefs%3E%3Ctext%20font-family%3D%22math1a36adbc35e69b22acbf9f834a0%22%20font-size%3D%2216%22%20text-anchor%3D%22middle%22%20x%3D%228.5%22%20y%3D%2216%22%3E%26%23x2264%3B%3C%2Ftext%3E%3C%2Fsvg%3E) and
and format('truetype')%3Bfont-weight%3Anormal%3Bfont-style%3Anormal%3B%7D%3C%2Fstyle%3E%3C%2Fdefs%3E%3Ctext%20font-family%3D%22math1072b030ba126b2f4b2374f342b%22%20font-size%3D%2216%22%20text-anchor%3D%22middle%22%20x%3D%228.5%22%20y%3D%2216%22%3E%26lt%3B%3C%2Ftext%3E%3C%2Fsvg%3E) are interchangeable
are interchangeable
%3C%2Fmo%3E%3Cmo%3E%3D%3C%2Fmo%3E%3Cmn%3E0%3C%2Fmn%3E%3C%2Fmath%3E--%3E%3Cdefs%3E%3Cstyle%20type%3D%22text%2Fcss%22%3E%40font-face%7Bfont-family%3A'math17f39f8317fbdb1988ef4c628eb'%3Bsrc%3Aurl(data%3Afont%2Ftruetype%3Bcharset%3Dutf-8%3Bbase64%2CAAEAAAAMAIAAAwBAT1MvMi7iBBMAAADMAAAATmNtYXDEvmKUAAABHAAAADRjdnQgDVUNBwAAAVAAAAA6Z2x5ZoPi2VsAAAGMAAAAsmhlYWQQC2qxAAACQAAAADZoaGVhCGsXSAAAAngAAAAkaG10eE2rRkcAAAKcAAAACGxvY2EAHTwYAAACpAAAAAxtYXhwBT0FPgAAArAAAAAgbmFtZaBxlY4AAALQAAABn3Bvc3QB9wD6AAAEcAAAACBwcmVwa1uragAABJAAAAAUAAADSwGQAAUAAAQABAAAAAAABAAEAAAAAAAAAQEAAAAAAAAAAAAAAAAAAAAAAAAAAAAAAAAAAAAAACAgICAAAAAg1UADev96AAAD6ACWAAAAAAACAAEAAQAAABQAAwABAAAAFAAEACAAAAAEAAQAAQAAAD3%2F%2FwAAAD3%2F%2F%2F%2FEAAEAAAAAAAABVAMsAIABAABWACoCWAIeAQ4BLAIsAFoBgAKAAKAA1ACAAAAAAAAAACsAVQCAAKsA1QEAASsABwAAAAIAVQAAAwADqwADAAcAADMRIRElIREhVQKr%2FasCAP4AA6v8VVUDAAACAIAA6wLVAhUAAwAHAGUYAbAIELAG1LAGELAF1LAIELAB1LABELAA1LAGELAHPLAFELAEPLABELACPLAAELADPACwCBCwBtSwBhCwB9SwBxCwAdSwARCwAtSwBhCwBTywBxCwBDywARCwADywAhCwAzwxMBMhNSEdASE1gAJV%2FasCVQHAVdVVVQAAAAEAAAABAADVeM5BXw889QADBAD%2F%2F%2F%2F%2F1joTc%2F%2F%2F%2F%2F%2FWOhNzAAD%2FIASAA6sAAAAKAAIAAQAAAAAAAQAAA%2Bj%2FagAAF3AAAP%2B2BIAAAQAAAAAAAAAAAAAAAAAAAAIDUgBVA1YAgAAAAAAAAAAoAAAAsgABAAAAAgBeAAUAAAAAAAIAgAQAAAAAAAQAAN4AAAAAAAAAFQECAAAAAAAAAAEAEgAAAAAAAAAAAAIADgASAAAAAAAAAAMAMAAgAAAAAAAAAAQAEgBQAAAAAAAAAAUAFgBiAAAAAAAAAAYACQB4AAAAAAAAAAgAHACBAAEAAAAAAAEAEgAAAAEAAAAAAAIADgASAAEAAAAAAAMAMAAgAAEAAAAAAAQAEgBQAAEAAAAAAAUAFgBiAAEAAAAAAAYACQB4AAEAAAAAAAgAHACBAAMAAQQJAAEAEgAAAAMAAQQJAAIADgASAAMAAQQJAAMAMAAgAAMAAQQJAAQAEgBQAAMAAQQJAAUAFgBiAAMAAQQJAAYACQB4AAMAAQQJAAgAHACBAE0AYQB0AGgAIABGAG8AbgB0AFIAZQBnAHUAbABhAHIATQBhAHQAaABzACAARgBvAHIAIABNAG8AcgBlACAATQBhAHQAaAAgAEYAbwBuAHQATQBhAHQAaAAgAEYAbwBuAHQAVgBlAHIAcwBpAG8AbgAgADEALgAwTWF0aF9Gb250AE0AYQB0AGgAcwAgAEYAbwByACAATQBvAHIAZQAAAwAAAAAAAAH0APoAAAAAAAAAAAAAAAAAAAAAAAAAALkHEQAAjYUYALIAAAAVFBOxAAE%2F)format('truetype')%3Bfont-weight%3Anormal%3Bfont-style%3Anormal%3B%7D%40font-face%7Bfont-family%3A'round_brackets18549f92a457f2409'%3Bsrc%3Aurl(data%3Afont%2Ftruetype%3Bcharset%3Dutf-8%3Bbase64%2CAAEAAAAMAIAAAwBAT1MvMjwHLFQAAADMAAAATmNtYXDf7xCrAAABHAAAADxjdnQgBAkDLgAAAVgAAAASZ2x5ZmAOz2cAAAFsAAABJGhlYWQOKih8AAACkAAAADZoaGVhCvgVwgAAAsgAAAAkaG10eCA6AAIAAALsAAAADGxvY2EAAARLAAAC%2BAAAABBtYXhwBIgEWQAAAwgAAAAgbmFtZXHR30MAAAMoAAACOXBvc3QDogHPAAAFZAAAACBwcmVwupWEAAAABYQAAAAHAAAGcgGQAAUAAAgACAAAAAAACAAIAAAAAAAAAQIAAAAAAAAAAAAAAAAAAAAAAAAAAAAAAAAAAAAAACAgICAAAAAo8AMGe%2F57AAAHPgGyAAAAAAACAAEAAQAAABQAAwABAAAAFAAEACgAAAAGAAQAAQACACgAKf%2F%2FAAAAKAAp%2F%2F%2F%2F2f%2FZAAEAAAAAAAAAAAFUAFYBAAAsAKgDgAAyAAcAAAACAAAAKgDVA1UAAwAHAAA1MxEjEyMRM9XVq4CAKgMr%2FQAC1QABAAD%2B0AIgBtAACQBNGAGwChCwA9SwAxCwAtSwChCwBdSwBRCwANSwAxCwBzywAhCwCDwAsAoQsAPUsAMQsAfUsAoQsAXUsAoQsADUsAMQsAI8sAcQsAg8MTAREAEzABEQASMAAZCQ%2FnABkJD%2BcALQ%2FZD%2BcAGQAnACcAGQ%2FnAAAQAA%2FtACIAbQAAkATRgBsAoQsAPUsAMQsALUsAoQsAXUsAUQsADUsAMQsAc8sAIQsAg8ALAKELAD1LADELAH1LAKELAF1LAKELAA1LADELACPLAHELAIPDEwARABIwAREAEzAAIg%2FnCQAZD%2BcJABkALQ%2FZD%2BcAGQAnACcAGQ%2FnAAAQAAAAEAAPW2NYFfDzz1AAMIAP%2F%2F%2F%2F%2FVre7u%2F%2F%2F%2F%2F9Wt7u4AAP7QA7cG0AAAAAoAAgABAAAAAAABAAAHPv5OAAAXcAAA%2F%2F4DtwABAAAAAAAAAAAAAAAAAAAAAwDVAAACIAAAAiAAAAAAAAAAAAAkAAAAowAAASQAAQAAAAMACgACAAAAAAACAIAEAAAAAAAEAABNAAAAAAAAABUBAgAAAAAAAAABAD4AAAAAAAAAAAACAA4APgAAAAAAAAADAFwATAAAAAAAAAAEAD4AqAAAAAAAAAAFABYA5gAAAAAAAAAGAB8A%2FAAAAAAAAAAIABwBGwABAAAAAAABAD4AAAABAAAAAAACAA4APgABAAAAAAADAFwATAABAAAAAAAEAD4AqAABAAAAAAAFABYA5gABAAAAAAAGAB8A%2FAABAAAAAAAIABwBGwADAAEECQABAD4AAAADAAEECQACAA4APgADAAEECQADAFwATAADAAEECQAEAD4AqAADAAEECQAFABYA5gADAAEECQAGAB8A%2FAADAAEECQAIABwBGwBSAG8AdQBuAGQAIABiAHIAYQBjAGsAZQB0AHMAIAB3AGkAdABoACAAYQBzAGMAZQBuAHQAIAAxADgANQA0AFIAZQBnAHUAbABhAHIATQBhAHQAaABzACAARgBvAHIAIABNAG8AcgBlACAAUgBvAHUAbgBkACAAYgByAGEAYwBrAGUAdABzACAAdwBpAHQAaAAgAGEAcwBjAGUAbgB0ACAAMQA4ADUANABSAG8AdQBuAGQAIABiAHIAYQBjAGsAZQB0AHMAIAB3AGkAdABoACAAYQBzAGMAZQBuAHQAIAAxADgANQA0AFYAZQByAHMAaQBvAG4AIAAyAC4AMFJvdW5kX2JyYWNrZXRzX3dpdGhfYXNjZW50XzE4NTQATQBhAHQAaABzACAARgBvAHIAIABNAG8AcgBlAAAAAAMAAAAAAAADnwHPAAAAAAAAAAAAAAAAAAAAAAAAAAC5B%2F8AAY2FAA%3D%3D)format('truetype')%3Bfont-weight%3Anormal%3Bfont-style%3Anormal%3B%7D%3C%2Fstyle%3E%3C%2Fdefs%3E%3Ctext%20font-family%3D%22Times%20New%20Roman%22%20font-size%3D%2218%22%20text-anchor%3D%22middle%22%20x%3D%225.5%22%20y%3D%2216%22%3EP%3C%2Ftext%3E%3Ctext%20font-family%3D%22round_brackets18549f92a457f2409%22%20font-size%3D%2218%22%20text-anchor%3D%22middle%22%20x%3D%2213.5%22%20y%3D%2216%22%3E(%3C%2Ftext%3E%3Ctext%20font-family%3D%22Times%20New%20Roman%22%20font-size%3D%2218%22%20font-style%3D%22italic%22%20text-anchor%3D%22middle%22%20x%3D%2222.5%22%20y%3D%2216%22%3EX%3C%2Ftext%3E%3Ctext%20font-family%3D%22math17f39f8317fbdb1988ef4c628eb%22%20font-size%3D%2216%22%20text-anchor%3D%22middle%22%20x%3D%2238.5%22%20y%3D%2216%22%3E%3D%3C%2Ftext%3E%3Ctext%20font-family%3D%22Times%20New%20Roman%22%20font-size%3D%2218%22%20font-style%3D%22italic%22%20text-anchor%3D%22middle%22%20x%3D%2251.5%22%20y%3D%2216%22%3Ea%3C%2Ftext%3E%3Ctext%20font-family%3D%22round_brackets18549f92a457f2409%22%20font-size%3D%2218%22%20text-anchor%3D%22middle%22%20x%3D%2258.5%22%20y%3D%2216%22%3E)%3C%2Ftext%3E%3Ctext%20font-family%3D%22math17f39f8317fbdb1988ef4c628eb%22%20font-size%3D%2216%22%20text-anchor%3D%22middle%22%20x%3D%2270.5%22%20y%3D%2216%22%3E%3D%3C%2Ftext%3E%3Ctext%20font-family%3D%22Times%20New%20Roman%22%20font-size%3D%2218%22%20text-anchor%3D%22middle%22%20x%3D%2283.5%22%20y%3D%2216%22%3E0%3C%2Ftext%3E%3C%2Fsvg%3E) , for any single value
, for any single value 
Because
%3C%2Fmo%3E%3Cmo%3E%3D%3C%2Fmo%3E%3Cmsubsup%3E%3Cmo%3E%26%23x222B%3B%3C%2Fmo%3E%3Cmi%3Ea%3C%2Fmi%3E%3Cmi%3Ea%3C%2Fmi%3E%3C%2Fmsubsup%3E%3Cmi%3Ef%3C%2Fmi%3E%3Cmo%3E(%3C%2Fmo%3E%3Cmi%3Ex%3C%2Fmi%3E%3Cmo%3E)%3C%2Fmo%3E%3Cmo%3E%26%23xA0%3B%3C%2Fmo%3E%3Cmi%20mathvariant%3D%22normal%22%3Ed%3C%2Fmi%3E%3Cmi%3Ex%3C%2Fmi%3E%3Cmo%3E%3D%3C%2Fmo%3E%3Cmn%3E0%3C%2Fmn%3E%3C%2Fmath%3E--%3E%3Cdefs%3E%3Cstyle%20type%3D%22text%2Fcss%22%3E%40font-face%7Bfont-family%3A'math10462dcb703a1ad9d572706d443'%3Bsrc%3Aurl(data%3Afont%2Ftruetype%3Bcharset%3Dutf-8%3Bbase64%2CAAEAAAAMAIAAAwBAT1MvMi7iBBMAAADMAAAATmNtYXDEvmKUAAABHAAAADxjdnQgDVUNBwAAAVgAAAA6Z2x5ZoPi2VsAAAGUAAABEGhlYWQQC2qxAAACpAAAADZoaGVhCGsXSAAAAtwAAAAkaG10eE2rRkcAAAMAAAAADGxvY2EAHTwYAAADDAAAABBtYXhwBT0FPgAAAxwAAAAgbmFtZaBxlY4AAAM8AAABn3Bvc3QB9wD6AAAE3AAAACBwcmVwa1uragAABPwAAAAUAAADSwGQAAUAAAQABAAAAAAABAAEAAAAAAAAAQEAAAAAAAAAAAAAAAAAAAAAAAAAAAAAAAAAAAAAACAgICAAAAAg1UADev96AAAD6ACWAAAAAAACAAEAAQAAABQAAwABAAAAFAAEACgAAAAGAAQAAQACAD0iK%2F%2F%2FAAAAPSIr%2F%2F%2F%2FxN3XAAEAAAAAAAAAAAFUAywAgAEAAFYAKgJYAh4BDgEsAiwAWgGAAoAAoADUAIAAAAAAAAAAKwBVAIAAqwDVAQABKwAHAAAAAgBVAAADAAOrAAMABwAAMxEhESUhESFVAqv9qwIA%2FgADq%2FxVVQMAAAIAgADrAtUCFQADAAcAZRgBsAgQsAbUsAYQsAXUsAgQsAHUsAEQsADUsAYQsAc8sAUQsAQ8sAEQsAI8sAAQsAM8ALAIELAG1LAGELAH1LAHELAB1LABELAC1LAGELAFPLAHELAEPLABELAAPLACELADPDEwEyE1IR0BITWAAlX9qwJVAcBV1VVVAAEAS%2F9rAgsDQAAZAAABJg4BAwIOASMmNDYGIxY%2BARMSPgEzFg4BNgH1NTUgICBANkAqVQs1NTYgICBANUArAVULAxUWK4v%2B4P7AiiAVQBVAFSuKASABQIsgFUAVPwABAAAAAQAA1XjOQV8PPPUAAwQA%2F%2F%2F%2F%2F9Y6E3P%2F%2F%2F%2F%2F1joTcwAA%2FyAEgAOrAAAACgACAAEAAAAAAAEAAAPo%2F2oAABdwAAD%2FtgSAAAEAAAAAAAAAAAAAAAAAAAADA1IAVQNWAIAB9ABLAAAAAAAAACgAAACyAAABEAABAAAAAwBeAAUAAAAAAAIAgAQAAAAAAAQAAN4AAAAAAAAAFQECAAAAAAAAAAEAEgAAAAAAAAAAAAIADgASAAAAAAAAAAMAMAAgAAAAAAAAAAQAEgBQAAAAAAAAAAUAFgBiAAAAAAAAAAYACQB4AAAAAAAAAAgAHACBAAEAAAAAAAEAEgAAAAEAAAAAAAIADgASAAEAAAAAAAMAMAAgAAEAAAAAAAQAEgBQAAEAAAAAAAUAFgBiAAEAAAAAAAYACQB4AAEAAAAAAAgAHACBAAMAAQQJAAEAEgAAAAMAAQQJAAIADgASAAMAAQQJAAMAMAAgAAMAAQQJAAQAEgBQAAMAAQQJAAUAFgBiAAMAAQQJAAYACQB4AAMAAQQJAAgAHACBAE0AYQB0AGgAIABGAG8AbgB0AFIAZQBnAHUAbABhAHIATQBhAHQAaABzACAARgBvAHIAIABNAG8AcgBlACAATQBhAHQAaAAgAEYAbwBuAHQATQBhAHQAaAAgAEYAbwBuAHQAVgBlAHIAcwBpAG8AbgAgADEALgAwTWF0aF9Gb250AE0AYQB0AGgAcwAgAEYAbwByACAATQBvAHIAZQAAAwAAAAAAAAH0APoAAAAAAAAAAAAAAAAAAAAAAAAAALkHEQAAjYUYALIAAAAVFBOxAAE%2F)format('truetype')%3Bfont-weight%3Anormal%3Bfont-style%3Anormal%3B%7D%40font-face%7Bfont-family%3A'round_brackets18549f92a457f2409'%3Bsrc%3Aurl(data%3Afont%2Ftruetype%3Bcharset%3Dutf-8%3Bbase64%2CAAEAAAAMAIAAAwBAT1MvMjwHLFQAAADMAAAATmNtYXDf7xCrAAABHAAAADxjdnQgBAkDLgAAAVgAAAASZ2x5ZmAOz2cAAAFsAAABJGhlYWQOKih8AAACkAAAADZoaGVhCvgVwgAAAsgAAAAkaG10eCA6AAIAAALsAAAADGxvY2EAAARLAAAC%2BAAAABBtYXhwBIgEWQAAAwgAAAAgbmFtZXHR30MAAAMoAAACOXBvc3QDogHPAAAFZAAAACBwcmVwupWEAAAABYQAAAAHAAAGcgGQAAUAAAgACAAAAAAACAAIAAAAAAAAAQIAAAAAAAAAAAAAAAAAAAAAAAAAAAAAAAAAAAAAACAgICAAAAAo8AMGe%2F57AAAHPgGyAAAAAAACAAEAAQAAABQAAwABAAAAFAAEACgAAAAGAAQAAQACACgAKf%2F%2FAAAAKAAp%2F%2F%2F%2F2f%2FZAAEAAAAAAAAAAAFUAFYBAAAsAKgDgAAyAAcAAAACAAAAKgDVA1UAAwAHAAA1MxEjEyMRM9XVq4CAKgMr%2FQAC1QABAAD%2B0AIgBtAACQBNGAGwChCwA9SwAxCwAtSwChCwBdSwBRCwANSwAxCwBzywAhCwCDwAsAoQsAPUsAMQsAfUsAoQsAXUsAoQsADUsAMQsAI8sAcQsAg8MTAREAEzABEQASMAAZCQ%2FnABkJD%2BcALQ%2FZD%2BcAGQAnACcAGQ%2FnAAAQAA%2FtACIAbQAAkATRgBsAoQsAPUsAMQsALUsAoQsAXUsAUQsADUsAMQsAc8sAIQsAg8ALAKELAD1LADELAH1LAKELAF1LAKELAA1LADELACPLAHELAIPDEwARABIwAREAEzAAIg%2FnCQAZD%2BcJABkALQ%2FZD%2BcAGQAnACcAGQ%2FnAAAQAAAAEAAPW2NYFfDzz1AAMIAP%2F%2F%2F%2F%2FVre7u%2F%2F%2F%2F%2F9Wt7u4AAP7QA7cG0AAAAAoAAgABAAAAAAABAAAHPv5OAAAXcAAA%2F%2F4DtwABAAAAAAAAAAAAAAAAAAAAAwDVAAACIAAAAiAAAAAAAAAAAAAkAAAAowAAASQAAQAAAAMACgACAAAAAAACAIAEAAAAAAAEAABNAAAAAAAAABUBAgAAAAAAAAABAD4AAAAAAAAAAAACAA4APgAAAAAAAAADAFwATAAAAAAAAAAEAD4AqAAAAAAAAAAFABYA5gAAAAAAAAAGAB8A%2FAAAAAAAAAAIABwBGwABAAAAAAABAD4AAAABAAAAAAACAA4APgABAAAAAAADAFwATAABAAAAAAAEAD4AqAABAAAAAAAFABYA5gABAAAAAAAGAB8A%2FAABAAAAAAAIABwBGwADAAEECQABAD4AAAADAAEECQACAA4APgADAAEECQADAFwATAADAAEECQAEAD4AqAADAAEECQAFABYA5gADAAEECQAGAB8A%2FAADAAEECQAIABwBGwBSAG8AdQBuAGQAIABiAHIAYQBjAGsAZQB0AHMAIAB3AGkAdABoACAAYQBzAGMAZQBuAHQAIAAxADgANQA0AFIAZQBnAHUAbABhAHIATQBhAHQAaABzACAARgBvAHIAIABNAG8AcgBlACAAUgBvAHUAbgBkACAAYgByAGEAYwBrAGUAdABzACAAdwBpAHQAaAAgAGEAcwBjAGUAbgB0ACAAMQA4ADUANABSAG8AdQBuAGQAIABiAHIAYQBjAGsAZQB0AHMAIAB3AGkAdABoACAAYQBzAGMAZQBuAHQAIAAxADgANQA0AFYAZQByAHMAaQBvAG4AIAAyAC4AMFJvdW5kX2JyYWNrZXRzX3dpdGhfYXNjZW50XzE4NTQATQBhAHQAaABzACAARgBvAHIAIABNAG8AcgBlAAAAAAMAAAAAAAADnwHPAAAAAAAAAAAAAAAAAAAAAAAAAAC5B%2F8AAY2FAA%3D%3D)format('truetype')%3Bfont-weight%3Anormal%3Bfont-style%3Anormal%3B%7D%3C%2Fstyle%3E%3C%2Fdefs%3E%3Ctext%20font-family%3D%22Times%20New%20Roman%22%20font-size%3D%2218%22%20text-anchor%3D%22middle%22%20x%3D%225.5%22%20y%3D%2227%22%3EP%3C%2Ftext%3E%3Ctext%20font-family%3D%22round_brackets18549f92a457f2409%22%20font-size%3D%2218%22%20text-anchor%3D%22middle%22%20x%3D%2213.5%22%20y%3D%2227%22%3E(%3C%2Ftext%3E%3Ctext%20font-family%3D%22Times%20New%20Roman%22%20font-size%3D%2218%22%20font-style%3D%22italic%22%20text-anchor%3D%22middle%22%20x%3D%2222.5%22%20y%3D%2227%22%3EX%3C%2Ftext%3E%3Ctext%20font-family%3D%22math10462dcb703a1ad9d572706d443%22%20font-size%3D%2216%22%20text-anchor%3D%22middle%22%20x%3D%2238.5%22%20y%3D%2227%22%3E%3D%3C%2Ftext%3E%3Ctext%20font-family%3D%22Times%20New%20Roman%22%20font-size%3D%2218%22%20font-style%3D%22italic%22%20text-anchor%3D%22middle%22%20x%3D%2251.5%22%20y%3D%2227%22%3Ea%3C%2Ftext%3E%3Ctext%20font-family%3D%22round_brackets18549f92a457f2409%22%20font-size%3D%2218%22%20text-anchor%3D%22middle%22%20x%3D%2258.5%22%20y%3D%2227%22%3E)%3C%2Ftext%3E%3Ctext%20font-family%3D%22math10462dcb703a1ad9d572706d443%22%20font-size%3D%2216%22%20text-anchor%3D%22middle%22%20x%3D%2270.5%22%20y%3D%2227%22%3E%3D%3C%2Ftext%3E%3Ctext%20font-family%3D%22math10462dcb703a1ad9d572706d443%22%20font-size%3D%2232%22%20text-anchor%3D%22middle%22%20x%3D%2287.5%22%20y%3D%2231%22%3E%26%23x222B%3B%3C%2Ftext%3E%3Ctext%20font-family%3D%22Times%20New%20Roman%22%20font-size%3D%2213%22%20font-style%3D%22italic%22%20text-anchor%3D%22middle%22%20x%3D%2292.5%22%20y%3D%2245%22%3Ea%3C%2Ftext%3E%3Ctext%20font-family%3D%22Times%20New%20Roman%22%20font-size%3D%2213%22%20font-style%3D%22italic%22%20text-anchor%3D%22middle%22%20x%3D%22100.5%22%20y%3D%2212%22%3Ea%3C%2Ftext%3E%3Ctext%20font-family%3D%22Times%20New%20Roman%22%20font-size%3D%2218%22%20font-style%3D%22italic%22%20text-anchor%3D%22middle%22%20x%3D%22107.5%22%20y%3D%2227%22%3Ef%3C%2Ftext%3E%3Ctext%20font-family%3D%22round_brackets18549f92a457f2409%22%20font-size%3D%2218%22%20text-anchor%3D%22middle%22%20x%3D%22116.5%22%20y%3D%2227%22%3E(%3C%2Ftext%3E%3Ctext%20font-family%3D%22Times%20New%20Roman%22%20font-size%3D%2218%22%20font-style%3D%22italic%22%20text-anchor%3D%22middle%22%20x%3D%22123.5%22%20y%3D%2227%22%3Ex%3C%2Ftext%3E%3Ctext%20font-family%3D%22round_brackets18549f92a457f2409%22%20font-size%3D%2218%22%20text-anchor%3D%22middle%22%20x%3D%22131.5%22%20y%3D%2227%22%3E)%3C%2Ftext%3E%3Ctext%20font-family%3D%22Times%20New%20Roman%22%20font-size%3D%2218%22%20text-anchor%3D%22middle%22%20x%3D%22143.5%22%20y%3D%2227%22%3Ed%3C%2Ftext%3E%3Ctext%20font-family%3D%22Times%20New%20Roman%22%20font-size%3D%2218%22%20font-style%3D%22italic%22%20text-anchor%3D%22middle%22%20x%3D%22152.5%22%20y%3D%2227%22%3Ex%3C%2Ftext%3E%3Ctext%20font-family%3D%22math10462dcb703a1ad9d572706d443%22%20font-size%3D%2216%22%20text-anchor%3D%22middle%22%20x%3D%22166.5%22%20y%3D%2227%22%3E%3D%3C%2Ftext%3E%3Ctext%20font-family%3D%22Times%20New%20Roman%22%20font-size%3D%2218%22%20text-anchor%3D%22middle%22%20x%3D%22179.5%22%20y%3D%2227%22%3E0%3C%2Ftext%3E%3C%2Fsvg%3E)
For linear functions it can be easier to calculate the probability integral using areas of geometric shapes
Rectangle: A = bh
Triangle: A = ½(bh)
Trapezoid: A = ½(a+b)h
How do I determine whether a function is a valid pdf?
Some questions may ask you to justify the use of a given function as a probability density function
In such cases check and confirm that the function meets the two conditions
f(x) ≥ 0 for all values of x
total area under the graph is 1
Examiner Tips and Tricks
Don't forget the ![]() condition. A common error is to confirm that the total area is equal to 1, but to forget to confirm that
condition. A common error is to confirm that the total area is equal to 1, but to forget to confirm that ![]() is always true.
is always true.
How do I use a pdf to find probabilities?
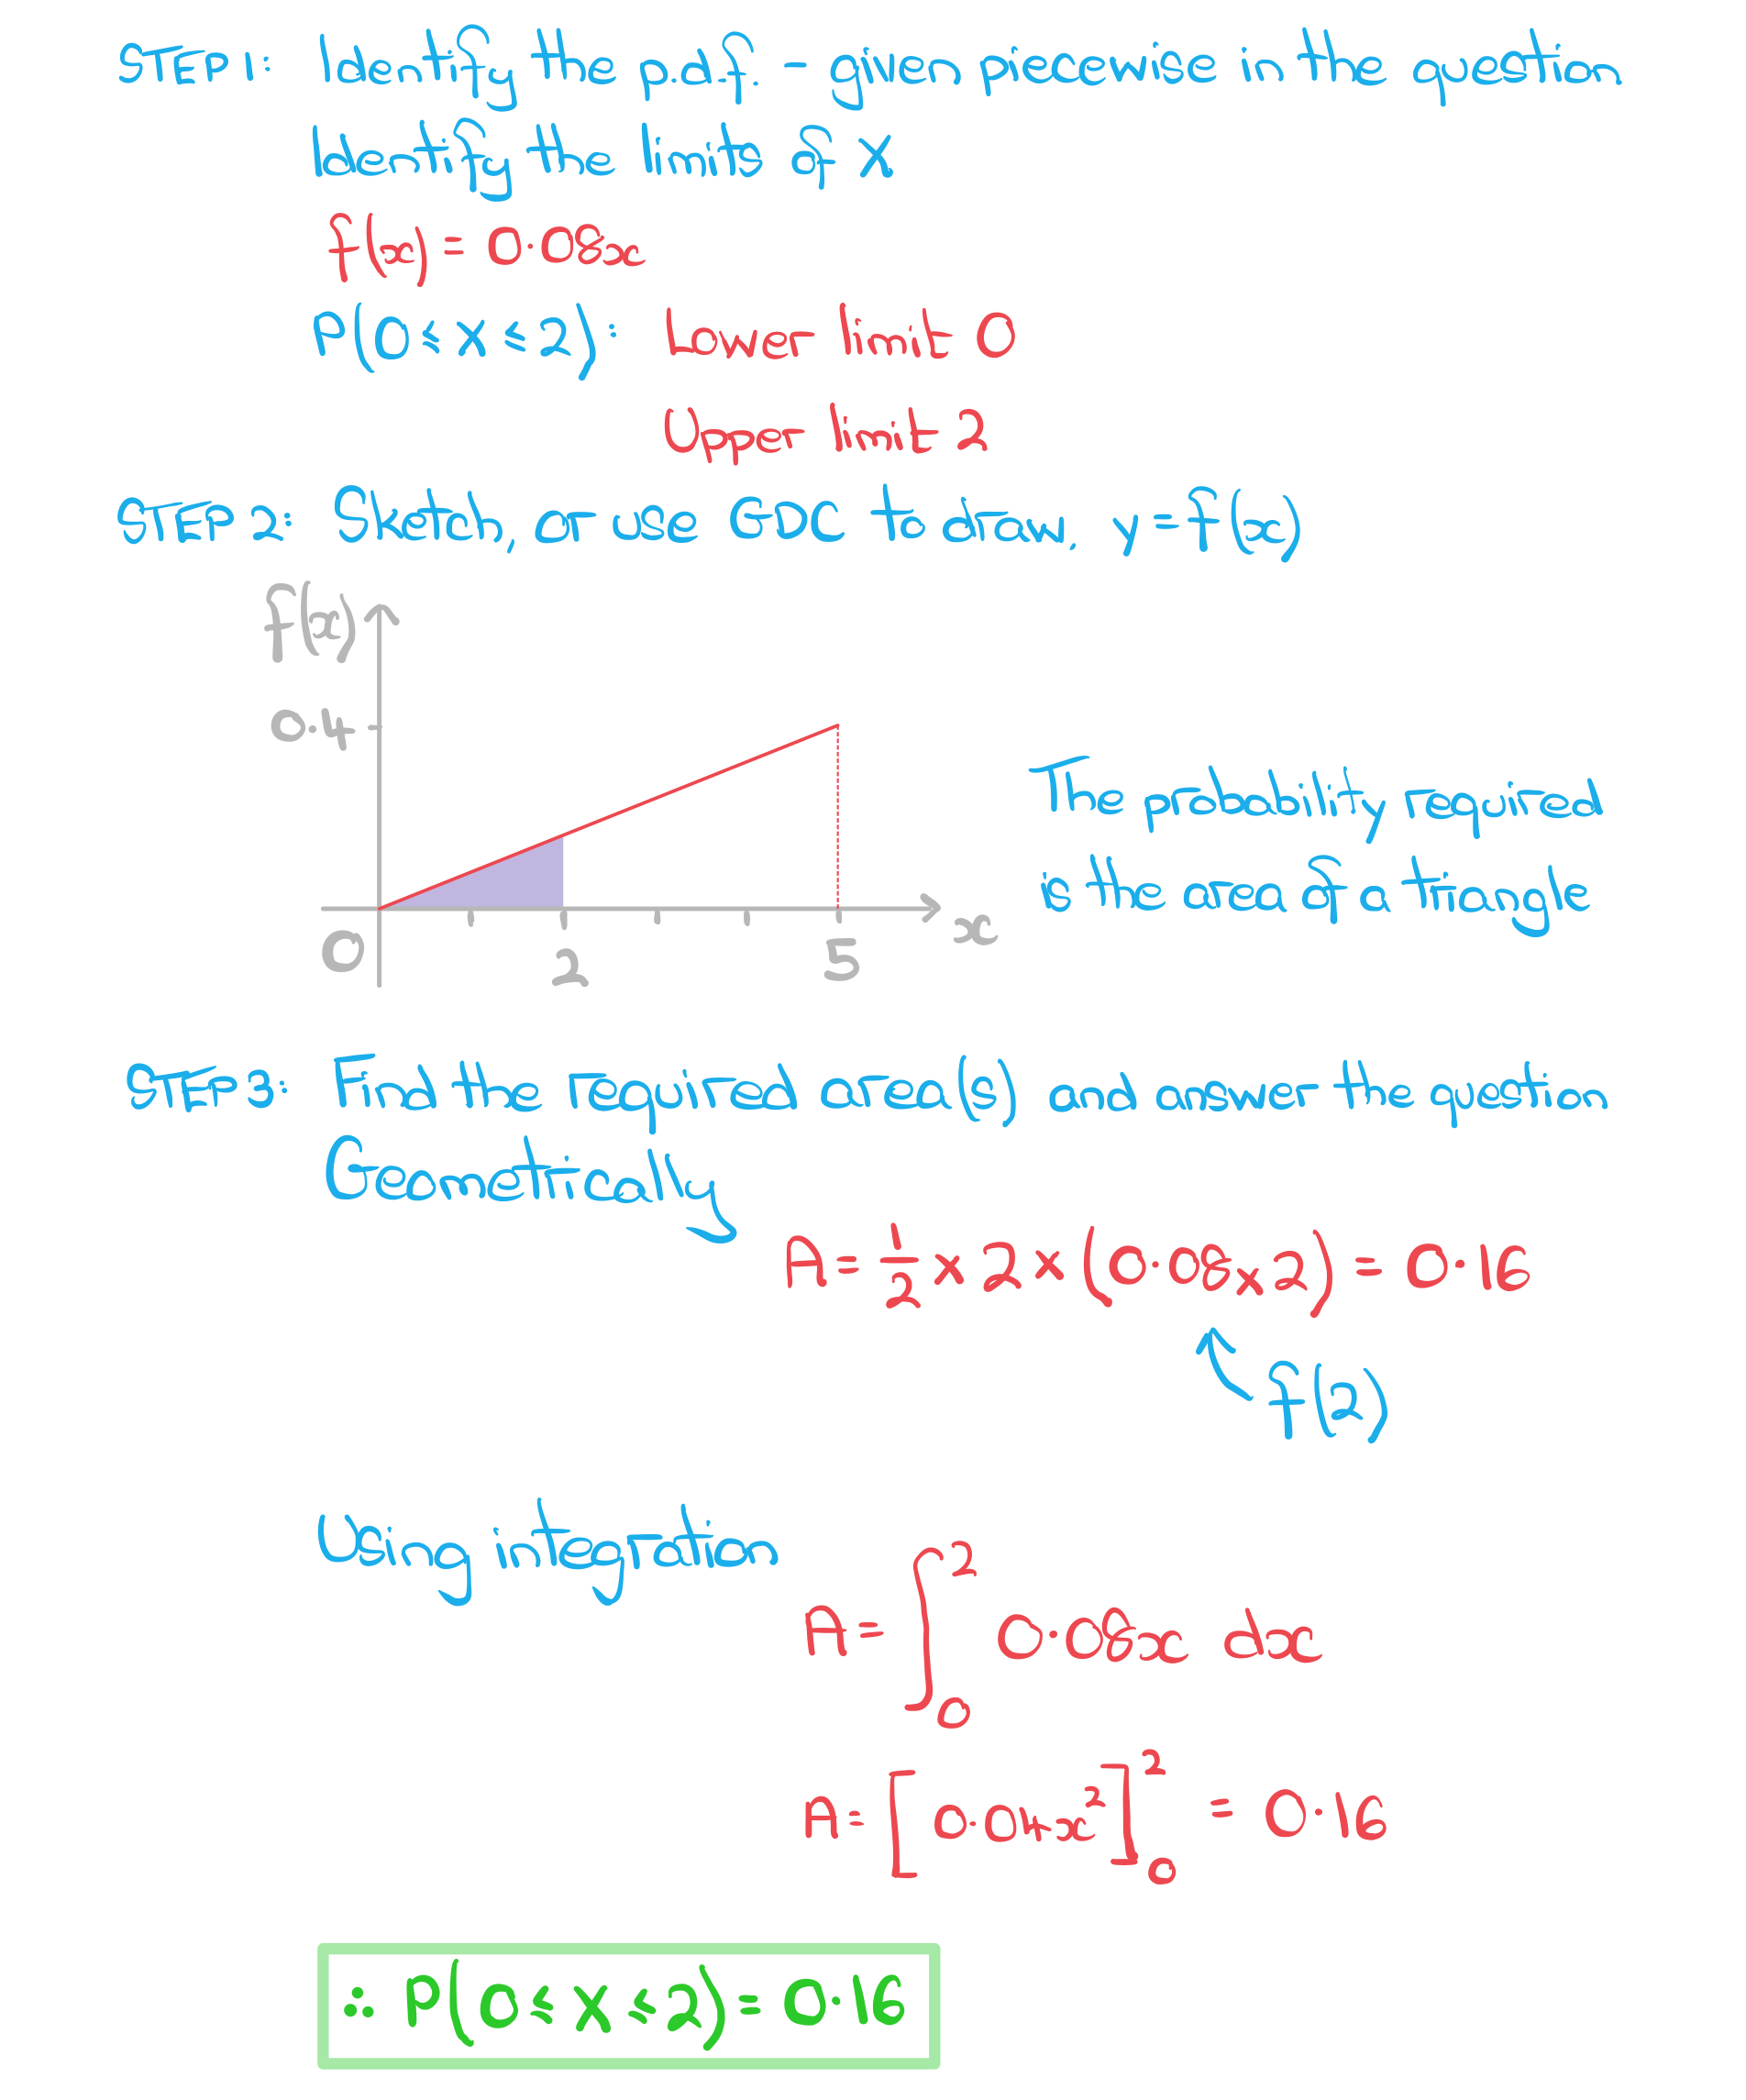
STEP 1
Identify the probability density function, f(x) - this may be given as a graph, an equation or as a piecewise functione.g.
%3C%2Fmo%3E%3Cmo%3E%3D%3C%2Fmo%3E%3Cmfenced%20close%3D%22%22%20open%3D%22%7B%22%3E%3Cmtable%3E%3Cmtr%3E%3Cmtd%3E%3Cmn%3E0%3C%2Fmn%3E%3Cmo%3E.%3C%2Fmo%3E%3Cmn%3E02%3C%2Fmn%3E%3Cmi%3Ex%3C%2Fmi%3E%3C%2Fmtd%3E%3Cmtd%3E%3Cmn%3E0%3C%2Fmn%3E%3Cmo%3E%26%23x2264%3B%3C%2Fmo%3E%3Cmi%3Ex%3C%2Fmi%3E%3Cmo%3E%26%23x2264%3B%3C%2Fmo%3E%3Cmn%3E10%3C%2Fmn%3E%3C%2Fmtd%3E%3C%2Fmtr%3E%3Cmtr%3E%3Cmtd%3E%3Cmn%3E0%3C%2Fmn%3E%3C%2Fmtd%3E%3Cmtd%3E%3Cmi%3Eotherwise%3C%2Fmi%3E%3C%2Fmtd%3E%3C%2Fmtr%3E%3C%2Fmtable%3E%3C%2Fmfenced%3E%3C%2Fmath%3E--%3E%3Cdefs%3E%3Cstyle%20type%3D%22text%2Fcss%22%3E%40font-face%7Bfont-family%3A'math1a3e9e66d3b0fb1281f7814e8d5'%3Bsrc%3Aurl(data%3Afont%2Ftruetype%3Bcharset%3Dutf-8%3Bbase64%2CAAEAAAAMAIAAAwBAT1MvMi7iBBMAAADMAAAATmNtYXDEvmKUAAABHAAAAERjdnQgDVUNBwAAAWAAAAA6Z2x5ZoPi2VsAAAGcAAABYWhlYWQQC2qxAAADAAAAADZoaGVhCGsXSAAAAzgAAAAkaG10eE2rRkcAAANcAAAAEGxvY2EAHTwYAAADbAAAABRtYXhwBT0FPgAAA4AAAAAgbmFtZaBxlY4AAAOgAAABn3Bvc3QB9wD6AAAFQAAAACBwcmVwa1uragAABWAAAAAUAAADSwGQAAUAAAQABAAAAAAABAAEAAAAAAAAAQEAAAAAAAAAAAAAAAAAAAAAAAAAAAAAAAAAAAAAACAgICAAAAAg1UADev96AAAD6ACWAAAAAAACAAEAAQAAABQAAwABAAAAFAAEADAAAAAIAAgAAgAAAC4APSJk%2F%2F8AAAAuAD0iZP%2F%2F%2F9P%2Fxd2fAAEAAAAAAAAAAAAAAVQDLACAAQAAVgAqAlgCHgEOASwCLABaAYACgACgANQAgAAAAAAAAAArAFUAgACrANUBAAErAAcAAAACAFUAAAMAA6sAAwAHAAAzESERJSERIVUCq%2F2rAgD%2BAAOr%2FFVVAwAAAQAgAAAAoACAAAMALxgBsAQQsAPUsAMQsALUsAMQsAA8sAIQsAE8ALAEELAD1LADELACPLAAELABPDAxNzMVIyCAgICAAAIAgADrAtUCFQADAAcAZRgBsAgQsAbUsAYQsAXUsAgQsAHUsAEQsADUsAYQsAc8sAUQsAQ8sAEQsAI8sAAQsAM8ALAIELAG1LAGELAH1LAHELAB1LABELAC1LAGELAFPLAHELAEPLABELAAPLACELADPDEwEyE1IR0BITWAAlX9qwJVAcBV1VVVAAMAgP%2BrAoACqwADAAcACwAvGAEAsQkAP7EIBeSxAgX0sQEE9LEGBfSxAwTksQUE9LEEBfSxBwEQPLEABhA8MDETBwE1EzUBFwE1IRWBAQH%2FAf4AAQH%2F%2FgABq1b%2FAFYBqlb%2FAFb%2BVlVVAAAAAAEAAAABAADVeM5BXw889QADBAD%2F%2F%2F%2F%2F1joTc%2F%2F%2F%2F%2F%2FWOhNzAAD%2FIASAA6sAAAAKAAIAAQAAAAAAAQAAA%2Bj%2FagAAF3AAAP%2B2BIAAAQAAAAAAAAAAAAAAAAAAAAQDUgBVAMgAIANWAIADAACAAAAAAAAAACgAAABuAAAA%2BAAAAWEAAQAAAAQAXgAFAAAAAAACAIAEAAAAAAAEAADeAAAAAAAAABUBAgAAAAAAAAABABIAAAAAAAAAAAACAA4AEgAAAAAAAAADADAAIAAAAAAAAAAEABIAUAAAAAAAAAAFABYAYgAAAAAAAAAGAAkAeAAAAAAAAAAIABwAgQABAAAAAAABABIAAAABAAAAAAACAA4AEgABAAAAAAADADAAIAABAAAAAAAEABIAUAABAAAAAAAFABYAYgABAAAAAAAGAAkAeAABAAAAAAAIABwAgQADAAEECQABABIAAAADAAEECQACAA4AEgADAAEECQADADAAIAADAAEECQAEABIAUAADAAEECQAFABYAYgADAAEECQAGAAkAeAADAAEECQAIABwAgQBNAGEAdABoACAARgBvAG4AdABSAGUAZwB1AGwAYQByAE0AYQB0AGgAcwAgAEYAbwByACAATQBvAHIAZQAgAE0AYQB0AGgAIABGAG8AbgB0AE0AYQB0AGgAIABGAG8AbgB0AFYAZQByAHMAaQBvAG4AIAAxAC4AME1hdGhfRm9udABNAGEAdABoAHMAIABGAG8AcgAgAE0AbwByAGUAAAMAAAAAAAAB9AD6AAAAAAAAAAAAAAAAAAAAAAAAAAC5BxEAAI2FGACyAAAAFRQTsQABPw%3D%3D)format('truetype')%3Bfont-weight%3Anormal%3Bfont-style%3Anormal%3B%7D%40font-face%7Bfont-family%3A'brack_sm74a4ec520979a73b06ad972'%3Bsrc%3Aurl(data%3Afont%2Ftruetype%3Bcharset%3Dutf-8%3Bbase64%2CAAEAAAAMAIAAAwBAT1MvMi7PH4UAAADMAAAATmNtYXA3kjw6AAABHAAAAExjdnQgAQYDiAAAAWgAAAASZ2x5ZkyYQ7YAAAF8AAABLGhlYWQLyR8fAAACqAAAADZoaGVhAq0XCAAAAuAAAAAkaG10eDEjA%2FUAAAMEAAAAFGxvY2EAAEKZAAADGAAAABhtYXhwBJsEcQAAAzAAAAAgbmFtZW7QvZAAAANQAAAB5XBvc3QArQBVAAAFOAAAACBwcmVwu5WEAAAABVgAAAAHAAACDAGQAAUAAAQABAAAAAAABAAEAAAAAAAAAQEAAAAAAAAAAAAAAAAAAAAAAAAAAAAAAAAAAAAAACAgICAAAAAg9AMD%2FP%2F8AAABVAABAAAAAAACAAEAAQAAABQAAwABAAAAFAAEADgAAAAKAAgAAgACI6cjqCOpI6r%2F%2FwAAI6cjqCOpI6r%2F%2F9xa3FrcWtxaAAEAAAAAAAAAAAAAAAABVABUAQAAKwCMAIAAqAAHAAAAAgAAAAAA1QEBAAMABwAAMTMRIxcjNTPV1auAgAEB1qsAAQAAAAABAAFVAAcAIxgBsQAAP7EHAv2xAwf8sAQ8ALEAAD%2BwBzyxAwH2sQQE%2FTEwMTQ2NxUOARVrlWtAa8AqKivAQAAB%2F4AAAABVAVQACQAhGAGxBQA%2FsAE8sQYC%2FbAAPACxBQA%2FsAY8sQEBP7AAPDEwEyMUBxYVMzQnNlVVgIBVgIABVFVUVlVVVlQAAQAAAAABAAFUAAcAIxgBsQAAP7EHAv2xAwf8sAQ8ALEAAT%2BwBzyxAwH2sQQE%2FTEwERQWFzUuATVrlWtAAVRqwCorKcBAAAEAAAAAAFUBVAADACAYAbAEELAAPLADPLEBAvWwAjwAsAMvsAI8sQAB9bABPBEzESNVVQFU%2FqwAAQAAAAEAAIsesexfDzz1AAMEAP%2F%2F%2F%2F%2FVre5k%2F%2F%2F%2F%2F9Wt7mT%2FgP%2F%2FAdYBWAAAAAoAAgABAAAAAAABAAABVP%2F%2FAAAXcP%2BA%2F4AB1gABAAAAAAAAAAAAAAAAAAAABQDVAAABAAAAAQD%2FgAEAAAABAAAAAAAAAAAAACEAAABlAAAArgAAAPQAAAEsAAEAAAAFAAoAAgAAAAAAAgCABAAAAAAABAAAZQAAAAAAAAAVAQIAAAAAAAAAAQAmAAAAAAAAAAAAAgAOACYAAAAAAAAAAwBEADQAAAAAAAAABAAmAHgAAAAAAAAABQAWAJ4AAAAAAAAABgATALQAAAAAAAAACAAcAMcAAQAAAAAAAQAmAAAAAQAAAAAAAgAOACYAAQAAAAAAAwBEADQAAQAAAAAABAAmAHgAAQAAAAAABQAWAJ4AAQAAAAAABgATALQAAQAAAAAACAAcAMcAAwABBAkAAQAmAAAAAwABBAkAAgAOACYAAwABBAkAAwBEADQAAwABBAkABAAmAHgAAwABBAkABQAWAJ4AAwABBAkABgATALQAAwABBAkACAAcAMcAQgByAGEAYwBrAGUAdABzACAAcwBtAGEAbABsACAAcwBpAHoAZQBSAGUAZwB1AGwAYQByAE0AYQB0AGgAcwAgAEYAbwByACAATQBvAHIAZQAgAEIAcgBhAGMAawBlAHQAcwAgAHMAbQBhAGwAbAAgAHMAaQB6AGUAQgByAGEAYwBrAGUAdABzACAAcwBtAGEAbABsACAAcwBpAHoAZQBWAGUAcgBzAGkAbwBuACAAMgAuADBCcmFja2V0c19zbWFsbF9zaXplAE0AYQB0AGgAcwAgAEYAbwByACAATQBvAHIAZQAAAAADAAAAAAAAAKoAVQAAAAAAAAAAAAAAAAAAAAAAAAAAuQf%2FAAKNhQA%3D)format('truetype')%3Bfont-weight%3Anormal%3Bfont-style%3Anormal%3B%7D%40font-face%7Bfont-family%3A'round_brackets18549f92a457f2409'%3Bsrc%3Aurl(data%3Afont%2Ftruetype%3Bcharset%3Dutf-8%3Bbase64%2CAAEAAAAMAIAAAwBAT1MvMjwHLFQAAADMAAAATmNtYXDf7xCrAAABHAAAADxjdnQgBAkDLgAAAVgAAAASZ2x5ZmAOz2cAAAFsAAABJGhlYWQOKih8AAACkAAAADZoaGVhCvgVwgAAAsgAAAAkaG10eCA6AAIAAALsAAAADGxvY2EAAARLAAAC%2BAAAABBtYXhwBIgEWQAAAwgAAAAgbmFtZXHR30MAAAMoAAACOXBvc3QDogHPAAAFZAAAACBwcmVwupWEAAAABYQAAAAHAAAGcgGQAAUAAAgACAAAAAAACAAIAAAAAAAAAQIAAAAAAAAAAAAAAAAAAAAAAAAAAAAAAAAAAAAAACAgICAAAAAo8AMGe%2F57AAAHPgGyAAAAAAACAAEAAQAAABQAAwABAAAAFAAEACgAAAAGAAQAAQACACgAKf%2F%2FAAAAKAAp%2F%2F%2F%2F2f%2FZAAEAAAAAAAAAAAFUAFYBAAAsAKgDgAAyAAcAAAACAAAAKgDVA1UAAwAHAAA1MxEjEyMRM9XVq4CAKgMr%2FQAC1QABAAD%2B0AIgBtAACQBNGAGwChCwA9SwAxCwAtSwChCwBdSwBRCwANSwAxCwBzywAhCwCDwAsAoQsAPUsAMQsAfUsAoQsAXUsAoQsADUsAMQsAI8sAcQsAg8MTAREAEzABEQASMAAZCQ%2FnABkJD%2BcALQ%2FZD%2BcAGQAnACcAGQ%2FnAAAQAA%2FtACIAbQAAkATRgBsAoQsAPUsAMQsALUsAoQsAXUsAUQsADUsAMQsAc8sAIQsAg8ALAKELAD1LADELAH1LAKELAF1LAKELAA1LADELACPLAHELAIPDEwARABIwAREAEzAAIg%2FnCQAZD%2BcJABkALQ%2FZD%2BcAGQAnACcAGQ%2FnAAAQAAAAEAAPW2NYFfDzz1AAMIAP%2F%2F%2F%2F%2FVre7u%2F%2F%2F%2F%2F9Wt7u4AAP7QA7cG0AAAAAoAAgABAAAAAAABAAAHPv5OAAAXcAAA%2F%2F4DtwABAAAAAAAAAAAAAAAAAAAAAwDVAAACIAAAAiAAAAAAAAAAAAAkAAAAowAAASQAAQAAAAMACgACAAAAAAACAIAEAAAAAAAEAABNAAAAAAAAABUBAgAAAAAAAAABAD4AAAAAAAAAAAACAA4APgAAAAAAAAADAFwATAAAAAAAAAAEAD4AqAAAAAAAAAAFABYA5gAAAAAAAAAGAB8A%2FAAAAAAAAAAIABwBGwABAAAAAAABAD4AAAABAAAAAAACAA4APgABAAAAAAADAFwATAABAAAAAAAEAD4AqAABAAAAAAAFABYA5gABAAAAAAAGAB8A%2FAABAAAAAAAIABwBGwADAAEECQABAD4AAAADAAEECQACAA4APgADAAEECQADAFwATAADAAEECQAEAD4AqAADAAEECQAFABYA5gADAAEECQAGAB8A%2FAADAAEECQAIABwBGwBSAG8AdQBuAGQAIABiAHIAYQBjAGsAZQB0AHMAIAB3AGkAdABoACAAYQBzAGMAZQBuAHQAIAAxADgANQA0AFIAZQBnAHUAbABhAHIATQBhAHQAaABzACAARgBvAHIAIABNAG8AcgBlACAAUgBvAHUAbgBkACAAYgByAGEAYwBrAGUAdABzACAAdwBpAHQAaAAgAGEAcwBjAGUAbgB0ACAAMQA4ADUANABSAG8AdQBuAGQAIABiAHIAYQBjAGsAZQB0AHMAIAB3AGkAdABoACAAYQBzAGMAZQBuAHQAIAAxADgANQA0AFYAZQByAHMAaQBvAG4AIAAyAC4AMFJvdW5kX2JyYWNrZXRzX3dpdGhfYXNjZW50XzE4NTQATQBhAHQAaABzACAARgBvAHIAIABNAG8AcgBlAAAAAAMAAAAAAAADnwHPAAAAAAAAAAAAAAAAAAAAAAAAAAC5B%2F8AAY2FAA%3D%3D)format('truetype')%3Bfont-weight%3Anormal%3Bfont-style%3Anormal%3B%7D%3C%2Fstyle%3E%3C%2Fdefs%3E%3Ctext%20font-family%3D%22Times%20New%20Roman%22%20font-size%3D%2218%22%20font-style%3D%22italic%22%20text-anchor%3D%22middle%22%20x%3D%227.5%22%20y%3D%2233%22%3Ef%3C%2Ftext%3E%3Ctext%20font-family%3D%22round_brackets18549f92a457f2409%22%20font-size%3D%2218%22%20text-anchor%3D%22middle%22%20x%3D%2216.5%22%20y%3D%2233%22%3E(%3C%2Ftext%3E%3Ctext%20font-family%3D%22Times%20New%20Roman%22%20font-size%3D%2218%22%20font-style%3D%22italic%22%20text-anchor%3D%22middle%22%20x%3D%2223.5%22%20y%3D%2233%22%3Ex%3C%2Ftext%3E%3Ctext%20font-family%3D%22round_brackets18549f92a457f2409%22%20font-size%3D%2218%22%20text-anchor%3D%22middle%22%20x%3D%2231.5%22%20y%3D%2233%22%3E)%3C%2Ftext%3E%3Ctext%20font-family%3D%22math1a3e9e66d3b0fb1281f7814e8d5%22%20font-size%3D%2216%22%20text-anchor%3D%22middle%22%20x%3D%2243.5%22%20y%3D%2233%22%3E%3D%3C%2Ftext%3E%3Ctext%20font-family%3D%22brack_sm74a4ec520979a73b06ad972%22%20font-size%3D%2218%22%20text-anchor%3D%22start%22%20x%3D%2255.5%22%20y%3D%2213%22%3E%26%23x23A7%3B%3C%2Ftext%3E%3Ctext%20font-family%3D%22brack_sm74a4ec520979a73b06ad972%22%20font-size%3D%2218%22%20text-anchor%3D%22start%22%20x%3D%2255.5%22%20y%3D%2219%22%3E%26%23x23AA%3B%3C%2Ftext%3E%3Ctext%20font-family%3D%22brack_sm74a4ec520979a73b06ad972%22%20font-size%3D%2218%22%20text-anchor%3D%22start%22%20x%3D%2255.5%22%20y%3D%2225%22%3E%26%23x23AA%3B%3C%2Ftext%3E%3Ctext%20font-family%3D%22brack_sm74a4ec520979a73b06ad972%22%20font-size%3D%2218%22%20text-anchor%3D%22start%22%20x%3D%2255.5%22%20y%3D%2231%22%3E%26%23x23A8%3B%3C%2Ftext%3E%3Ctext%20font-family%3D%22brack_sm74a4ec520979a73b06ad972%22%20font-size%3D%2218%22%20text-anchor%3D%22start%22%20x%3D%2255.5%22%20y%3D%2237%22%3E%26%23x23AA%3B%3C%2Ftext%3E%3Ctext%20font-family%3D%22brack_sm74a4ec520979a73b06ad972%22%20font-size%3D%2218%22%20text-anchor%3D%22start%22%20x%3D%2255.5%22%20y%3D%2243%22%3E%26%23x23AA%3B%3C%2Ftext%3E%3Ctext%20font-family%3D%22brack_sm74a4ec520979a73b06ad972%22%20font-size%3D%2218%22%20text-anchor%3D%22start%22%20x%3D%2255.5%22%20y%3D%2249%22%3E%26%23x23A9%3B%3C%2Ftext%3E%3Ctext%20font-family%3D%22Times%20New%20Roman%22%20font-size%3D%2218%22%20text-anchor%3D%22middle%22%20x%3D%2269.5%22%20y%3D%2219%22%3E0%3C%2Ftext%3E%3Ctext%20font-family%3D%22math1a3e9e66d3b0fb1281f7814e8d5%22%20font-size%3D%2216%22%20text-anchor%3D%22middle%22%20x%3D%2276.5%22%20y%3D%2219%22%3E.%3C%2Ftext%3E%3Ctext%20font-family%3D%22Times%20New%20Roman%22%20font-size%3D%2218%22%20text-anchor%3D%22middle%22%20x%3D%2288.5%22%20y%3D%2219%22%3E02%3C%2Ftext%3E%3Ctext%20font-family%3D%22Times%20New%20Roman%22%20font-size%3D%2218%22%20font-style%3D%22italic%22%20text-anchor%3D%22middle%22%20x%3D%22101.5%22%20y%3D%2219%22%3Ex%3C%2Ftext%3E%3Ctext%20font-family%3D%22Times%20New%20Roman%22%20font-size%3D%2218%22%20text-anchor%3D%22middle%22%20x%3D%22119.5%22%20y%3D%2219%22%3E0%3C%2Ftext%3E%3Ctext%20font-family%3D%22math1a3e9e66d3b0fb1281f7814e8d5%22%20font-size%3D%2216%22%20text-anchor%3D%22middle%22%20x%3D%22132.5%22%20y%3D%2219%22%3E%26%23x2264%3B%3C%2Ftext%3E%3Ctext%20font-family%3D%22Times%20New%20Roman%22%20font-size%3D%2218%22%20font-style%3D%22italic%22%20text-anchor%3D%22middle%22%20x%3D%22144.5%22%20y%3D%2219%22%3Ex%3C%2Ftext%3E%3Ctext%20font-family%3D%22math1a3e9e66d3b0fb1281f7814e8d5%22%20font-size%3D%2216%22%20text-anchor%3D%22middle%22%20x%3D%22158.5%22%20y%3D%2219%22%3E%26%23x2264%3B%3C%2Ftext%3E%3Ctext%20font-family%3D%22Times%20New%20Roman%22%20font-size%3D%2218%22%20text-anchor%3D%22middle%22%20x%3D%22175.5%22%20y%3D%2219%22%3E10%3C%2Ftext%3E%3Ctext%20font-family%3D%22Times%20New%20Roman%22%20font-size%3D%2218%22%20text-anchor%3D%22middle%22%20x%3D%2285.5%22%20y%3D%2245%22%3E0%3C%2Ftext%3E%3Ctext%20font-family%3D%22Times%20New%20Roman%22%20font-size%3D%2218%22%20text-anchor%3D%22middle%22%20x%3D%22150.5%22%20y%3D%2245%22%3Eotherwise%3C%2Ftext%3E%3C%2Fsvg%3E)
Identify the limits of x for a particular problem
Remember that P(a ≤ X ≤ b) = P(a < X < b)
STEP 2
Sketch, or use your GDC to draw, the graph of y = f(x)Look for basic shapes (rectangles, triangles and trapezoids) as finding these areas is easier without using integration
Look for symmetry in the graph that may make the problem easier
Break the area required into two or more parts if it makes the problem easier
STEP 3
Find the area(s) required using basic shapes or integration and answer the question
Trickier problems may ask you to find one of the integration limits of the integral given the value of a probability
e.g. Find the value of
given that format('truetype')%3Bfont-weight%3Anormal%3Bfont-style%3Anormal%3B%7D%40font-face%7Bfont-family%3A'round_brackets18549f92a457f2409'%3Bsrc%3Aurl(data%3Afont%2Ftruetype%3Bcharset%3Dutf-8%3Bbase64%2CAAEAAAAMAIAAAwBAT1MvMjwHLFQAAADMAAAATmNtYXDf7xCrAAABHAAAADxjdnQgBAkDLgAAAVgAAAASZ2x5ZmAOz2cAAAFsAAABJGhlYWQOKih8AAACkAAAADZoaGVhCvgVwgAAAsgAAAAkaG10eCA6AAIAAALsAAAADGxvY2EAAARLAAAC%2BAAAABBtYXhwBIgEWQAAAwgAAAAgbmFtZXHR30MAAAMoAAACOXBvc3QDogHPAAAFZAAAACBwcmVwupWEAAAABYQAAAAHAAAGcgGQAAUAAAgACAAAAAAACAAIAAAAAAAAAQIAAAAAAAAAAAAAAAAAAAAAAAAAAAAAAAAAAAAAACAgICAAAAAo8AMGe%2F57AAAHPgGyAAAAAAACAAEAAQAAABQAAwABAAAAFAAEACgAAAAGAAQAAQACACgAKf%2F%2FAAAAKAAp%2F%2F%2F%2F2f%2FZAAEAAAAAAAAAAAFUAFYBAAAsAKgDgAAyAAcAAAACAAAAKgDVA1UAAwAHAAA1MxEjEyMRM9XVq4CAKgMr%2FQAC1QABAAD%2B0AIgBtAACQBNGAGwChCwA9SwAxCwAtSwChCwBdSwBRCwANSwAxCwBzywAhCwCDwAsAoQsAPUsAMQsAfUsAoQsAXUsAoQsADUsAMQsAI8sAcQsAg8MTAREAEzABEQASMAAZCQ%2FnABkJD%2BcALQ%2FZD%2BcAGQAnACcAGQ%2FnAAAQAA%2FtACIAbQAAkATRgBsAoQsAPUsAMQsALUsAoQsAXUsAUQsADUsAMQsAc8sAIQsAg8ALAKELAD1LADELAH1LAKELAF1LAKELAA1LADELACPLAHELAIPDEwARABIwAREAEzAAIg%2FnCQAZD%2BcJABkALQ%2FZD%2BcAGQAnACcAGQ%2FnAAAQAAAAEAAPW2NYFfDzz1AAMIAP%2F%2F%2F%2F%2FVre7u%2F%2F%2F%2F%2F9Wt7u4AAP7QA7cG0AAAAAoAAgABAAAAAAABAAAHPv5OAAAXcAAA%2F%2F4DtwABAAAAAAAAAAAAAAAAAAAAAwDVAAACIAAAAiAAAAAAAAAAAAAkAAAAowAAASQAAQAAAAMACgACAAAAAAACAIAEAAAAAAAEAABNAAAAAAAAABUBAgAAAAAAAAABAD4AAAAAAAAAAAACAA4APgAAAAAAAAADAFwATAAAAAAAAAAEAD4AqAAAAAAAAAAFABYA5gAAAAAAAAAGAB8A%2FAAAAAAAAAAIABwBGwABAAAAAAABAD4AAAABAAAAAAACAA4APgABAAAAAAADAFwATAABAAAAAAAEAD4AqAABAAAAAAAFABYA5gABAAAAAAAGAB8A%2FAABAAAAAAAIABwBGwADAAEECQABAD4AAAADAAEECQACAA4APgADAAEECQADAFwATAADAAEECQAEAD4AqAADAAEECQAFABYA5gADAAEECQAGAB8A%2FAADAAEECQAIABwBGwBSAG8AdQBuAGQAIABiAHIAYQBjAGsAZQB0AHMAIAB3AGkAdABoACAAYQBzAGMAZQBuAHQAIAAxADgANQA0AFIAZQBnAHUAbABhAHIATQBhAHQAaABzACAARgBvAHIAIABNAG8AcgBlACAAUgBvAHUAbgBkACAAYgByAGEAYwBrAGUAdABzACAAdwBpAHQAaAAgAGEAcwBjAGUAbgB0ACAAMQA4ADUANABSAG8AdQBuAGQAIABiAHIAYQBjAGsAZQB0AHMAIAB3AGkAdABoACAAYQBzAGMAZQBuAHQAIAAxADgANQA0AFYAZQByAHMAaQBvAG4AIAAyAC4AMFJvdW5kX2JyYWNrZXRzX3dpdGhfYXNjZW50XzE4NTQATQBhAHQAaABzACAARgBvAHIAIABNAG8AcgBlAAAAAAMAAAAAAAADnwHPAAAAAAAAAAAAAAAAAAAAAAAAAAC5B%2F8AAY2FAA%3D%3D)format('truetype')%3Bfont-weight%3Anormal%3Bfont-style%3Anormal%3B%7D%3C%2Fstyle%3E%3C%2Fdefs%3E%3Ctext%20font-family%3D%22Times%20New%20Roman%22%20font-size%3D%2218%22%20text-anchor%3D%22middle%22%20x%3D%225.5%22%20y%3D%2216%22%3EP%3C%2Ftext%3E%3Ctext%20font-family%3D%22round_brackets18549f92a457f2409%22%20font-size%3D%2218%22%20text-anchor%3D%22middle%22%20x%3D%2213.5%22%20y%3D%2216%22%3E(%3C%2Ftext%3E%3Ctext%20font-family%3D%22round_brackets18549f92a457f2409%22%20font-size%3D%2218%22%20text-anchor%3D%22middle%22%20x%3D%2282.5%22%20y%3D%2216%22%3E)%3C%2Ftext%3E%3Ctext%20font-family%3D%22Times%20New%20Roman%22%20font-size%3D%2218%22%20text-anchor%3D%22middle%22%20x%3D%2220.5%22%20y%3D%2216%22%3E0%3C%2Ftext%3E%3Ctext%20font-family%3D%22math15ce32a8e0161ed97fec212618b%22%20font-size%3D%2216%22%20text-anchor%3D%22middle%22%20x%3D%2233.5%22%20y%3D%2216%22%3E%26%23x2264%3B%3C%2Ftext%3E%3Ctext%20font-family%3D%22Times%20New%20Roman%22%20font-size%3D%2218%22%20font-style%3D%22italic%22%20text-anchor%3D%22middle%22%20x%3D%2247.5%22%20y%3D%2216%22%3EX%3C%2Ftext%3E%3Ctext%20font-family%3D%22math15ce32a8e0161ed97fec212618b%22%20font-size%3D%2216%22%20text-anchor%3D%22middle%22%20x%3D%2263.5%22%20y%3D%2216%22%3E%26%23x2264%3B%3C%2Ftext%3E%3Ctext%20font-family%3D%22Times%20New%20Roman%22%20font-size%3D%2218%22%20font-style%3D%22italic%22%20text-anchor%3D%22middle%22%20x%3D%2275.5%22%20y%3D%2216%22%3Ea%3C%2Ftext%3E%3Ctext%20font-family%3D%22math15ce32a8e0161ed97fec212618b%22%20font-size%3D%2216%22%20text-anchor%3D%22middle%22%20x%3D%2294.5%22%20y%3D%2216%22%3E%3D%3C%2Ftext%3E%3Ctext%20font-family%3D%22Times%20New%20Roman%22%20font-size%3D%2218%22%20text-anchor%3D%22middle%22%20x%3D%22107.5%22%20y%3D%2216%22%3E0%3C%2Ftext%3E%3Ctext%20font-family%3D%22math15ce32a8e0161ed97fec212618b%22%20font-size%3D%2216%22%20text-anchor%3D%22middle%22%20x%3D%22114.5%22%20y%3D%2216%22%3E.%3C%2Ftext%3E%3Ctext%20font-family%3D%22Times%20New%20Roman%22%20font-size%3D%2218%22%20text-anchor%3D%22middle%22%20x%3D%22126.5%22%20y%3D%2216%22%3E09%3C%2Ftext%3E%3C%2Fsvg%3E)
Worked Example
The continuous random variable, X, has probability density function
format('truetype')%3Bfont-weight%3Anormal%3Bfont-style%3Anormal%3B%7D%40font-face%7Bfont-family%3A'brack_sm74a4ec520979a73b06ad972'%3Bsrc%3Aurl(data%3Afont%2Ftruetype%3Bcharset%3Dutf-8%3Bbase64%2CAAEAAAAMAIAAAwBAT1MvMi7PH4UAAADMAAAATmNtYXA3kjw6AAABHAAAAExjdnQgAQYDiAAAAWgAAAASZ2x5ZkyYQ7YAAAF8AAABLGhlYWQLyR8fAAACqAAAADZoaGVhAq0XCAAAAuAAAAAkaG10eDEjA%2FUAAAMEAAAAFGxvY2EAAEKZAAADGAAAABhtYXhwBJsEcQAAAzAAAAAgbmFtZW7QvZAAAANQAAAB5XBvc3QArQBVAAAFOAAAACBwcmVwu5WEAAAABVgAAAAHAAACDAGQAAUAAAQABAAAAAAABAAEAAAAAAAAAQEAAAAAAAAAAAAAAAAAAAAAAAAAAAAAAAAAAAAAACAgICAAAAAg9AMD%2FP%2F8AAABVAABAAAAAAACAAEAAQAAABQAAwABAAAAFAAEADgAAAAKAAgAAgACI6cjqCOpI6r%2F%2FwAAI6cjqCOpI6r%2F%2F9xa3FrcWtxaAAEAAAAAAAAAAAAAAAABVABUAQAAKwCMAIAAqAAHAAAAAgAAAAAA1QEBAAMABwAAMTMRIxcjNTPV1auAgAEB1qsAAQAAAAABAAFVAAcAIxgBsQAAP7EHAv2xAwf8sAQ8ALEAAD%2BwBzyxAwH2sQQE%2FTEwMTQ2NxUOARVrlWtAa8AqKivAQAAB%2F4AAAABVAVQACQAhGAGxBQA%2FsAE8sQYC%2FbAAPACxBQA%2FsAY8sQEBP7AAPDEwEyMUBxYVMzQnNlVVgIBVgIABVFVUVlVVVlQAAQAAAAABAAFUAAcAIxgBsQAAP7EHAv2xAwf8sAQ8ALEAAT%2BwBzyxAwH2sQQE%2FTEwERQWFzUuATVrlWtAAVRqwCorKcBAAAEAAAAAAFUBVAADACAYAbAEELAAPLADPLEBAvWwAjwAsAMvsAI8sQAB9bABPBEzESNVVQFU%2FqwAAQAAAAEAAIsesexfDzz1AAMEAP%2F%2F%2F%2F%2FVre5k%2F%2F%2F%2F%2F9Wt7mT%2FgP%2F%2FAdYBWAAAAAoAAgABAAAAAAABAAABVP%2F%2FAAAXcP%2BA%2F4AB1gABAAAAAAAAAAAAAAAAAAAABQDVAAABAAAAAQD%2FgAEAAAABAAAAAAAAAAAAACEAAABlAAAArgAAAPQAAAEsAAEAAAAFAAoAAgAAAAAAAgCABAAAAAAABAAAZQAAAAAAAAAVAQIAAAAAAAAAAQAmAAAAAAAAAAAAAgAOACYAAAAAAAAAAwBEADQAAAAAAAAABAAmAHgAAAAAAAAABQAWAJ4AAAAAAAAABgATALQAAAAAAAAACAAcAMcAAQAAAAAAAQAmAAAAAQAAAAAAAgAOACYAAQAAAAAAAwBEADQAAQAAAAAABAAmAHgAAQAAAAAABQAWAJ4AAQAAAAAABgATALQAAQAAAAAACAAcAMcAAwABBAkAAQAmAAAAAwABBAkAAgAOACYAAwABBAkAAwBEADQAAwABBAkABAAmAHgAAwABBAkABQAWAJ4AAwABBAkABgATALQAAwABBAkACAAcAMcAQgByAGEAYwBrAGUAdABzACAAcwBtAGEAbABsACAAcwBpAHoAZQBSAGUAZwB1AGwAYQByAE0AYQB0AGgAcwAgAEYAbwByACAATQBvAHIAZQAgAEIAcgBhAGMAawBlAHQAcwAgAHMAbQBhAGwAbAAgAHMAaQB6AGUAQgByAGEAYwBrAGUAdABzACAAcwBtAGEAbABsACAAcwBpAHoAZQBWAGUAcgBzAGkAbwBuACAAMgAuADBCcmFja2V0c19zbWFsbF9zaXplAE0AYQB0AGgAcwAgAEYAbwByACAATQBvAHIAZQAAAAADAAAAAAAAAKoAVQAAAAAAAAAAAAAAAAAAAAAAAAAAuQf%2FAAKNhQA%3D)format('truetype')%3Bfont-weight%3Anormal%3Bfont-style%3Anormal%3B%7D%40font-face%7Bfont-family%3A'round_brackets18549f92a457f2409'%3Bsrc%3Aurl(data%3Afont%2Ftruetype%3Bcharset%3Dutf-8%3Bbase64%2CAAEAAAAMAIAAAwBAT1MvMjwHLFQAAADMAAAATmNtYXDf7xCrAAABHAAAADxjdnQgBAkDLgAAAVgAAAASZ2x5ZmAOz2cAAAFsAAABJGhlYWQOKih8AAACkAAAADZoaGVhCvgVwgAAAsgAAAAkaG10eCA6AAIAAALsAAAADGxvY2EAAARLAAAC%2BAAAABBtYXhwBIgEWQAAAwgAAAAgbmFtZXHR30MAAAMoAAACOXBvc3QDogHPAAAFZAAAACBwcmVwupWEAAAABYQAAAAHAAAGcgGQAAUAAAgACAAAAAAACAAIAAAAAAAAAQIAAAAAAAAAAAAAAAAAAAAAAAAAAAAAAAAAAAAAACAgICAAAAAo8AMGe%2F57AAAHPgGyAAAAAAACAAEAAQAAABQAAwABAAAAFAAEACgAAAAGAAQAAQACACgAKf%2F%2FAAAAKAAp%2F%2F%2F%2F2f%2FZAAEAAAAAAAAAAAFUAFYBAAAsAKgDgAAyAAcAAAACAAAAKgDVA1UAAwAHAAA1MxEjEyMRM9XVq4CAKgMr%2FQAC1QABAAD%2B0AIgBtAACQBNGAGwChCwA9SwAxCwAtSwChCwBdSwBRCwANSwAxCwBzywAhCwCDwAsAoQsAPUsAMQsAfUsAoQsAXUsAoQsADUsAMQsAI8sAcQsAg8MTAREAEzABEQASMAAZCQ%2FnABkJD%2BcALQ%2FZD%2BcAGQAnACcAGQ%2FnAAAQAA%2FtACIAbQAAkATRgBsAoQsAPUsAMQsALUsAoQsAXUsAUQsADUsAMQsAc8sAIQsAg8ALAKELAD1LADELAH1LAKELAF1LAKELAA1LADELACPLAHELAIPDEwARABIwAREAEzAAIg%2FnCQAZD%2BcJABkALQ%2FZD%2BcAGQAnACcAGQ%2FnAAAQAAAAEAAPW2NYFfDzz1AAMIAP%2F%2F%2F%2F%2FVre7u%2F%2F%2F%2F%2F9Wt7u4AAP7QA7cG0AAAAAoAAgABAAAAAAABAAAHPv5OAAAXcAAA%2F%2F4DtwABAAAAAAAAAAAAAAAAAAAAAwDVAAACIAAAAiAAAAAAAAAAAAAkAAAAowAAASQAAQAAAAMACgACAAAAAAACAIAEAAAAAAAEAABNAAAAAAAAABUBAgAAAAAAAAABAD4AAAAAAAAAAAACAA4APgAAAAAAAAADAFwATAAAAAAAAAAEAD4AqAAAAAAAAAAFABYA5gAAAAAAAAAGAB8A%2FAAAAAAAAAAIABwBGwABAAAAAAABAD4AAAABAAAAAAACAA4APgABAAAAAAADAFwATAABAAAAAAAEAD4AqAABAAAAAAAFABYA5gABAAAAAAAGAB8A%2FAABAAAAAAAIABwBGwADAAEECQABAD4AAAADAAEECQACAA4APgADAAEECQADAFwATAADAAEECQAEAD4AqAADAAEECQAFABYA5gADAAEECQAGAB8A%2FAADAAEECQAIABwBGwBSAG8AdQBuAGQAIABiAHIAYQBjAGsAZQB0AHMAIAB3AGkAdABoACAAYQBzAGMAZQBuAHQAIAAxADgANQA0AFIAZQBnAHUAbABhAHIATQBhAHQAaABzACAARgBvAHIAIABNAG8AcgBlACAAUgBvAHUAbgBkACAAYgByAGEAYwBrAGUAdABzACAAdwBpAHQAaAAgAGEAcwBjAGUAbgB0ACAAMQA4ADUANABSAG8AdQBuAGQAIABiAHIAYQBjAGsAZQB0AHMAIAB3AGkAdABoACAAYQBzAGMAZQBuAHQAIAAxADgANQA0AFYAZQByAHMAaQBvAG4AIAAyAC4AMFJvdW5kX2JyYWNrZXRzX3dpdGhfYXNjZW50XzE4NTQATQBhAHQAaABzACAARgBvAHIAIABNAG8AcgBlAAAAAAMAAAAAAAADnwHPAAAAAAAAAAAAAAAAAAAAAAAAAAC5B%2F8AAY2FAA%3D%3D)format('truetype')%3Bfont-weight%3Anormal%3Bfont-style%3Anormal%3B%7D%3C%2Fstyle%3E%3C%2Fdefs%3E%3Ctext%20font-family%3D%22Times%20New%20Roman%22%20font-size%3D%2218%22%20font-style%3D%22italic%22%20text-anchor%3D%22middle%22%20x%3D%223.5%22%20y%3D%2233%22%3Ef%3C%2Ftext%3E%3Ctext%20font-family%3D%22round_brackets18549f92a457f2409%22%20font-size%3D%2218%22%20text-anchor%3D%22middle%22%20x%3D%2212.5%22%20y%3D%2233%22%3E(%3C%2Ftext%3E%3Ctext%20font-family%3D%22round_brackets18549f92a457f2409%22%20font-size%3D%2218%22%20text-anchor%3D%22middle%22%20x%3D%2227.5%22%20y%3D%2233%22%3E)%3C%2Ftext%3E%3Ctext%20font-family%3D%22Times%20New%20Roman%22%20font-size%3D%2218%22%20font-style%3D%22italic%22%20text-anchor%3D%22middle%22%20x%3D%2219.5%22%20y%3D%2233%22%3Ex%3C%2Ftext%3E%3Ctext%20font-family%3D%22math1a3e9e66d3b0fb1281f7814e8d5%22%20font-size%3D%2216%22%20text-anchor%3D%22middle%22%20x%3D%2239.5%22%20y%3D%2233%22%3E%3D%3C%2Ftext%3E%3Ctext%20font-family%3D%22brack_sm74a4ec520979a73b06ad972%22%20font-size%3D%2218%22%20text-anchor%3D%22start%22%20x%3D%2251.5%22%20y%3D%2213%22%3E%26%23x23A7%3B%3C%2Ftext%3E%3Ctext%20font-family%3D%22brack_sm74a4ec520979a73b06ad972%22%20font-size%3D%2218%22%20text-anchor%3D%22start%22%20x%3D%2251.5%22%20y%3D%2219%22%3E%26%23x23AA%3B%3C%2Ftext%3E%3Ctext%20font-family%3D%22brack_sm74a4ec520979a73b06ad972%22%20font-size%3D%2218%22%20text-anchor%3D%22start%22%20x%3D%2251.5%22%20y%3D%2225%22%3E%26%23x23AA%3B%3C%2Ftext%3E%3Ctext%20font-family%3D%22brack_sm74a4ec520979a73b06ad972%22%20font-size%3D%2218%22%20text-anchor%3D%22start%22%20x%3D%2251.5%22%20y%3D%2231%22%3E%26%23x23A8%3B%3C%2Ftext%3E%3Ctext%20font-family%3D%22brack_sm74a4ec520979a73b06ad972%22%20font-size%3D%2218%22%20text-anchor%3D%22start%22%20x%3D%2251.5%22%20y%3D%2237%22%3E%26%23x23AA%3B%3C%2Ftext%3E%3Ctext%20font-family%3D%22brack_sm74a4ec520979a73b06ad972%22%20font-size%3D%2218%22%20text-anchor%3D%22start%22%20x%3D%2251.5%22%20y%3D%2243%22%3E%26%23x23AA%3B%3C%2Ftext%3E%3Ctext%20font-family%3D%22brack_sm74a4ec520979a73b06ad972%22%20font-size%3D%2218%22%20text-anchor%3D%22start%22%20x%3D%2251.5%22%20y%3D%2249%22%3E%26%23x23A9%3B%3C%2Ftext%3E%3Ctext%20font-family%3D%22Times%20New%20Roman%22%20font-size%3D%2218%22%20text-anchor%3D%22middle%22%20x%3D%2265.5%22%20y%3D%2219%22%3E0%3C%2Ftext%3E%3Ctext%20font-family%3D%22math1a3e9e66d3b0fb1281f7814e8d5%22%20font-size%3D%2216%22%20text-anchor%3D%22middle%22%20x%3D%2272.5%22%20y%3D%2219%22%3E.%3C%2Ftext%3E%3Ctext%20font-family%3D%22Times%20New%20Roman%22%20font-size%3D%2218%22%20text-anchor%3D%22middle%22%20x%3D%2284.5%22%20y%3D%2219%22%3E08%3C%2Ftext%3E%3Ctext%20font-family%3D%22Times%20New%20Roman%22%20font-size%3D%2218%22%20font-style%3D%22italic%22%20text-anchor%3D%22middle%22%20x%3D%2297.5%22%20y%3D%2219%22%3Ex%3C%2Ftext%3E%3Ctext%20font-family%3D%22Times%20New%20Roman%22%20font-size%3D%2218%22%20text-anchor%3D%22middle%22%20x%3D%22122.5%22%20y%3D%2219%22%3E0%3C%2Ftext%3E%3Ctext%20font-family%3D%22math1a3e9e66d3b0fb1281f7814e8d5%22%20font-size%3D%2216%22%20text-anchor%3D%22middle%22%20x%3D%22135.5%22%20y%3D%2219%22%3E%26%23x2264%3B%3C%2Ftext%3E%3Ctext%20font-family%3D%22Times%20New%20Roman%22%20font-size%3D%2218%22%20font-style%3D%22italic%22%20text-anchor%3D%22middle%22%20x%3D%22147.5%22%20y%3D%2219%22%3Ex%3C%2Ftext%3E%3Ctext%20font-family%3D%22math1a3e9e66d3b0fb1281f7814e8d5%22%20font-size%3D%2216%22%20text-anchor%3D%22middle%22%20x%3D%22161.5%22%20y%3D%2219%22%3E%26%23x2264%3B%3C%2Ftext%3E%3Ctext%20font-family%3D%22Times%20New%20Roman%22%20font-size%3D%2218%22%20text-anchor%3D%22middle%22%20x%3D%22173.5%22%20y%3D%2219%22%3E5%3C%2Ftext%3E%3Ctext%20font-family%3D%22Times%20New%20Roman%22%20font-size%3D%2218%22%20text-anchor%3D%22middle%22%20x%3D%2265.5%22%20y%3D%2245%22%3E0%3C%2Ftext%3E%3Ctext%20font-family%3D%22Times%20New%20Roman%22%20font-size%3D%2218%22%20text-anchor%3D%22middle%22%20x%3D%22153.5%22%20y%3D%2245%22%3Eotherwise%3C%2Ftext%3E%3C%2Fsvg%3E)
a) Show that f(x) is a valid probability density function.
Answer:
b) Find, both geometrically and using integration, P(0 ≤ X ≤ 2).
Answer:
c) Write down P(X = 3.2).
Answer:


Unlock more, it's free!
Join the 100,000+ Students that ❤️ Save My Exams
the (exam) results speak for themselves:

Was this revision note helpful?
