Causes of Climate Change (DP IB Environmental Systems & Societies (ESS)): Revision Note

Anthropogenic influence on climate
Human activities have significantly increased atmospheric concentrations of greenhouse gases since the Industrial Revolution
Particularly carbon dioxide emissions from burning fossil fuels
This has led to:
Global warming: average global temperatures have risen due to enhanced greenhouse effect
Climate change: altered weather patterns, sea level rise and impacts on ecosystems and human societies
Global rate of emissions
Since 1950, the rate of anthropogenic carbon dioxide emissions has significantly accelerated
This acceleration is due to several factors, including:
Industrial Revolution:
It began in the late 18th century in Europe
Marked a turning point with the widespread use of fossil fuels such as coal and later oil
Technological advancements:
The 20th century saw rapid industrialisation, transportation development and urbanisation
These all contributed to increased emissions
Population growth:
The global population has increased exponentially
This has increased demand for energy and resources, further accelerating emissions
Analysis of ice cores, tree rings and sediments
Ice cores, tree rings and sediment deposits provide important data for understanding:
Historical climate patterns
The relationship between carbon dioxide levels and global temperatures
Ice cores:
Layers of ice in glaciers trap air bubbles containing the gases from ancient atmospheres
Analysis of these bubbles shows historical carbon dioxide levels
Ice is deposited as water freezes over time, so the deeper into the ice you go, the older it is

Tree rings:
Trees form annual rings with varying widths based on climate conditions
Thicker rings indicate favourable (warmer) conditions, potentially linked to higher carbon dioxide levels
Analysis of the width of tree rings can provide a measure of climate during each year of growth
Taking cores from the trunks of older trees can provide samples that go back over hundreds of years

Sediments:
Deposits in lakes and oceans contain remains of organisms sensitive to environmental changes
This provides indirect evidence of past climates
Positive correlation between carbon dioxide and global temperatures
Research using data from these sources shows a clear positive correlation between atmospheric carbon dioxide concentrations and global temperatures
Carbon dioxide levels: as industrial activities have increased, so have atmospheric carbon dioxide levels
Temperature records: proxy data from ice cores, tree rings and other sources indicates that periods with higher carbon dioxide concentrations correspond to warmer global temperatures
Modern instrumental records: direct measurements since the mid-20th century confirm a sharp rise in temperatures, aligning with increased emissions
Since the Industrial Revolution, atmospheric carbon dioxide levels have risen to their highest in Earth's history
Before, the highest atmospheric carbon dioxide concentration was around 300 parts per million (ppm)
It is currently above 400 ppm

Data show a correlation between changing atmospheric carbon dioxide levels and temperature over thousands of years
Correlation does not equal causation
However, this is convincing evidence supporting the hypothesis that carbon dioxide emissions from human activity are driving up global temperatures

Average global temperatures
Thermometers can be used to measure air temperature
Records from the mid-1800s show an overall trend of increasing average global temperatures
There are some short time periods within this window during which temperatures have declined, but the overall trend is upward
The time period since the mid-1800s corresponds with the time during which humans have been burning fossil fuels

90% of global carbon dioxide emissions come from industry and burning fossil fuels
As carbon dioxide, methane and water vapour are released, they act as greenhouse gases and trap heat within the Earth’s atmosphere
Human activities are responsible for almost all of the increase in greenhouse gases in the atmosphere over the last 150 years

The enhanced greenhouse effect
The enhanced greenhouse effect is different from the natural greenhouse effect
It is the result of human activities that release excessive greenhouse gases into the atmosphere
This leads to an intensified trapping of heat and results in global warming
The natural greenhouse effect is a necessary process
It helps regulate the Earth's temperature by trapping some heat to maintain a habitable climate
The enhanced greenhouse effect disrupts this balance as a result of greenhouse gas concentrations being artificially increased beyond natural levels

Modelling climate change
Systems diagrams and models
Representing cause and effect:
Systems diagrams and models are tools that can be used to visualise how different factors interact and cause climate change
They help us understand cause-and-effect relationships and how changes in one part of the system affect others
Feedback loops
Feedback loops are processes that can either amplify or dampen the effects of climate change
Positive feedback loops amplify changes
Negative feedback loops reduce or counteract changes
Global energy balance:
The global energy balance is the balance between the energy Earth receives from the Sun and the energy it radiates back into space
Changes in this balance can significantly impact the climate
Changes in solar radiation and terrestrial albedo
Solar radiation is the primary source of energy for Earth's climate system
Variations in solar radiation can lead to changes in climate
For example, the Maunder Minimum (1645–1715), a period with very few sunspots, was associated with cooler global temperatures
Changes in solar radiation can initiate feedback loops
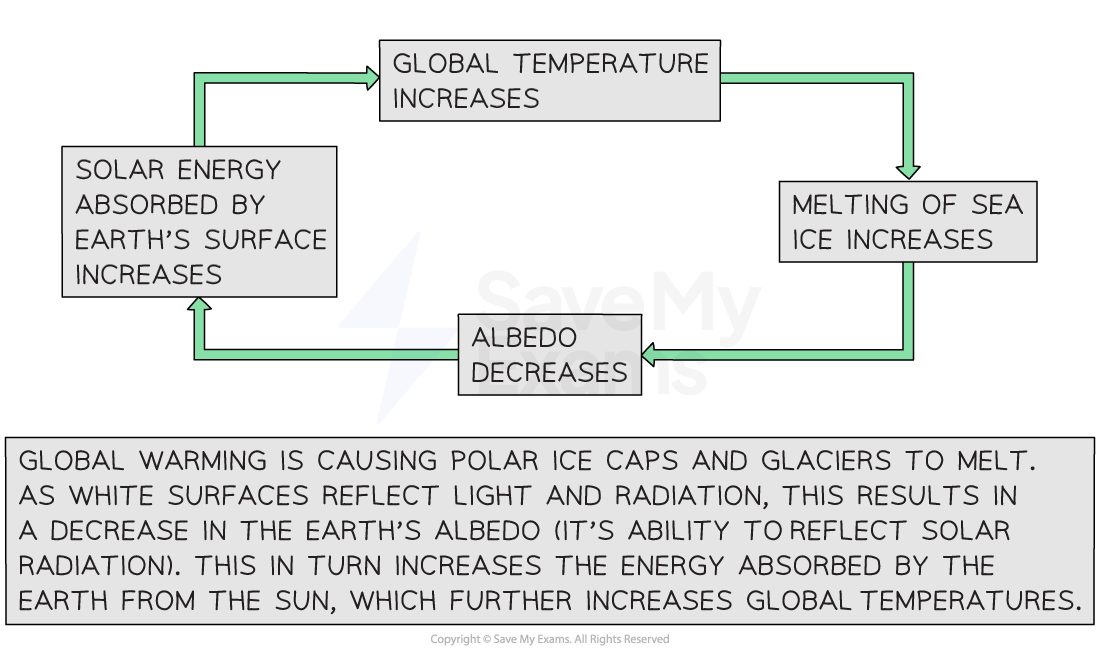
Decrease in solar radiation: can cause cooling, leading to an increase in snow and ice cover
This increases the Earth's albedo, causing further cooling (negative feedback loop)
For example, during the Maunder Minimum, reduced solar radiation contributed to the Little Ice Age
Increase in solar radiation: can cause warming, reducing snow and ice cover
This decreases the Earth's albedo, causing further warming (positive feedback loop)
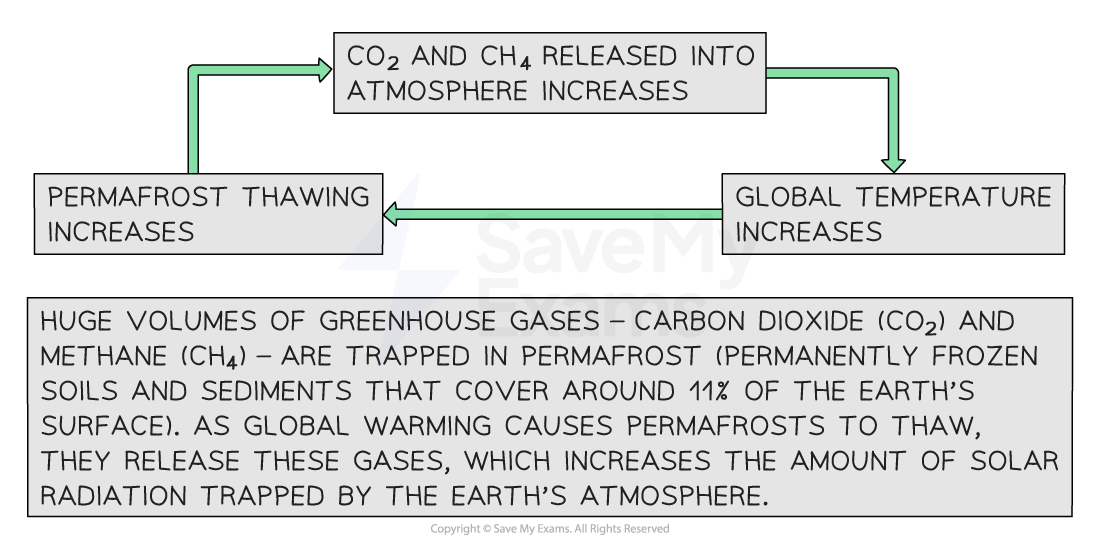
Carbon dioxide and methane release
Carbon dioxide and methane are greenhouse gases
Carbon dioxide and methane get trapped in permafrost as organic matter freezes before it can fully decompose
Positive feedback loop:
When the permafrost thaws due to warming temperatures, these trapped gases are released into the atmosphere
These greenhouse gases then contribute to further global warming and climate change
Crossing the planetary boundary for climate change
Climate change is one of the nine planetary boundaries outlined by the planetary boundaries model
Planetary boundaries are thresholds that lead to significant environmental changes if they are crossed
Evidence suggests Earth has already crossed the boundary for climate change
The Intergovernmental Panel on Climate Change (IPCC) is a leading authority on climate science
IPCC reports provide comprehensive assessments of climate change, based on the latest scientific research
These reports show:
Significant increases in global temperatures:
Over the past century, the average global temperature has risen by approximately 1.1 °C
The most rapid warming has occurred in recent decades
Rising greenhouse gas concentrations:
Levels of carbon dioxide and methane in the atmosphere have increased dramatically
Due to human activities like burning fossil fuels, deforestation and agriculture,
Current impacts:
These changes contribute to more frequent and intense extreme weather events, such as heatwaves, storms and flooding
As well as long-term effects like rising sea levels and shifting ecosystems
Examiner Tips and Tricks
Make sure you are clear on the difference between positive and negative feedback loops and how they impact the climate. It can be easy to get the two types of feedback confused!
It might help to remember it this way—when it comes to climate, it is often the opposite to how it sounds: positive feedback is often a negative thing, as it leads to extremes, whereas negative feedback is often a positive thing, as it counteracts changes and brings them back to equilibrium.

Unlock more, it's free!
Join the 100,000+ Students that ❤️ Save My Exams
the (exam) results speak for themselves:

Was this revision note helpful?
