Studying Populations (DP IB Environmental Systems & Societies (ESS)): Revision Note

Sampling strategies
Populations and samples

What is a population?
A population refers to the whole set of things that you are interested in
e.g. if a teacher wanted to know how long pupils in year 11 at their school spent revising each week then the population would be all the year 11 pupils at the school
Population does not necessarily refer to a number of people or animals
e.g. if an IT expert wanted to investigate the speed of mobile phones then the population would be all the different makes and models of mobile phones in the world
What is a sample?
A sample refers to a selected part (i.e. a subset) of the population that data is collected from
e.g. for the teacher investigating year 11 revision times, a sample would be a certain number of pupils from year 11
A random sample is where every item in the population has an equal chance of being selected
e.g. every pupil in year 11 would have the same chance of being selected for the teacher's sample
A biased sample is where the sample is not random
e.g. the teacher asks pupils from just one class
What are the advantages and disadvantages of using a population?
You may see or hear the word census - this is when data is collected from every member of the whole population
The advantages of using a population include:
Accurate results - as every member/item of the population is used
All options/opinions/responses will be included in the results
The disadvantages of using a population include:
Time consuming to collect the data
Expensive due to the large numbers involved
Large amounts of data to organise and analyse
What are the advantages and disadvantages of using a sample?
The advantages of using a sample include:
Quicker to collect the data
Cheaper as not so much work involved
Less data to organise and analyse
The disadvantages of using a sample include:
A small sample size can lead to unreliable results
Sampling methods can usually be improved by taking a larger sample size
A sample can introduce bias
Particularly if the sample is not random
A sample might not be representative of the population
Only a selection of options/opinions/responses might be accounted for
The members/items used in the sample may all have similar responses
e.g. even with a random sample, it may be possible that the teacher happens to select pupils for their sample who all happen to do very little revision
It is important to recognise that different samples (from the same population) may produce different results
Random and systematic sampling strategies

There are two different types of sampling:
Random
Systematic
In random sampling, the positions of the sampling points are completely random or due to chance
For example, sampling points can be selected using a random number generator to create a set of random coordinates
This method is beneficial because it means there will be no bias by the person who is carrying out the sampling that may affect the results (i.e. there will be no researcher bias)
Random sampling can be used when the population size or the individual sample size is relatively small, and all individuals have an equal chance of being sampled
In systematic sampling, the positions of the sampling points are chosen by the person carrying out the sampling and a regular pattern is used to select sample points
There is a possibility that the person choosing could show bias towards or against certain areas
Individuals may deliberately place the quadrats in areas with the least species as these will be easier and quicker to count
This is unrepresentative of the whole area
When a sampling area is reasonably uniform or has no clear pattern to the way the species are distributed, random sampling is the best choice
Transect sampling
Systematic sampling allows researchers to investigate the effect of the presence of certain environmental features on species distribution e.g. by taking samples along a line that extends away from, or along, an environmental feature, such as a river
A line of this type is known as a transect
Transect sampling is used when there is a clear change in the physical conditions across the area being studied
For example, there may be changes in altitude, soil pH or light intensity
Methods using transects can help show how species distribution changes with the different physical conditions in the area
A transect is a line represented by a measuring tape, along which samples are taken
For a line transect:
Lay out a measuring tape in a straight line across the sample area
At equal distances along the tape, record the identity of the organisms that touch the line (e.g. every 2 m)
For a belt transect:
Place quadrats at regular intervals along the tape and record the abundance or percentage cover of each species within each quadrat
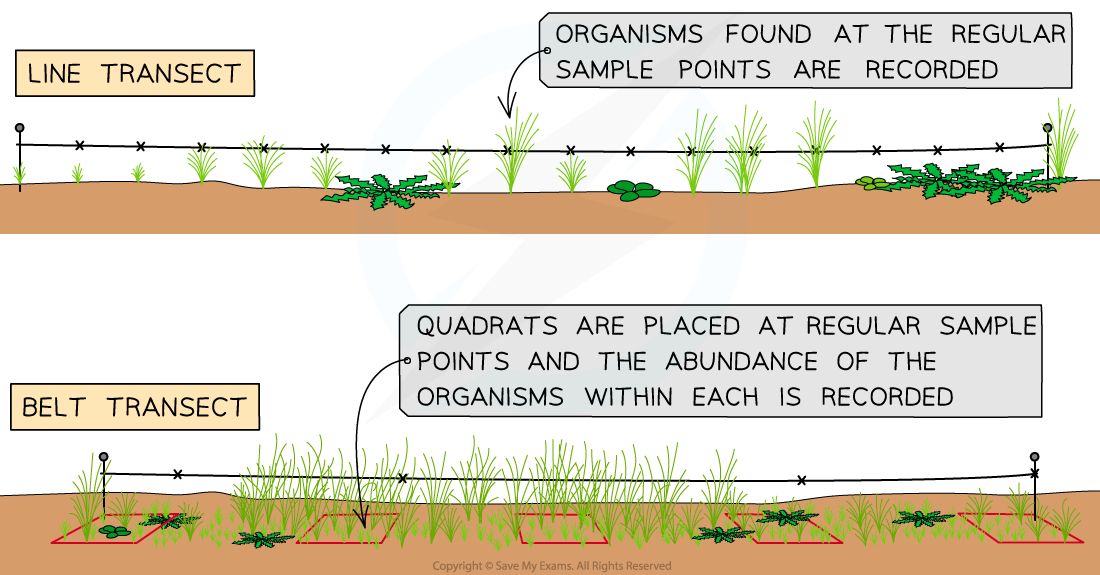
A line transect and belt transect is carried out in a habitat

Quadrat sampling
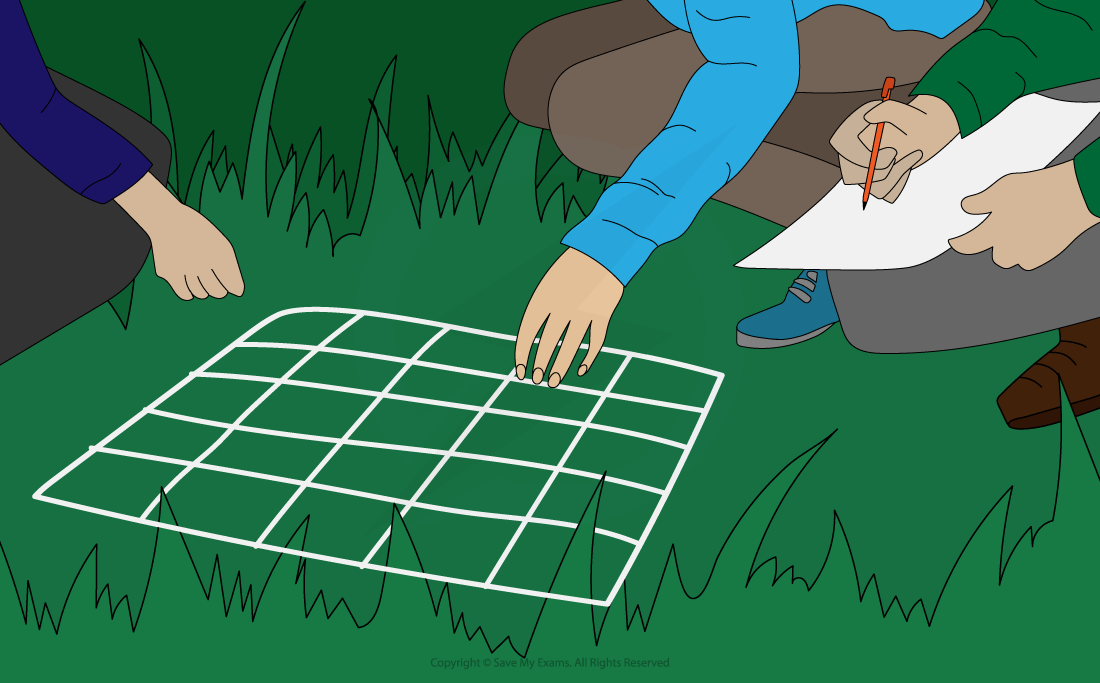
Quadrats are square frames made of wood or wire
They can be a variety of sizes e.g. 0.25 m2 or 1 m2
They are placed on the ground and the organisms within them are recorded
Non-motile organisms such as plant species are commonly studied using random quadrat sampling to estimate their population size
Quadrats can be used to estimate population size by recording:
The number of an individual species: the total number of individuals of a single species (e.g. daisies) is recorded
Percentage cover: the approximate percentage of the quadrat area in which an individual species is found is recorded (this method is often used when it is difficult to count individuals of the plant species being recorded eg. grass or moss)
Estimating population size
Quadrats must be laid randomly in the area to avoid sampling bias
This random sampling can be done by converting the sampling area into a grid format and labelling each square on the grid with a number
Then a random number generator is used to pick the sample points
Once the quadrat has been laid on the chosen sample point the abundance of all the different species present can be recorded


Estimating percentage cover and percentage frequency
Percentage cover is an estimate of the area within a given quadrat covered by the plant or animal being sampled
Percentage frequency is the number of squares in which the species occurs divided by the number of possible occurrences
% frequency = (number of quadrat squares in which species present ÷ total number of quadrat squares) × 100
This can be useful, as it can sometimes be difficult to count individual plants or organisms within a quadrat
For example, if grass is found in 89 out of 100 squares in the quadrat then it has a percentage frequency of 89%
This process could be repeated for a series of quadrats within a given sample area
This information could then be used to calculate the average percentage cover across all the sampled quadrats
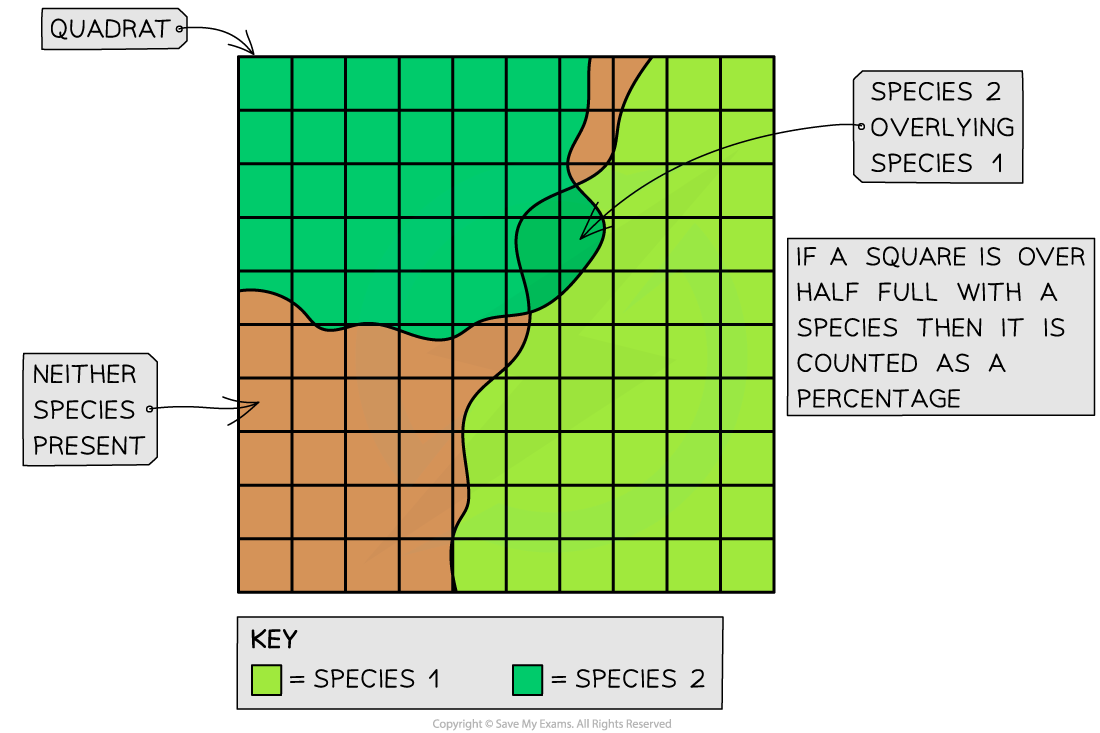
Using a quadrat to investigate percentage cover of two species of grass—there may be some squares lacking any species and other squares with multiple species

Examiner Tips and Tricks
It is important to note that percentage cover and frequency give an estimate of abundance but not actual population size.
Capture–mark–release–recapture & the Lincoln index
The sampling methods described above are only useful for non-motile (sessile) organisms
Different methods are required for estimating the number of individuals in a population of motile animals (i.e. animals that are mobile)
The capture-mark-release-recapture method is commonly used alongside the Lincoln index (a statistical measure used to estimate population size)
The Lincoln index can be used to estimate the abundance or population size of a species in a given area
First, the capture-mark-release-recapture technique is carried out
For a single species in the area:
The first large sample is taken—as many individuals as possible are caught, counted and marked in a way that won’t affect their survival e.g. if studying a species of beetle, a small amount of brightly coloured non-toxic paint can be applied to their carapace (shell)
The marked individuals are returned to their habitat and allowed to randomly mix with the rest of the population
When a sufficient amount of time has passed another large sample is captured
The number of marked and unmarked individuals within the sample are counted
The proportion of marked to unmarked individuals is used to calculate an estimate of the population size (the Lincoln index)
The formula for calculating the Lincoln index is:
Population size estimate = (M × N) ÷ R
Where:
M = number of individuals caught in the first sample (i.e. number of marked individuals released)
N = number of marked and unmarked individuals caught in the second sample (i.e. total number of individuals recaptured)
R = number of marked individuals in the second sample (i.e. number of marked individuals recaptured)
Worked Example
Scientists wanted to investigate the abundance of leafhoppers in a small grassy meadow. They used sweep nets to catch a large sample of leafhoppers from the meadow. Each insect was marked on its underside with non-toxic waterproof paint and then released back into the meadow. The following day another large sample was caught using sweep nets. Use the figures below to estimate the size of the leafhopper population in this meadow.
Number caught and marked in first sample (M) = 236
Number caught in second sample (N) = 244
Number of marked individuals in the second sample (R) = 71
Answer
Step One: Write out the equation and substitute in the known values
N = (M × N) ÷ R
N = (236 × 244) ÷ 71
Step Two: Calculate the population size estimate (N)
N = 57 584 ÷ 71
N = 811
Estimated population size = 811
Limitations of using the capture-mark-release-recapture method
When using the mark-release-capture method, there are a few assumptions that have to be made:
The marked individuals must be given sufficient time to disperse and mix back in fully with the main population - this can be time-consuming
The marking doesn't affect the survival rates of the marked individuals (e.g. doesn't make them more visible and therefore more likely to be predated)
The marking remains visible throughout the sampling and doesn't rub off - this is often difficult to ensure and so the accuracy of population size estimates may be negatively affected
The population stays the same size during the study period (i.e. there are no significant changes in population size due to births and deaths and there are no migrations into or out of the main population) - again, this is almost impossible to ensure, further affecting the accuracy of population size estimates

Unlock more, it's free!
Join the 100,000+ Students that ❤️ Save My Exams
the (exam) results speak for themselves:

Was this revision note helpful?
