How Fast? The Rate of Chemical Change (DP IB Chemistry: HL): Exam Questions

7 hours99 questions
1a
2 marks

Describe kinetic theory in relation to energy and temperature.

1b
2 marks

State what is required for a collision to result in a reaction.

1c
2 marks

State the meaning of activation energy (Ea).

1d
1 mark

Label the activation energy on the energy profile diagram below.

6-1-ib-sl-sq-easy-q1d-energy-profile-diagram
2a
3 marks

State three ways of monitoring concentration changes in a reaction.

2b
1 mark

A reaction is monitored by measuring the volume of a gas produced every 10 seconds. State an appropriate unit to use.

2c
4 marks

Sketch a graph to show the volume of gas produced during the course of an experiment against the time taken.

2d
1 mark

State the effect that increasing concentration has on the rate of a reaction.

3a
1 mark

State the effect that increasing temperature has on the rate of a reaction.

3b
3 marks

Sketch a line on the graph to show the same reaction occurring at a higher temperature.

6-1-ib-sl-sq-easy-q4d-rate-of-reaction-graph-sketch
3c
2 marks

State two variables that need to be controlled when investigating the effect of temperature on rate in the following reaction:

2HCl (aq) + Mg (s) rightwards arrowMgCl2 (aq) + H2 (g)

3d
1 mark

Suggest an appropriate piece of equipment to use to measure the volume of H2 gas produced in the reaction between HCl and Mg.

4a
2 marks

Sketch a line on the potential energy profile diagram to show the pathway for the same reaction, but with a catalyst.

6-1-ib-sl-sq-easy-q1d-energy-profile-diagram
4b
3 marks

Explain how catalysts work.

4c
2 marks

 Maxwell-Boltzmann distribution is shown below.

6-1-ib-sl-sq-easy-q4c-maxwell-boltzmann-curve

i) Draw a line on the Maxwell-Boltzmann curve below to show the effect of adding a catalyst.

[1]

ii) Shade in the area representing the number of particles that can react with the catalyst present.

[1]

4d
3 marks

Sketch a line on the graph to show the same reaction occurring with a catalyst.

6-1-ib-sl-sq-easy-q4d-rate-of-reaction-graph-sketch
5a
2 marks

Outline two ways a rate of a reaction can be expressed and state the units for rate of reaction.

5b
2 marks

Explain what is meant by the order of a reaction and how it may be determined.

5c
1 mark

Carbon monoxide and chlorine react together to make phosgene, COCl2. The equation for the reaction is given below:

CO (g) + Cl2 (g) → COCl2 ( g)

A possible rate equation for the reaction is:

rate = k[CO (g)]2[Cl2 (g)]½

What is the overall reaction order?

5d
1 mark

Determine the units of the rate constant, k, for the following rate equation:

rate = k[NO]2[O2]

6a
Sme Calculator
1 mark

The rate of hydrolysis of sucrose under acidic conditions can be determined experimentally. The following data was obtained:

Experiment

Initial [HCl] / mol dm-3

Initial [sucrose] / mol dm-3

Rate of reaction / mol dm-3 s-1

1

0.10

0.10

0.024

2

0.10

0.15

0.036

3

0.20

0.10

0.048

Determine the order of reaction with respect to HCl.

6b
Sme Calculator
1 mark

Determine the order of reaction with respect to sucrose.

6c
Sme Calculator
3 marks

Determine the overall order of reaction, write the rate expression and state the units of the rate constant, k.

6d
Sme Calculator
2 marks

Determine the following:

i) The value of k, using Experiment 1

[1]

ii) The rate of reaction if the concentration of HCl and sucrose are both 0.20 mol dm-3

[1]

7a
2 marks

Sketch two labelled graphs to show the change in concentration of a reactant over time for a typical first-order and second-order reaction.

7b
2 marks

Sketch two labelled graphs to show how the initial rate of reaction varies with initial reactant concentration for a first-order and a second-order reaction.

7c
1 mark

Deduce the units of the rate constant, k, for a first order reaction.

7d
2 marks

State, with a reason, how the value of the rate constant, k, varies with increased temperature for a reaction.

8a
2 marks

State what is meant by the terms rate determining step and molecularity in a chemical reaction.

8b
2 marks

The following reaction mechanism has been proposed for the formation of nitrosyl bromide, NOBr, from nitrogen monoxide and bromine:

Step 1: NO + NO → N2O2

Step 2:  N2O2 + Br2 → 2NOBr

Deduce the overall reaction equation and comment on the molecularity of Step 1 and 2.

8c
2 marks

A student proposes an alternative one step mechanism for the formation of nitrosyl bromide.

NO + NO + Br2  → NOBr2

Explain why this mechanism is not likely to take place.

8d
1 mark

State the role of N2O2 in the mechanism in part b).

9a
3 marks

Chemists are investigating the mechanism for the reaction between nitrogen dioxide and carbon monoxide. The overall reaction is:

NO2 (g) + CO (g) → NO (g) + CO2 (g)

One proposed mechanism is a two-step process where the second step is the rate-determining step and the overall reaction is exothermic.

On the axes provided, sketch a potential energy profile consistent with this proposed mechanism.

ib-hl-16-1-e-rate-expression--reaction-mechanism-q5a
9b
1 mark

If a catalyst were found for the mechanism in part (a), state which step it would primarily affect.

9c
2 marks

An alternative mechanism is proposed:

Step 1: NO2 + NO2  →  NO + NO (slow)

Step 2: NO3 + CO →  NO2 + CO2 ( fast)

Deduce the overall reaction equation and the rate equation for the reaction.

9d
2 marks

State the overall reaction order in part c) and state the units of the rate constant.

10a
7 marks

The Arrhenius equation can be written as:

k space equals A e to the power of fraction numerator negative E subscript a over denominator R T end fraction end exponent

State what each of the following terms represents, including units where applicable.

  • A

  • Ea

  • R

  • T

10b
1 mark

Rearrange the Arrhenius equation given in part (a) to make A the subject.

10c
1 mark

State how the rate constant, varies with temperature, T.

10d
1 mark

State how the rate constant, k, varies with activation energy, Ea.

11a
3 marks

The Arrhenius equation can also be written in natural logarithmic forms.

ln k = ln A - fraction numerator E subscript a over denominator R T end fraction

A plot of ln k against 1 over T gives a straight-line graph of the type y = mx + c.

Complete the table below which relates the terms from the natural logarithmic Arrhenius equation to the equation of a straight line.

Straight-line term

Arrhenius term

y

ln k 

m


x


c


11b
Sme Calculator
2 marks

A graph of ln k against 1 over T is shown below.

arrhenius-graph

 Calculate the gradient of the straight line.

11c
Sme Calculator
1 mark

Using section 2 of the data booklet, calculate the activation energy, Ea for the graph in part b).

11d
Sme Calculator
2 marks

Calculate the frequency factor, A, for the graph in part b) to 2 decimal places.

12a
1 mark

Arrhenius plots for two reactions with different activation energies are shown below.

arrhenius-graph-question-

State which plot shows the reaction with the greatest activation energy.

12b
1 mark

The temperature of both reactions from part a) is increased from 20° to 45°.

Using section 1 of the data booklet, determine which of the reactions will experience the largest change in the rate of reaction.

1a
4 marks

In any chemical reaction, the particles will all be moving around in different directions, at different speeds, with different amounts of energy.

A Maxwell-Boltzmann distribution is a graph which shows the distribution of energy amongst particles within a chemical reaction. 

Figure 1 below shows the Maxwell-Boltzmann distribution in a sample of a gas at a fixed temperature, T1

Figure 1

RTYjz6v0_1

i) Label the x and y axes of the graph.

[2]

ii) Sketch a distribution for this same sample of gas, at a higher temperature, and label it as T2.

[2]

1b
2 marks

State why a Maxwell-Boltzmann distribution curve always starts at the origin and what the area under the curve represents.

1c
3 marks

Chemical reactions take place at different speeds. For a chemical reaction to take place, particles must collide with each other in the correct orientation and with sufficient energy. 

i) Explain why most collisions between particles in the gas phase do not result in a reaction taking place.

[1]

ii) State and explain one way that the rate of reaction could be increased, other than by increasing the temperature.

[2]

1d
1 mark

Give one reason why a reaction may be slow at room temperature.

2a
1 mark

A student investigates the reaction between solid A and aqueous solution B:

A (s) + B (aq) → C (g)

In the first experiment, B was the limiting reagent. The volume of gas C was collected over time, as shown by the solid line in the graph below.

rUppbj5Q_2

Define the term rate of reaction.

2b
1 mark

Explain what is indicated by the horizontal section of the graph, labelled R.

2c
2 marks

On the graph, sketch the curve that would be obtained if the experiment were repeated using double the concentration of solution B, with all other conditions kept the same.

rUppbj5Q_2
2d
2 marks

Explain why the gradient of the original curve decreases over time.

2e
2 marks

Explain, using collision theory, why a small increase in temperature has a large effect on the rate of reaction.

3a
1 mark

The rate of the slow decomposition of aqueous hydrogen peroxide can be investigated by measuring the volume of oxygen gas produced over time. A catalyst, such as manganese(IV) oxide, is often used.

Write the balanced chemical equation for the decomposition of hydrogen peroxide.

3b
2 marks

Draw a labelled diagram of the assembled apparatus suitable for collecting and measuring the volume of oxygen produced at regular time intervals. 

3c
3 marks

Explain how the initial rate of reaction could be determined from the experimental results

3d
1 mark

The graph shown below represents the decomposition of hydrogen peroxide.

Figure 1

question-3d-figure-1

Explain why the rate of reaction decreases as the reaction proceeds.

3e
4 marks

A proposed two-step mechanism for the acid-catalysed decomposition is shown below:

Step 1: H2O2 (aq) + H+ (aq) → H3O2+ (aq)

Step 2: H3O2+ (aq) + H2O2 (aq) → 2H2O (l) + O2 (g) + H+ (aq)

From the mechanism, identify the catalyst and the intermediate, giving a reason for each choice.

4a
2 marks

During the following reaction, A and B react together to produce C

A  +  2B  ⇌  C

Figure 1 shows the production of C over time.   

Figure 1

lJm_oKlA_3

i) Sketch a graph to show what happens to A and B during the progress of the reaction. 

[1]

ii) On your graph, label the point at which an equilibrium is first established the letter E

[1]

4b
3 marks

In the reaction in part (a), large pieces of A were used.

Use collision theory to explain what would happen to the rate of the reaction if powdered A was used instead of large pieces.

4c
6 marks

In a different reaction, gaseous W and X were added together to produce Y and Z as shown in the equation below:

2W (g)  +  X (g)  →  Y (g)  + 2Z (g)

A catalyst was added to speed up the rate of reaction. 

i) Sketch a Maxwell-Boltzmann distribution on the axes below in Figure 2 to show the distribution of molecular energies at a constant temperature with and without a catalyst.

Use Ea to label the activation energy without a catalyst and Ec to label the activation energy with a catalyst.

[3]

Figure 2

P5iChsAC_7

ii) Explain what your distribution shows.

[3]

4d
6 marks

Some changes were made individually to the experiment completed in part (c). 

Consider your Maxwell-Boltzmann distribution curve from part (c). For each of the changes in parts (i), (ii) and (iii) below, state and explain the effect that the change would have on:

  • The area under the curve 

  • The value of the most probable energy of the molecules (Emp

  • The proportion of molecules with energy greater than or equal to Ea

i) The temperature of the original reaction is increased, but no other changes are made.

[2] 

ii) The number of molecules in the original reaction mixture is increased, but no other changes are made.

[2] 

iii) A catalyst is added to the original reaction mixture, but no other changes are made.

[2]

5a
3 marks

A student carried out a metal displacement reaction between zinc powder and copper(II) sulfate solution. The equation for the reaction is

Zn (s) + CuSO4 (aq) → ZnSO4 (aq) + Cu (s)

3.78 g of zinc powder was added to 50.0 cm3 of 0.250 moldm-3 copper(II) sulfate solution.

Determine the limiting reagent showing your working.

5b
2 marks

The reaction between the zinc and copper sulfate was carried out in a polystyrene cup and the temperature change was measured using a temperature probe. The maximum temperature rise the student recorded was 8.5 oC. 

Using sections 1 and 2 of the data booklet, calculate the enthalpy change, ∆H, for the reaction, in kJ.

Assume that all the heat evolved was absorbed by the solution, and that the density and specific heat capacity of the copper(II) sulfate solution are the same as pure water.

5c
2 marks

State two further assumptions made in the calculation of ∆H.

5d
4 marks

On the axes below, sketch a graph of the concentration of zinc sulfate, ZnSO4 (aq), versus time and show how the graph may be used to find the initial rate of reaction.

11-2-ib-chemistry-sq-q2d-medium
6a
4 marks

A student investigated the rate of decomposition of hydrogen peroxide, H2O2, at a temperature of 45 o The decomposition reaction occurs in the presence of a catalyst, MnO2.

2H2O2 (aq) rightwards arrow with space MnO subscript 2 on top O2 (g) + 2H2O (l) 

The results she obtained are shown in the below.

Time / s

Concentration of H2O2 / moldm-3

Time / s

Concentration of H2O2 / moldm-3

0

0.200

120

0.068

20

0.155

140

0.063

40

0.124

160

0.058

60

0.102

180

0.055

80

0.085

200

0.052

100

0.075


 Plot a graph on the axes below in and determine the rate of reaction after 60 s.

11-2-ib-chemistry-sq-q5a-medium
6b
3 marks

i) On the same graph, sketch the shape obtained if the student had carried out the same reaction at 60 oC.

[1]

ii) Explain the shape of the graph at 60 oC.

[2]

6c
3 marks

The decomposition of hydrogen peroxide can be investigated by measuring the volume of oxygen given off using the apparatus shown below.

11-2-ib-chemistry-sq-q5c-medium

i) Explain why the volume of oxygen given off can be used as a measure of the concentration of hydrogen peroxide. 

[1]

ii) Suggest one limitation of using the apparatus used.

[1]

iii) Suggest an alternative method of measuring the rate of reaction.

[1]

6d
2 marks

Two students decide to measure the rate of decomposition for H2O2 using the change in mass as oxygen escapes from the reaction container.

One student says that they should use a three decimal place rather than two decimal place balance because it will make their results more accurate. The second student disagrees and says it will make their results more precise, but not more accurate.

Which student is correct?

7a
2 marks

For the reaction below, consider the following experimental data.  

X (aq) + Y (aq) → Z (aq)

Experiment

Initial [X] / mol dm-3

Initial [Y] / mol dm-3

Initial rate / mol dm-3 s-1

1

0.030

0.040

4.0 x 10⁻⁴

2

0.045

0.040

6.0 x 10⁻⁴

3

0.060

0.120

2.4 × 10⁻³

 Deduce the order of reaction with respect to X.

7b
2 marks

Deduce the order of the reaction with respect to Y.

7c
1 mark

Write the rate expression for the reaction between X and Y.

7d
3 marks

Determine the rate constant, k, correct to three significant figures and state its units, using data from Experiment 2. 

Experiment

Initial [X] / mol dm-3

Initial [Y] / mol dm-3

Initial rate / mol dm-3 s-1

1

0.030

0.040

4.0 x 10⁻⁴

2

0.045

0.040

6.0 x 10⁻⁴

3

0.060

0.120

2.4 × 10⁻³

8a
2 marks

Explain why the reaction represented below is a redox reaction. 

2ClO2 (aq) + 2NaOH (aq) → NaClO3 (aq) + NaClO2 (aq) + H2O (l) 

8b
3 marks

For the reaction below, consider the following experimental data. 

2ClO2 (aq) + 2OH- (aq) → ClO3- (aq) + ClO2- (aq) + H2O (l)

Experiment

Initial [ClO2]

/ mol dm-3

Initial [OH-]

/ mol dm-3

Initial rate

/ mol dm-3 s-1

1

0.85

1.70

9.30 x 10⁻⁵

2

1.70

1.70

3.72 x 10⁻⁴

3

1.70

0.85

1.86 x 10⁻⁴

Deduce the rate expression.

8c
3 marks

Determine the rate constant, k, and state its units, using data from Experiment 3. 

8d
2 marks

Calculate the rate when [ClO2 (aq)] = 3.10 x 10⁻² mol dm-3 and [OH- (aq)] = 1.50 x 10⁻² mol dm-3.

9a
1 mark

The reaction between nitrogen dioxide and carbon monoxide is:

            NO2 (g) + CO (g) → NO (g) + CO2 (g) 

A graph of the concentration of NO2 versus time for this reaction is shown.

q4a_16-1_ib_hl_medium_sq

 Deduce the order of reaction with respect to NO2.

9b
2 marks

The experimentally determined rate expression is: 

            Rate = k [NO2]

Sketch a labelled graph of concentration against time for the reactant carbon monoxide.

9c
2 marks

A student proposes that the reaction occurs in a single elementary step:

NO2 + CO → NO + CO2

Justify whether this proposed one-step mechanism is consistent with the experimental rate expression.

9d
1 mark

Another student proposes a two-step mechanism:

Step 1:             NO2 + NO2 → NO + NO3    

Step 2:             NO3 + 2CO → NO + 2CO2 

Explain which of these steps must be the rate-determining step to be consistent with the experimental rate expression.

10a
1 mark

Nitrogen(II) oxide is oxidised according to the following equation. 

2NO (g) + O2 (g) → 2NO2 (g) 

The following mechanism is proposed for the two-step oxidation of nitrogen(II) oxide. 

Step 1:             NO (g) + NO (g) → N2O2 (g)
   Step 2:             N2O2 (g) + O2 (g) → 2NO2 (g) 

The potential energy profile for this two-step reaction is shown.

q5a_16-1_ib_hl_medium_sq

Explain which step is the rate determining step.

10b
3 marks

Energy profile diagrams give evidence for or against a proposed mechanism or proposed rate expression.

i) Explain why the rate expression for the oxidation of nitrogen(II) oxide is not rate = k [N2O2] [O2].

[2]

ii) Deduce the rate expression for the oxidation of nitrogen(II) oxide.

[1]

11a
2 marks

The reaction between iodide ions and persulfate ions in solution is kinetically slow.

S2O82- (aq) + 2I- (aq) → 2SO42- (aq) + I2 (aq)

Explain, in terms of electrostatic forces, why this reaction has a high activation energy.

11b
2 marks

The reaction can be catalysed by iron(II) ions via the following two-step mechanism:

Step 1: 2Fe2+ (aq) + S2O82- (aq) → 2Fe3+ (aq) + 2SO42- (aq)   (slow)

Step 2: 2Fe3+ (aq) + 2I- (aq) → 2Fe2+ (aq) + I2 (aq) (fast)

On the axes below, sketch a labelled potential energy profile for this catalyzed, two-step reaction. The overall reaction is exothermic.

q5d_16-1_ib_hl_medium_sq
11c
1 mark

Deduce the rate expression for the catalyzed reaction that is consistent with the proposed mechanism.

12a
3 marks

A student is investigating the kinetics of the decomposition of hydrogen peroxide, a reaction known to be first-order.

2H2O2 (aq) → 2H2O (l) + O2 (g)

In a single experiment at 290 K, the student determines the rate constant to be k = 6.62 x 10⁻³ s-1

The Arrhenius constant, A, for this reaction is 3.18 × 10¹¹ s-1.

Using sections 1 and 2 of the data booklet, calculate a preliminary value for the activation energy, Ea. Give your answer to three significant figures.

12b
2 marks

To determine a more accurate value for the activation energy, the student measures the rate constant at five different temperatures. The data is shown in the table below.

Rate constant k / s-1

ln k

Temperature / K

 italic 1 over italic T

0.000493


295


0.000656


298


0.001400


305


0.002360


310


0.006120


320


Complete the table by calculating the values of ln k and begin mathsize 14px style italic 1 over italic T end style needed for an Arrhenius plot.

12c
4 marks

Plot a graph of ln k against begin mathsize 14px style italic 1 over italic T end style on the grid provided. Draw a line of best fit.

Blank graph paper.
12d
4 marks

Using section 2 of the data booklet and your graph, determine a more accurate value for the activation energy, Ea, for this reaction.

13a
3 marks

The Arrhenius equation, k = Ae to the power of negative E a divided by R T end exponent, relates the rate constant of a reaction to temperature and the activation energy.

State the effect on the value of the rate constant, k, of an increase in:

i)     The constant, A, (frequency factor) 

[1]

ii)     Activation energy, Ea 

[1]

iii)    Temperature, T

[1]

13b
2 marks

A student investigates the kinetics of a first-order reaction. In a preliminary experiment at 57 oC, the student determines the rate constant to be k = 1.30 x 10⁻⁴ s-1

The Arrhenius constant, A, for this reaction is 4.55 × 10¹³ s-1.

Using sections 1 and 2 of the data booklet, calculate a value for the activation energy, Ea. Give your answer to three significant figures.

13c
3 marks

To determine a more accurate value for the activation energy, the student measures the rate constant at four different temperatures. The student's completed table is shown below.

Rate constant k/s-1

ln k

Temperature / K

 italic 1 over T

2.0 x 10⁻⁵

-10.8

278

0.00360

4.7 x 10⁻⁴

-7.7

298

0.00336

1.7 x 10⁻³

-6.4

308

0.00325

5.2 x 10⁻³

-5.3

318

0.00314

Plot a graph of ln k against begin mathsize 14px style italic 1 over italic T end style on the grid provided. Draw a line of best fit.

q2c_16-2_ib_hl_medium_sq
13d
4 marks

Using section 2 of the data booklet and your graph, determine a more accurate value for the activation energy, Ea, for this reaction.

14a
1 mark

The reaction between nitrogen dioxide and ozone is first order with respect to both reactants. The overall equation is:

            2NO2 (g) + O3(g) → N2O5 (g) + O2 (g) 

State the rate expression for the reaction.

14b
3 marks

At 30°C, the initial rate of reaction is 3.46 × 10⁻³ mol dm−3 s−1 when [NO2] is 0.50 mol dm−3 and [O3] is 0.21 mol dm−3.

Calculate a value for the rate constant, k, at this temperature and state its units.

14c
4 marks

For this reaction, the value of ln A is 15.8.

Using your answer from part (b) and sections 1 and 2 of the data booklet, calculate the activation energy, Ea, for this reaction in kJ mol-1.

14d
1 mark

State the effect of increasing temperature on the activation energy, Ea.

15a
1 mark

A common relationship exists between temperature and rate. 

What temperature change is associated with a doubling of rate? 

15b
2 marks

An Arrhenius plot of ln k against italic 1 over T for the reaction between A (g) and B (g) at different temperatures is shown in Figure 1 below.

q4b_16-2_ib_hl_medium_sq

The equation of the line of best fit was found to be: 

            ln k = -6154begin mathsize 14px style begin italic style stretchy left parenthesis 1 over italic T stretchy right parenthesis end style end style - 8.2 

Calculate the activation energy, Ea, for the reaction between A (g) and B (g).

15c
2 marks

Define the Arrhenius constant, A.

15d
2 marks

Using the Arrhenius plot, calculate an approximate value for the constant, A.

16a
1 mark

A student investigates the kinetics of the reaction between hydrogen and iodine gas:

H2 (g) + I2 (g) → 2HI (g)

A general Arrhenius plot for a reaction with a known activation energy is shown by the solid line.

Graph depicting a line with negative slope, showing the relationship between natural log of k (y-axis) and inverse temperature (1/T) on the x-axis.

On the same axes, sketch a line to represent a reaction that has a higher activation energy but the same Arrhenius constant.

16b
2 marks

On a separate set of axes, a line for another general reaction is shown.

Graph showing a negative linear relationship between ln k (y-axis) and 1/T (x-axis), illustrating a typical Arrhenius plot.

On these axes, sketch the line that would represent the same reaction in the presence of a catalyst.

16c
3 marks

The student obtains the following experimental data for the hydrogen-iodine reaction.

Experiment

Temperature / K

Rate constant, k / mol dm-3 s-1

1

599

5.40 x 10⁻⁴

2

683

2.80 x 10⁻²

Using sections 1 and 2 of the data booklet, calculate the activation energy, in kJ mol-1, for the reaction.

16d
2 marks

Using the data from experiment 1 and sections 1 and 2 in the data booklet, calculate a value for the constant, A.

1a
2 marks

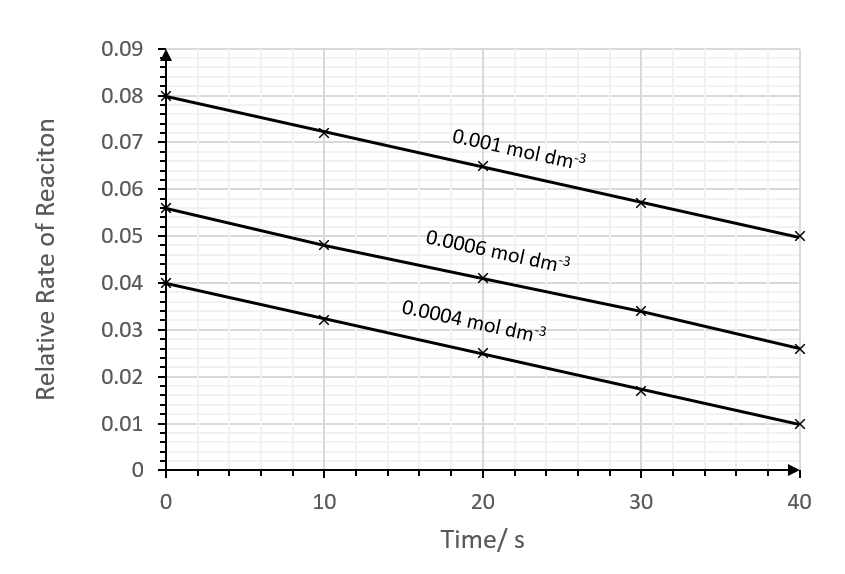
A group of students planned how to investigate the effect of changing the concentration of H2SO4 on the initial rate of reaction with magnesium: 

Mg (s) + H2SO(aq) rightwards arrowMgSO4 (aq) + H2 (g) 

They decided to measure how long the reaction took to complete when similar masses of magnesium were added to acid. 

Two methods were suggested:

Method 1 - Use small pieces of magnesium ribbon, an excess of acid and record the time taken for the magnesium ribbon to disappear

Method 2 - Use large strips of magnesium ribbon, an excess of magnesium and record the time taken for bubbles to stop forming 

Deduce, giving a reason, which of method 1 and method 2 would be the least affected if the masses of magnesium ribbon used varied slightly between each experiment.

1b
2 marks

Neither method in part a) actually allows the initial rate to be calculated. Outline a method that would allow the calculation of initial rate.

1c
1 mark

The reaction is to be conducted across a few weeks.

State a factor that has a significant effect on reaction rate, which could vary between experiments across the weeks and therefore needs to be controlled.

1d
Sme Calculator
4 marks

One group collected the following data using 1.50 mol dm-3 acid: 

Trial

Time/ s (plus-or-minus 0.01 s)

1

91.56

2

98.33

3

72.08

4

89.41

i) Comment on the use of uncertainty when calculating the mean.

[2]

ii) Calculate the mean time for the set of results.

[2]

2a
5 marks

When investigating the reaction between sulfuric acid and calcium carbonate, it was observed that a small increase of temperature of around 10 oC caused a doubling in the rate of the reaction.

Sketch and label Maxwell-Boltzmann curve for the two temperatures T and T+10, and use this diagram to help to explain this effect of temperature on rate.

2b
2 marks

Why do some collisions at high temperatures still not result in the formation of the product?

2c
3 marks

Identify and explain another factor that affects the number of particles present in a solution with sufficient energy to react.

2d
2 marks

Some groups investigating the effect of temperature on rate stirred their reactions, some did not.

Explain the effect of stirring upon the rate of the reaction.

3a
5 marks

0.5 g of magnesium reacts with 50 cm3 of 0.01 moldm-3 nitric acid. Magnesium is in excess.

A graph monitoring the volume of hydrogen gas produced is shown below:

Graph showing volume of gas produced over time. Volume increases steeply at first, then levels off near 60 cm³ over 40 seconds.

i) Calculate the mean rate of reaction over the first 15 seconds of the reaction

[1]

ii) Calculate the actual rate of reaction at 15 seconds

[3]

iii) Explain the difference in values for rate

[1]

3b
3 marks

Compare the expected rate and progress of the reaction if 25 cm3 of 0.2 mol dm-3 nitric acid was used instead of 50 cm3 of 0.1 mol dm-3 nitric acid.

3c
2 marks

Suggest one change to the reaction that could be made to produce more hydrogen gas in total and explain your choice.

3d
2 marks

Suggest why it is often better to study a slower reaction instead of a faster one.

4a
1 mark

The following energy profile diagram shows the pathways for both a catalysed and uncatalysed reversible reaction:

Graph showing a reaction progress with enthalpy on the vertical axis. Reactants have higher energy than products, with a peak indicating activation energy.

Identify the letter(s) representing the activation energy for the catalysed reverse reaction.

4b
2 marks

State and explain the effect that this catalyst will have on the equilibrium yield.

4c
2 marks

Vehicles with combustion engines usually have catalytic convertors added to catalyse the oxidation of carbon monoxide into carbon dioxide and to catalyse the reduction of nitrogen oxides to nitrogen. These catalysts are usually rhodium or platinum.

Leaded fuels were phased out as they were found to poison these catalysts, binding irreversibly to the metal surface.

Explain the problems for drivers of the catalysts being poisoned.

4d
1 mark

Suggest a situation in which using a catalyst would not be appropriate.

5a
Sme Calculator
2 marks

The reaction between iodide ions and persulfate ions is a 'clock' reaction and often used to study reaction kinetics.

2I- (aq) + S2O82- (aq) → I2 (aq) + 2SO42- (aq)

Deduce the redox changes taking place in the reaction.

5b
Sme Calculator
3 marks

A persulfate-iodide clock reaction was studied and the following rate data obtained.

Experiment

[S2O82-] / mol dm-3

[I-] / mol dm-3

Initial rate/ mol dm-3 s-1

1

0.25

0.10

8.0 x 10⁻³

2

0.10

0.10

3.2 x 10⁻³

3

0.20

0.30

1.92 x 10⁻²

Deduce the rate expression for the reaction.

5c
Sme Calculator
2 marks

Calculate the rate constant, k, and state its units.

5d
3 marks

Four mechanisms are proposed for the persulfate-iodide reaction.

Mechanism 1:

  1. I- (aq) + I- (aq) → I22- (aq)                                         slow

  2.  I22- (aq) + S2O82- (aq) → I2 (aq) + 2SO42- (aq)    fast

Mechanism 2:

  1. I- (aq) + S2O82- (aq) → S2O8I3- (aq)                     slow

  2.  S2O8I3- (aq) + I- (aq) → I2 (aq) + 2SO42- (aq)    fast

Mechanism 3:

  1. I- (aq) + S2O82- (aq)  → S2O8I3- (aq)                    fast

  2.  S2O8I3- (aq) + I- (aq) → I2 (aq) + 2SO42- (aq)    slow

Mechanism 4:

  1.  2I- (aq) + S2O82- (aq) → I2 (aq) + 2SO42- (aq)    slow

Deduce which mechanism(s) is/are consistent with the rate equation you determined. Justify your answer.

6a
1 mark

The reaction between nitrogen monoxide and hydrogen produces nitrogen and water:

2NO (g) + 2H2 (g) →  N2 (g) + 2H2O (g)

Rate data for this reaction is shown below.

Experiment 

[NO] / mol dm-3 

[H2] / mol dm-3 

Initial rate/ mol dm-3 s-1

1

0.001

0.004

0.002

2

0.002

0.004

0.008

3

0.004

0.001

0.032

Determine the overall order of the reaction.

6b
2 marks

Draw a sketch graphs of:

i) Rate against concentration of NO.

[1]

ii) Rate against concentration of H2

[1]

6c
2 marks

Suggest a possible mechanism for the reaction.

6d
2 marks

Suggest a Lewis structure for N2O2 and draw the shape of the molecule.

7a
Sme Calculator
3 marks

The rate of reaction between manganate(VII) ions and oxalate ions, C2O42-, can be investigated by measuring how the concentration of manganate(VII) varies with time.

2MnO4- (aq) + 16H+ (aq) + 5C2O42-  →  2Mn2+(aq) + 8H2O(l) + 10CO2(g) 

The rate is first order with respect to oxalate ions and the general rate equation for the reaction is:

rate = k [MnO4-]p[C2O42-]q[H+]r

i) Suggest how the change in manganate(VII) concentration can be measured.

[1]

ii) A student investigated how the concentration of manganate(VII) affected the rate of reaction and produced the following results. The oxalate ions and acid were in excess.

Graph showing [MnO₄⁻] concentration in mol dm⁻³ decreasing over 60 seconds, with data points plotted at intervals.


Determine the rate of reaction.

[2]

7b
2 marks

The student used an acid concentration of 1.0 mol dm-3. She then varied it, keeping the other concentrations constant. She measured the rate of reaction and found the following results:

[H+]/ mol dm-3

Relative rate of reaction

0.5

0.0025

0.25

0.0013

0.01

0.0005

Identify the relationship between the relative rate of reaction and H+, and hence determine the order of reaction with respect to H+ ions.

7c
3 marks

The student varied the concentration of [MnO4-] and plotted the rate against time at three different concentrations:

Graph showing the relative rate of reaction over time for three concentrations: 0.001, 0.0006, and 0.0004 mol dm^-3, each with decreasing trends.

i) Deduce, with a reason, the order of reaction with respect to MnO4-.

[2]

ii) Write the rate expression for the reaction.

[1]

8a
4 marks

A reaction proceeds by a three step mechanism. The energy profile for the reaction is shown below:

Graph showing energy changes in a reaction. Peaks A and E mark activation energies; valleys B and D are intermediates. Reactants and products are labelled.

Explain the difference between points A, C, E and B, D on the profile.

8b
2 marks

Deduce which step is the rate determining step of the reaction, giving a reason.

9a
Sme Calculator
3 marks

A series of experiments were carried out to investigate how the rate of the reaction of bromate and bromide in acidic conditions varies with temperature.

The time taken, t, was measured for a fixed amount of bromine to form at different temperatures. The results are shown below. 

Temperature (T) / K

1 over Tx 10-3 / K-1

Time (t) / s

1 over t/ s-1

ln1 over t

408

2.451

21.14

0.0473

-3.051

428

2.336

10.57


448


5.54

0.1805

-1.712

468

2.137

3.02

0.3311

-1.106

488

2.049


-0.536

Complete the table above.

9b
Sme Calculator
4 marks

The Arrhenius equation relates the rate constant, k, to the activation energy, Ea, and temperature, T.

ln k = ln A + fraction numerator negative E subscript a over denominator R T end fraction

In this experiment, the rate constant, k, is directly proportional to 1 over t. Therefore, 

ln 1 over t= ln A + fraction numerator negative E subscript a over denominator R T end fraction

Use your answers from part (a) to plot a graph of ln 1 over t against 1 over Tx 10-3 on the graph below.

Graph paper for an Arrhenius plot
9c
Sme Calculator
4 marks

Use section 2 of the data booklet along with your graph and information from part (b) to calculate a value for the activation energy, in kJ mol–1, for this reaction.

To gain full marks you must show all of your working.

10a
Sme Calculator
3 marks

Three experiments were carried out at a temperature, T1,  to investigate the rate of the reaction between compounds F and G. The results are shown in the table below:


Experiment 1

Experiment 2

Experiment 3

Initial concentration of F / mol dm-3 

1.71 x 10⁻²

5.34 x 10⁻²

7.62 x 10⁻²

Initial concentration of G / mol dm-3 

3.95 x 10⁻²

6.24 x 10⁻²

3.95 x 10⁻²

Initial rate / mol dm-3 s-1 

3.76 x 10⁻³

1.85 x 10⁻²

1.68 x 10⁻² 

Use the data in the table to deduce the rate equation for the reaction between compounds F and G.

10b
Sme Calculator
2 marks

Use the information in the table in part (a) to calculate a value for the rate constant, k, for this reaction between 0.0534 mol dm-3 F and 0.0624 mol dm-3 G

Give your answer to the appropriate number of significant figures.

State the units for k.

10c
Sme Calculator
2 marks

The Arrhenius equation shows how the rate constant, k, for a reaction varies with temperature, T.

k = A e to the power of fraction numerator negative E subscript a over denominator R T end fraction end exponent

For the reaction between 0.0534 mol dm-3 F and 0.0624 mol dm-3 G at 25 °C, the activation energy, Ea, is 16.7 kJ mol–1

Use section 2 of the data booklet and your answer to part (b) to calculate a value for the Arrhenius constant, A, for this reaction. 

Give your answer to the appropriate number of significant figures.

10d
Sme Calculator
2 marks

The temperature of the reaction is increased to twice the original temperature, T1. The value of k increases to 0.28 mol-1 dm3 s-1 at this new temperature.  

Using sections 1 and 2 of the data booklet and your answer to part (b), determine the original temperature, T1.

11a
Sme Calculator
2 marks

The kinetics of a first-order reaction are being investigated.

It is observed that the rate of reaction doubles when the temperature is increased from from 25.0 °C to 35 °C.

Using section 1 and 2 of the data booklet, calculate the activation energy, Ea, in kJ mol−1 for the reaction.

11b
2 marks

State and explain the effect that introducing a catalyst would have on the rate constant, k, at a constant temperature

11c
Sme Calculator
4 marks

For the uncatalysed reaction, the rate constant at 25.0 °C (298 K) is found to be 7.75 × 10³ s-1.

The temperature is now reduced to a new temperature, T2, at which the rate constant is 6.20 × 10³ s-1.

Using the activation energy calculated in part (a), determine the new temperature, T2, in °C