Limiting Factors of Photosynthesis: Skills (DP IB Biology): Revision Note
Limiting Factors
An aquatic plant such as Elodea or Cabomba is a good choice for investigating photosynthesis in plants, because the rate of photosynthesis can be measured by counting oxygen bubbles that come off a cutting of this plant
Oxygen output from terrestrial plants (that grow on land) would not be observable
NOS: Hypotheses are provisional explanations that require repeated testing
A hypothesis is a proposed explanation for an idea which may be true or false
In an investigation the hypothesis can be tested through observations or experiments to provide either support or opposition to the proposed hypothesis
The following investigation looks at the effect of limiting factors on the rate of photosynthesis
A suggested hypothesis for an investigation into the effect of light intensity on photosynthesis could be:
Light intensity will have an effect on the rate of photosynthesis
Identifying the variables in an investigation
When designing an experiment it is crucial that all variables (apart from the independent and dependent variables being investigated) are controlled
The independent variable is the factor that is deliberately manipulated between a specific range throughout the experiment
The dependent variable is the factor that is measured during the experiment (to see if it is affected by the changes to the independent variable)
Other variables must be controlled so that it can be said the independent variable is the only factor affecting the dependent variable during the experiment
Changes in light intensity, carbon dioxide concentration and temperature are all limiting factors that affect the rate of photosynthesis and can be altered experimentally to measure the effect on the rate of photosynthesis
Any of these limiting factors could be selected as the independent variable in the investigation
Effect of light intensity - experimental design
Basic Experimental Setup
Aquatic plant cutting in water
Powdered sodium hydrogencarbonate (NaHCO3)
Glass funnel
Boiling tube
Lamp for illumination
Glass tank filled with water

Measuring the effect of light Intensity on the rate of photosynthesis in pondweed
Research Question
Does the rate of photosynthesis (number of bubbles released per min) of Elodea increase as the light intensity increases?
Method
Place a piece of aquatic plant (Elodea or Cabomba are often used), into a beaker of water
Place a lamp a set distance from the plant
Record the number of bubbles observed in three minutes
Repeat these steps for different distances between the lamp and plant
Improvements
Use a gas syringe to collect and measure the volume of gas produced
For reliability of data, repeat the experiment at least twice for each distance and calculate the mean number of bubbles
Use of a data logger to measure results continuously
Variables to Be Controlled
Temperature
The glass tank filled with water absorbs any heat that is emitted from the lamp
Modern LED bulbs can be used as they give off less heat than filament bulbs
CO2 concentration
The water used around the plant is first boiled and re-cooled to remove any dissolved carbon dioxide
A set mass of sodium hydrogencarbonate is added to the water that surrounds the plant to make the concentration approx. 0.1 mol dm-3
This will ensure that the carbon dioxide concentration is not limiting the rate of photosynthesis
Results
A graph of the number of bubbles produced per minute against the distance between the lamp and the plant used can be drawn to see the pattern or trend
Distance between the lamp and the plant is linked to the light intensity

A graph of distance from the lamp against number of bubbles per minute
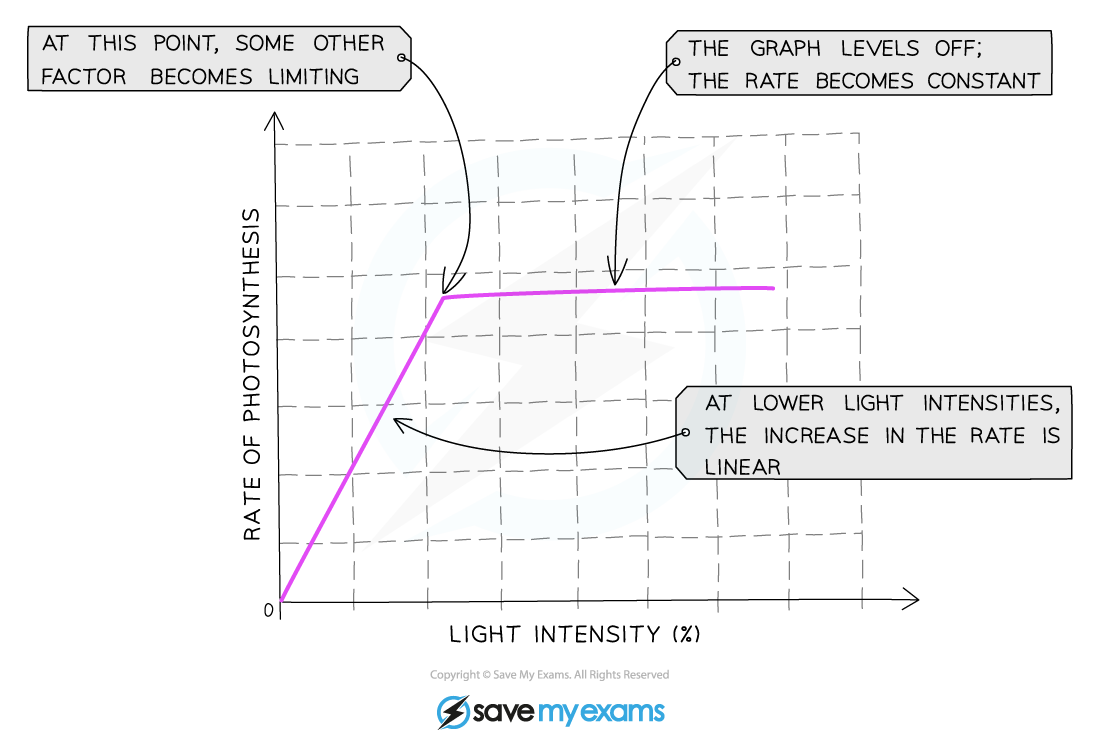
A graph can also be drawn showing the effect of different light intensities on the rate of photosynthesis
It can be seen that:
As light intensity increases so too does the rate of photosynthesis (positive correlation)
At this stage light intensity is the limiting factor
At some point, there will be no further increase in the rate of photosynthesis if the light intensity is increased
Now temperature or carbon dioxide concentration may be limiting factors

The effect of light intensity on the rate of photosynthesis
Carbon dioxide concentration
The same basic experimental setup can be used, but with varying use of the following variables
Start with boiled and re-cooled water as before
Add successive masses of sodium hydrogencarbonate to increase the concentration in increments of 0.01 mol dm-3, and record the rate of photosynthesis in bubbles minute-1
Keep the temperature constant at 25°C using a water bath, monitoring with a thermometer in the water surrounding the aquatic plant
Keep the light intensity constant by keeping the lamp a fixed distance from the plant
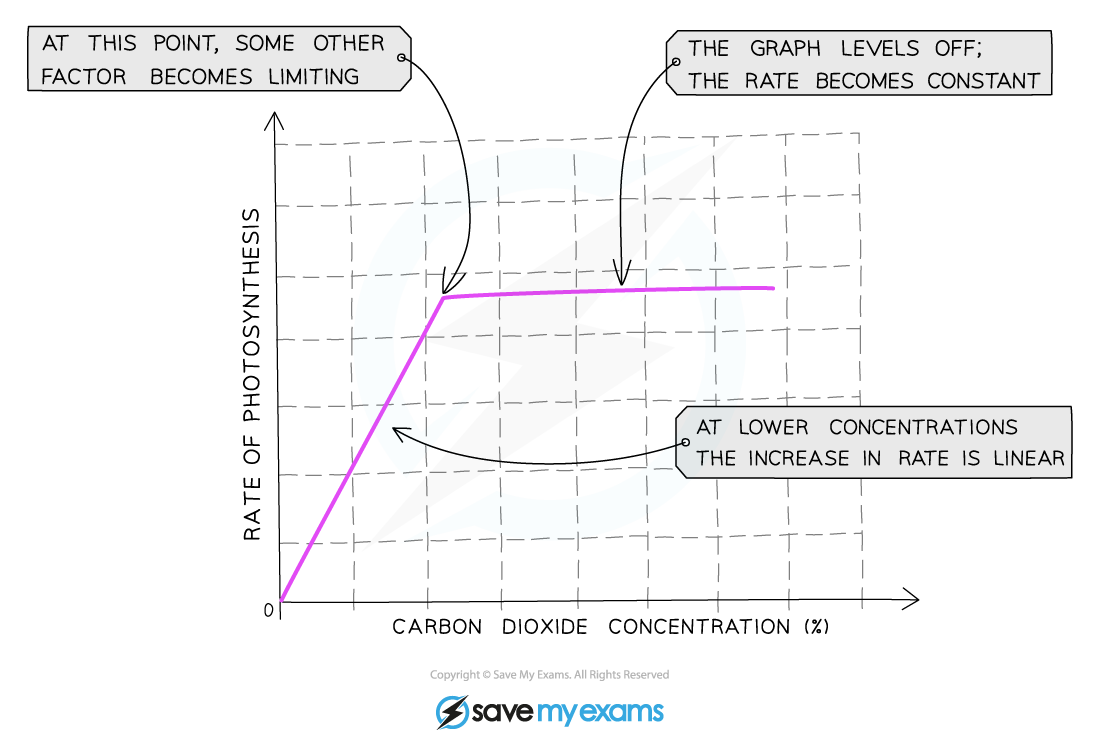
A graph of the effect of carbon dioxide concentration against the rate of photosynthesis shows a similar trend to what was observed with light intensity

The effect of carbon dioxide concentration on the rate of photosynthesis
Temperature
The same basic experimental setup can be used, but with varying use of the following variables
Start with boiled and re-cooled water as before, with sodium hydrogencarbonate at a fixed concentration of 0.1 mol dm-3, and record the rate of photosynthesis in bubbles minute-1
Vary the temperature from 5°C to 50°C using water baths, monitoring with a thermometer in the water surrounding the plant
Keep the light intensity constant by keeping the lamp a fixed distance from the plant
It can be seen from a graph of the effect of temperature on the rate of photosynthesis that:
An increase in temperature will result in an increased rate of photosynthesis
This is due to the increase in kinetic energy of enzyme and substrate molecules which results in more collisions and formation of more enzyme-substrate complexes
This increase will continue until the optimum temperature for the enzyme is reached
Any further increase in temperature will see a decrease in the rate of photosynthesis
As enzymes begin to denature, they cannot form enzyme-substrate complexes anymore and therefore cannot catalyse the reaction

The effect of temperature on the rate of photosynthesis
Examiner Tips and Tricks
The key to this part of the spec is to appreciate how an experimental investigation can be controlled so that any effects we observe are directly due to the one variable that we are deliberately changing.

Unlock more, it's free!
Did this page help you?