Processing Uncertainties in Biology (DP IB Biology) : Revision Note
Processing Uncertainties in Biology
What is uncertainty?
Scientific measurements are not perfect; there is always an associated level of uncertainty
Uncertainty is a quantitative indication of the quality of numerical results; it can be defined as:
The range of values around a measurement within which the true value is expected to lie
Uncertainties in measurements are recorded as a range (±) to an appropriate level of precision, e.g.
If a balance that measures mass shows scale graduations of 10 g, then mass is measured to the nearest 10 g (this is known as the margin of error)
The true value could be 5 g higher or lower than the measured value, so the uncertainty would be ±5 g
If a pipette shows scale graduations every 0.1 cm3, then volume is measured to the nearest 0.1 cm3
The true value could be 0.05 cm3 more or less than this, so the uncertainty would be ±0.05 cm3
Note that uncertainty is not the same as error
Error is the difference between a measured value and the true value for a measurement
Errors arise from equipment or practical techniques that cause a reading to be different from the true value
Error bars
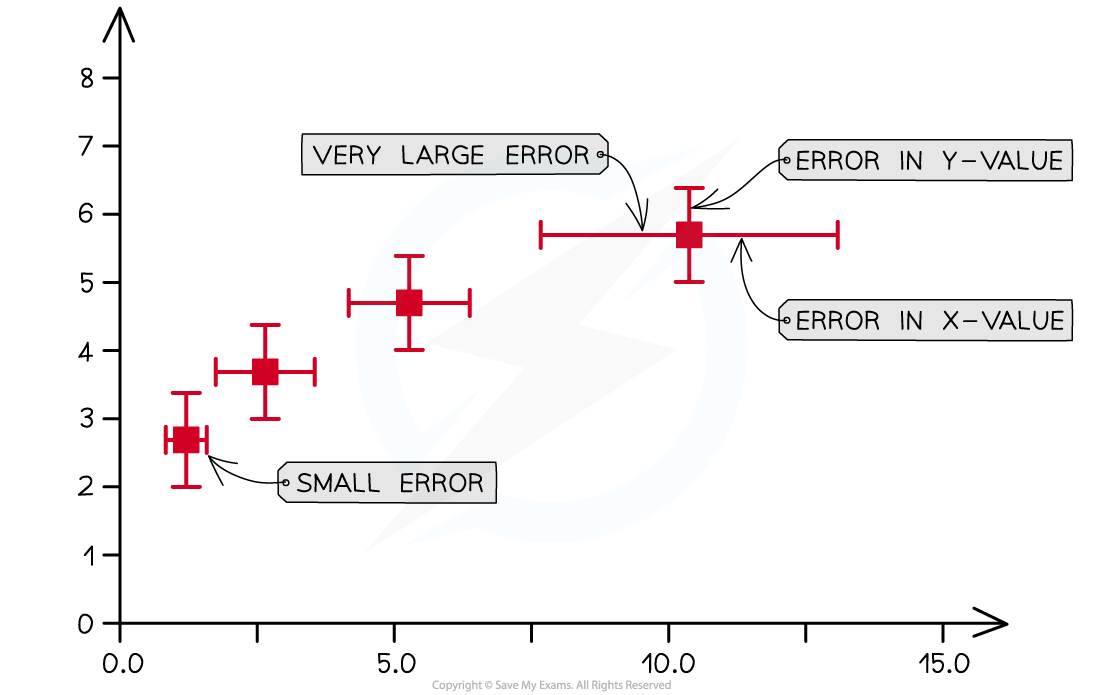
The uncertainty in a measurement can be shown on a graph as an error bar
This bar is drawn above and below the point (or from side to side) and shows the uncertainty in that measurement
Usually, error bars will be in the vertical direction, for y-values, but can also be plotted horizontally, for x-values
Range, degree of precision, standard error and standard deviation can be expressed on a graph using error bars
Range = the difference between the lowest and highest value
Degree of precision = how close a set of data points are to each other
Standard error = an estimate of the reliability of the mean
Standard deviation = the spread of data around the mean
Note that it is important that you know what is represented by error bars on a graph, e.g. whether they represent standard deviation or standard error; in an exam this information would be provided in the question
Error bars that represent standard deviation can be used to assess whether or not two data sets are significantly different to each other
Overlapping error bars indicate that two sets of data are not significantly different
Error bars are used in the specification when measuring osmotic concentration

Error bars on a graph can be used to show uncertainty
Level of precision
Measurements and processed uncertainties must be expressed to an appropriate level of precision
E.g. number of decimal places
This may depend on the sensitivity of the apparatus used to collect data; the level of precision used to express the data should not exceed the level of precision at which the data is initially measured
Values in a raw data set should all be expressed to the same level of precision
The coefficient of determination, R2
The coefficient of determination is a measure of fit that can be applied to lines and curves on graphs
The coefficient of determination is written as R2
It is used to evaluate the fit of a trend line / curve with its data set:
R2 = 0
The dependent variable cannot be predicted from the independent variable.
R² is usually greater than or equal to zero
R2 between 0 and 1
The dependent variable can be predicted from the independent variable, although the degree of success depends on the value of R2
The closer to 1, the better the fit of the trend line / curve
R2 = 1
The dependent variable can be predicted from the independent variable
The trend line / curve is a perfect fit
Note: This does not guarantee that the trend line / curve is a good model for the relationship between the dependent and independent variables
Coefficient of determination is used in the specification when comparing the speed of nerve impulse transmission
Correlation
Correlation is an association, or relationship, between variables
Note that there is a clear distinction between correlation and causation: correlation does not necessarily indicate a causal relationship
Causation occurs when one variable has an influence or is influenced by another
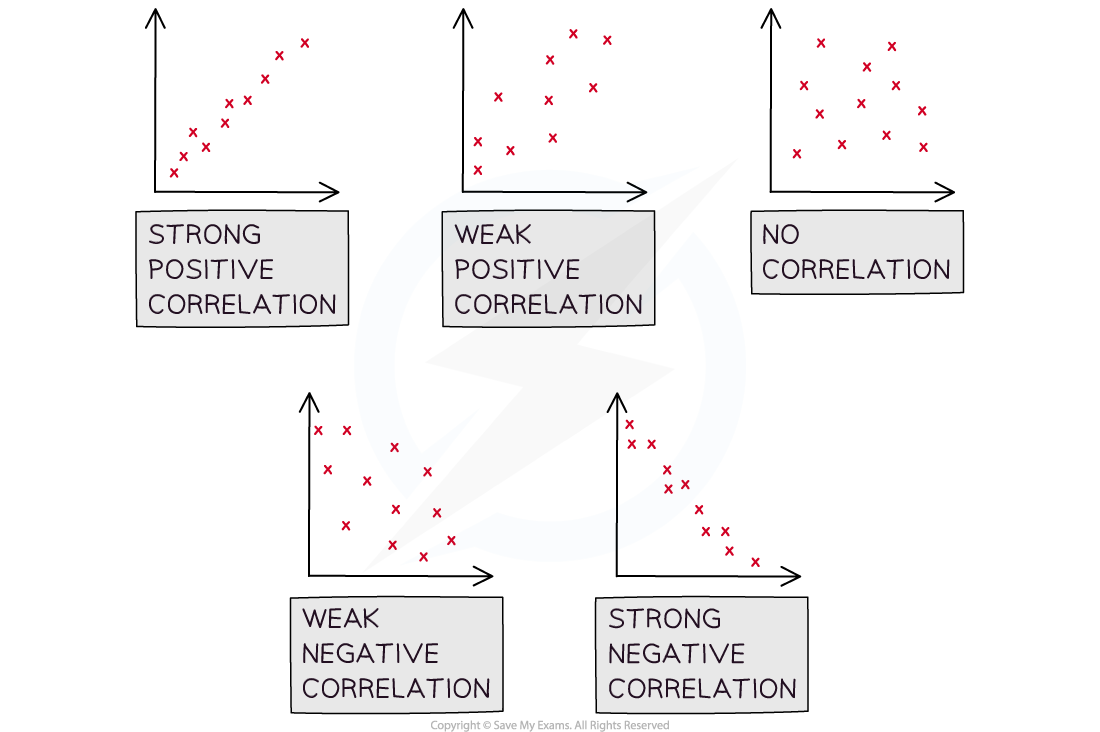
Correlation can be positive or negative
Positive correlation: as variable A increases, variable B increases
Negative correlation: as variable A increases, variable B decreases
The correlation coefficient (r) can be calculated to determine whether a linear relationship exists between variables and how strong that relationship is
Perfect correlation occurs when all of the data points lie on a straight line; this will give a correlation coefficient of 1 or -1
+1 = a completely positive correlation
-1 = a completely negative correlation
A less-than perfect correlation will give a correlation coefficient between 1 and 0, or between 0 and -1
The closer to +1, or -1, the coefficient is, the stronger the correlation
If there is no correlation between variables the correlation coefficient will be 0
Correlation coefficients are used in the specification when evaluating data on coronary heart disease

A strong correlation will have a correlation coefficient close to 1, a weak correlation will have a correlation coefficient close to 0, while a lack of any correlation will give a correlation coefficient of 0
Statistical tests
Statistical tests are used to assess whether or not a data set supports a particular hypothesis. e.g.
A null hypothesis will state that there is no significant difference, or association, between two variables
An alternative hypothesis will state that there is a significant difference, or association, between two variables
Statistical analysis allows researchers to accept or reject the null hypothesis
If a statistical test shows that there is no significant difference, or association, between variables, then it is said that any visible difference is due to chance alone
Different statistical tests are used for different types of data set, e.g.
A t-test determines whether the means of two data sets differ significantly
A correlation test determines the presence and strength of a correlation
A chi-squared test determines whether the difference between observed and expected values is significant
You should be able to select and apply the correct statistical test
The chi-squared test is used in the specification as follows:
To test for difference between observed and expected outcomes of a genetic cross
To test for association between species

You've read 0 of your 5 free revision notes this week
Sign up now. It’s free!
Did this page help you?
