Population Growth Curves: Skills (DP IB Biology): Revision Note
Population Growth Curves
Populations of living organisms tend to follow a set growth pattern over time; this growth pattern gives rise to a population growth curve that can be plotted on a graph
Population growth curves can generally be seen in any newly established or recovering population, e.g.
Antarctic fur seals were hunted extensively during the 1800s, and underwent a population recovery following the end of this practice
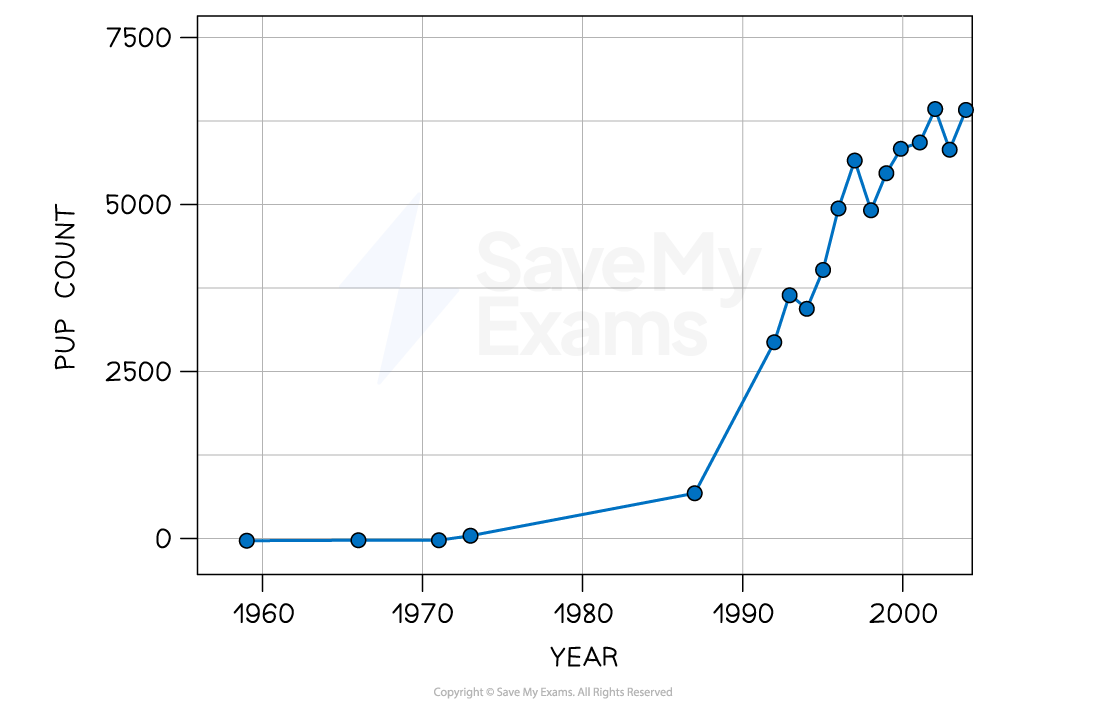
The recovery of the seal population in some locations follows a classic growth curve, e.g. in the graph below for seals on Cape Shirreff, Antarctica
Pup count is used to represent the size of the seal population
Note that this recovery has not continued throughout the early 21st century, with climate change having since caused severe declines in many seal populations
Antarctic fur seal growth curve graph

The Antarctic fur seal population in Cape Shirreff, Antarctica, followed a classic growth curve between 1960 and the early 2000s
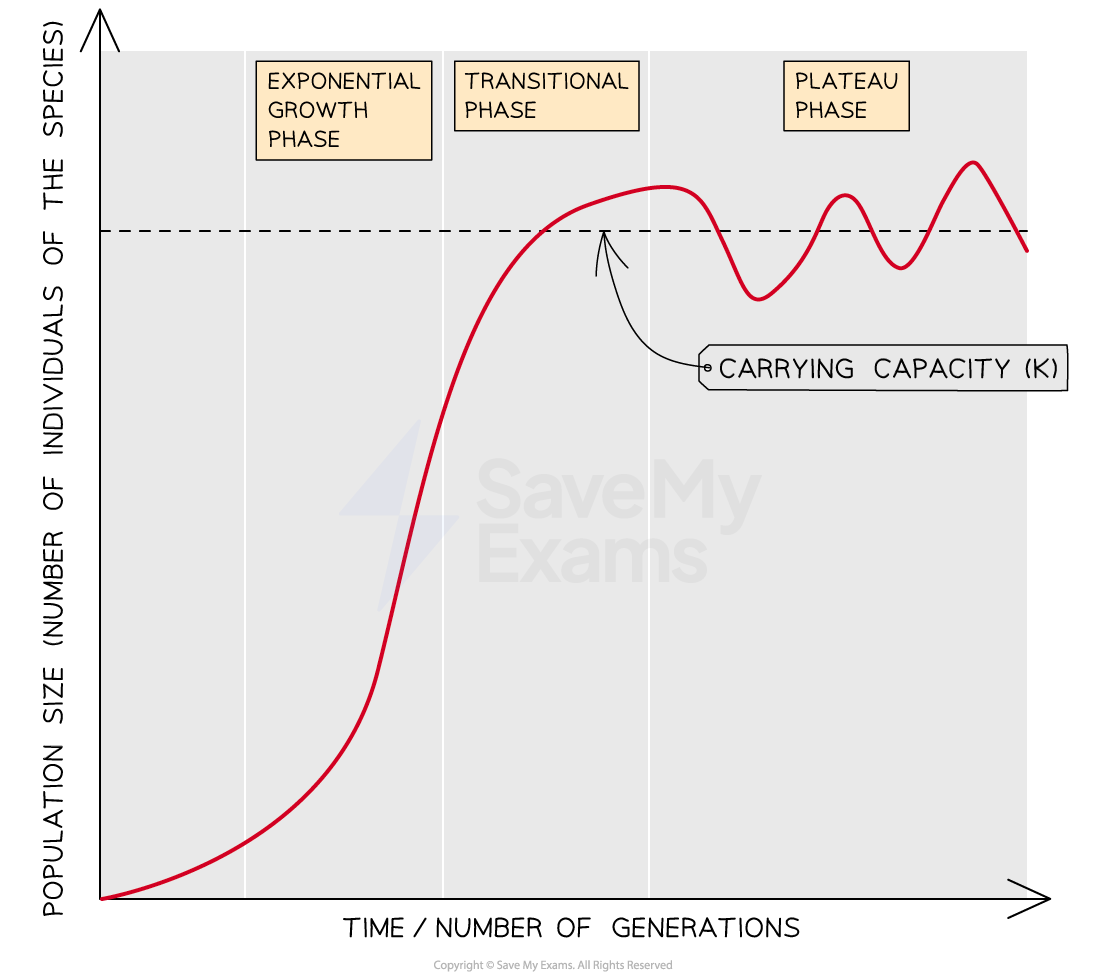
The population growth curve shown above is an example of a sigmoid, or s-shaped, growth curve
Such curves contain three phases:
Exponential phase
Also known as the logarithmic phase
Here there are no factors that limit population growth, so the population increases exponentially
The number of individuals increases, and so does the rate of growth
Transition phase
Limiting factors start to act on the population, e.g. competition increases and predators are attracted to large prey populations
The rate of growth slows, though the population is still increasing
Plateau phase
Also known as the stationary phase
Limiting factors cause the death rate to equal the birth rate and population growth stops
This plateau occurs at the carrying capacity
The population size often fluctuates slightly around the carrying capacity
Population growth curve graph

Sigmoidal population growth curves show an exponential growth phase, a transitional phase and a plateau phase
NOS: The curve represents an idealised graphical model
Scientists use models to represent real world ideas, organisms, processes and systems that cannot be easily investigated
Models are useful for the purposes of experimentation and testing predictions, but they are not perfect representations of biological systems
Here, the population growth model is useful for conceptualising the different stages in the growth of a population, but scientists must always be aware that real ecosystems are complex and that there are many factors at play in determining population size
There are few real-world situations where populations follow perfect sigmoid growth curves, and the seal population example given above soon showed population decline rather than remaining at a plataeu
Exponential Population Growth
Testing for exponential growth with a logarithmic scale
Population growth is exponential when the speed of growth is proportional to the number of individuals, i.e. a population of 20 individuals will reproduce at twice the rate of a population of 10 individuals
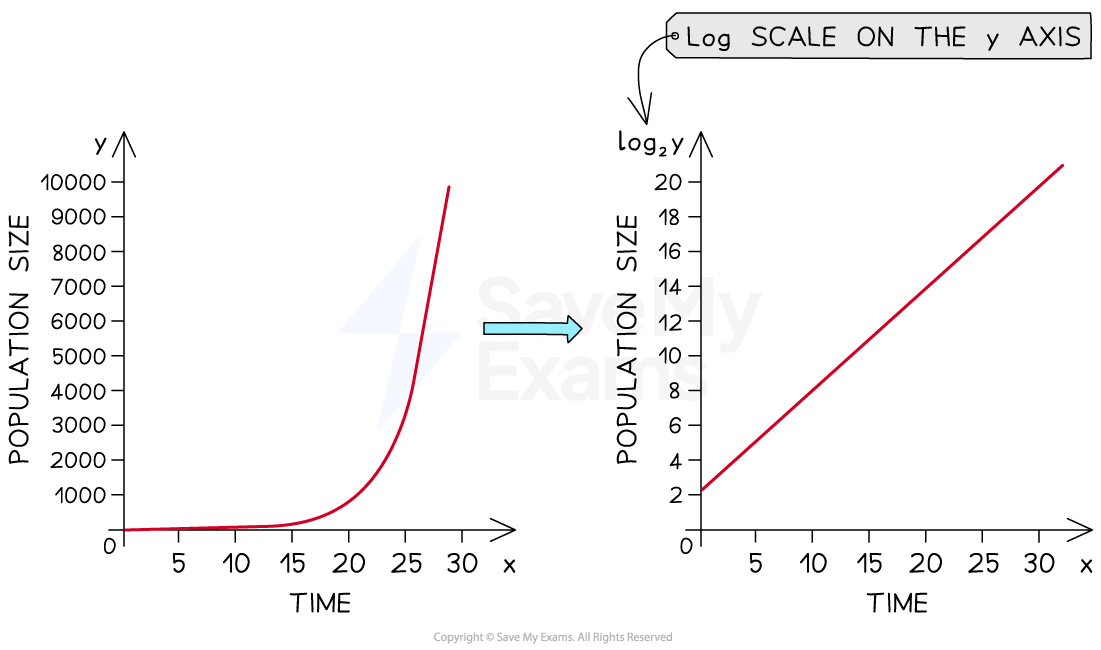
It is possible to assess whether or not exponential growth is occurring by plotting population size (y) against time (x) on a graph with a logarithmic scale on the y axis and a non-logarithmic scale on the x axis
Logarithmic scales can be very useful when investigating factors that vary over several orders of magnitude, e.g. population size
'Orders of magnitude' refers to whether values are measured in, e.g. tens, hundreds, thousands etc.; using a log scale allows tens and millions to be represented on the same easily visible scale
The numbers in a logarithmic scale represents logarithms, or powers, of a base number
If using a log10 scale, in which the base number is 10, the numbers on the y-axis represent a power of 10, e.g. 1=101 (10), 2=102 (100), 3=103 (1000) etc.
Logarithmic scales allow for a wide range of values to be displayed on a single graph
An exponentially growing population plotted with a log scale on the y axis will appear as a straight line:
Exponential population growth on a logarithmic scale graph

An exponentially growing population plotted with a log scale on the y axis will appear as a straight line
Modelling the Sigmoid Growth Curve
Organisms that grow and reproduce under laboratory conditions can be used to model the sigmoid population growth curve
Suitable organisms include:
Yeast
Duckweed
Modelling population growth curves using yeast
The population growth rate of microorganisms, such as bacteria or yeast, can be investigated by growing the microorganisms in a broth culture
The turbidity of the suspension can then be used as a way of estimating the number of cells, i.e. the population size, of the microorganisms in the broth culture
Turbidity is a measure of the cloudiness of a suspension, i.e. how much light can pass through it
As the microorganisms in the broth culture reproduce and their population grows, the suspension becomes progressively more turbid
This changing turbidity can be monitored by measuring how much light can pass through the suspension at fixed time intervals after the initial inoculation of the nutrient broth with the microorganisms
A turbidity meter or a colorimeter, connected to a datalogger, can be used to take these measurements
The results can then be used to plot a population growth curve to show how the population of microorganism changes over time
Yeast population growth on a logarithmic scale graph

Turbidity measurements can be used to gain a measure of yeast population size over time; the resulting data can be plotted using a log scale to show exponential population growth
Modelling population growth curves using duckweed
Duckweed is a type of pond weed that grows on the surface of still bodies of fresh water
It is ideal for modelling population growth because it reproduces quickly and asexually, and newly produced fronds, also known as thalli (singular thallus), remain attached to the parent fronds in clusters, allowing for easy counting
Population growth can be modelled using duckweed as follows:
Place a small number of duckweed fronds into a petri dish that contains distilled water mixed with liquid fertiliser
Place the petri dishes in a brightly lit location, but out of direct sunlight
Record the number of duckweed fronds present after 1 week
Repeat the counting process once a week for a total of six weeks, topping up the dish with distilled water as needed
Plot the results on a graph to show a population growth curve

CC BY-SA 3.0, via Wikimedia Commons (opens in a new tab)
Duckweed grows on the surface of fresh water, and its easily distinguishable thalli can be easily counted in a laboratory setting

Unlock more, it's free!
Did this page help you?