Species Distribution: Skills (DP IB Biology) : Revision Note
Species Distribution: Limiting Factors
Limiting factors and range of tolerance
The term distribution refers to
Where a species is found within an ecosystem
The distribution of a species is influenced by limiting factors, which in this context means
Any biotic or abiotic factor that restricts the growth of organisms
Limiting factors will determine the range of tolerance, and therefore distribution, of a species, e.g. if soil water levels become severely limiting, then a plant species will be outside its range of tolerance and will no longer be able to survive in an area
Investigating the effect of limiting factors on species distribution
It is possible to investigate the effect of a limiting abiotic factor on the distribution of a species using transect sampling
A transect is used to measure the change in species abundance along an environmental gradient
This gives an estimate of distribution at different levels of the abiotic factor in question
E.g. if investigating the effect of soil water availability on the distribution of a plant species, the transect would be set up along a high to low soil water gradient, and plant abundance would be measured at different soil water levels
Sampling is a technique that involves taking measurements from a small area to represent the measurements that might be gained across a large area
Sampling saves time; it is not possible to count all of the individual organisms in a habitat
Samples must be representative of the whole; so a large enough sample size must be taken
Transects
Transects are lines laid out across a site that can be used to measure abundance and distribution across a habitat
Transects are useful for determining how species abundance and distribution might change along an environmental gradient e.g. at increasing distances from the water's edge on a rocky shore
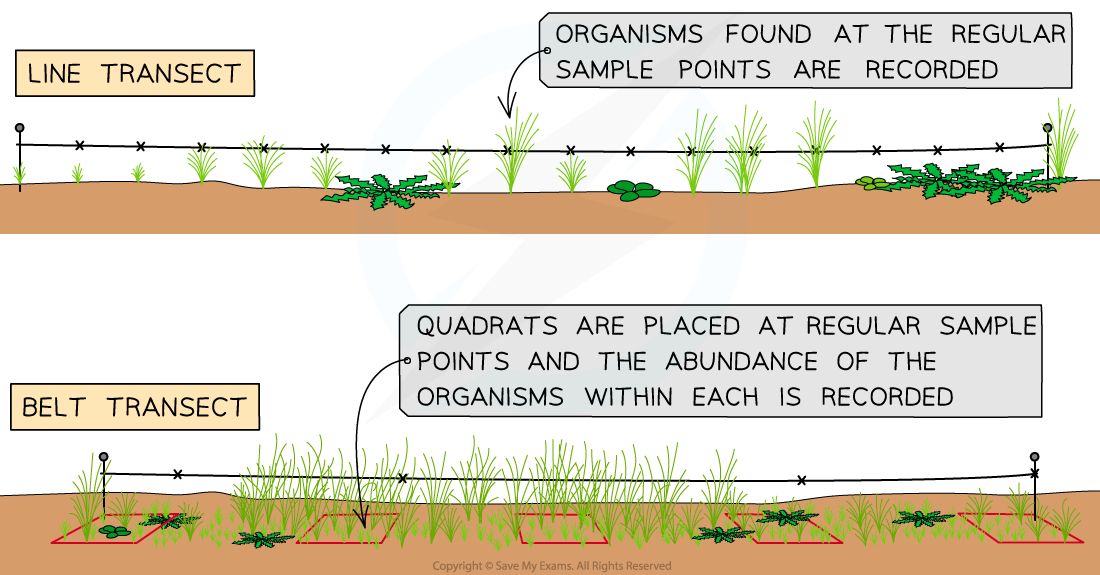
To carry out a transect, a tape measure is laid out along the gradient of interest, and samples are taken along the line
There are different ways of carrying out transect studies:
Continuous line transect
Every species touching the tape measure is recorded
Interrupted line transect
Species touching the line at regular intervals, e.g. every metre, are recorded
Continuous belt transect
Quadrats are placed end-to-end along the line
Interrupted belt transect
Quadrats are placed at regular intervals, e.g. every metre, along the line

Interrupted line and belt transects can be used to measure the distribution of species at different levels of an abiotic factor across a habitat
Measuring abiotic factors
When investigating the impact of an abiotic factor on species distribution it is important to measure the relevant abiotic factor at each sample site along the transect
It is only necessary to record relevant abiotic factors
A study may only be interested in one particular abiotic factor
Some abiotic factors may not be relevant in certain habitats, e.g. water turbidity (cloudiness) will not be relevant in a woodland habitat
Abiotic factors can be measured using specialised equipment and techniques
Measuring abiotic factors table
Abiotic factor | Method of measurement |
|---|---|
Air temperature | Thermometer |
Rainfall | Rain gauge; a funnel collects water in a measuring cylinder |
Humidity | Hydrometer; an electronic device that measures water vapour content of air |
Dissolved oxygen | Electronic oxygen sensor |
Water turbidity (cloudiness) | A turbidity meter measures light scattered by particles in the water, or a Secchi disc is lowered into the water until it is no longer visible and the depth recorded |
Light intensity | Electronic light meter |
Landscape relief (height of land) | Contour lines on a map or a GPS |
Site aspect (direction that site faces) | Compass |
Slope incline | Clinometer; a specialised protractor that allows angle to be calculated using trigonometry |
Soil or water pH | Indicator solution |
Soil water content | Difference in mass between a soil sample and the same soil sample after it has been dried |
Representing results
The results of an investigation into the distribution of organisms in response to an environmental gradient can be represented visually using a type of graph known as a kite diagram
Kite diagrams can show both distribution and abundance
The distribution of a species along a transect can be shown by its position along a central horizontal line in each section of a kite diagram
Each section represents a different species
The distance along the transect is given on the x-axis, to which the horizontal line is parallel
The abundance of a species can be shown by the width of the 'kite' around the central horizontal line
The shape is referred to as a kite because it extends an equal distance on each side of the central horizontal line
Additional sections can be added to a kite diagram to show the changes in abiotic factors at different points along a transect, e.g. the height above sea level or the pH of soil
Kite diagram

Kite diagrams can be used to provide a visual representation of both abundance and distribution of species, as well as changes to abiotic factors such as elevation
Examiner Tips and Tricks
You should be able to design and carry out a study that investigates the effect of a specific abiotic factor on the distribution of a species
This can be carried out in a:
Natural habitat
Semi-natural habitat, i.e. an area that has been influenced by human activity but still contains wild species
You should use sensors to measure abiotic factors

You've read 0 of your 5 free revision notes this week
Sign up now. It’s free!
Did this page help you?
