Types of Data (AQA AS Psychology): Revision Note
Syllabus Edition
First teaching 2015
Last exams 2025
Exam code: 7181

Quantitative data
Quantitative data is data in the form of numbers for example:
53 out of 125 participants answered 'yes' to this question
89% of participants were slower in condition A
there is a -0.4 correlation coefficient in this study
Quantitative data can be transformed into tables, graphs, charts, percentages, fractions etc.
Quantitative data can be statistically analysed using statistics e.g.
mean, mode, range (descriptive statistics)
Mann-Whitney test, Spearman's rho, related-t test (inferential statistics)
Research methods that tend to generate quantitative data include
experiments e.g. scores on a memory test per condition
observations e.g. tally charts that record frequencies of specific behaviours
correlations e.g. a correlation coefficient of +0.7
questionnaires/surveys via the use of closed questions
Examiner Tips and Tricks
Note that you will only be asked about inferential statistics for the A Level component of the exam, not AS.
Evaluation of quantitative data
Strengths
Quantitative data tends to be reliable as it is easy to analyse and compare
This is because the techniques used to collect it tend to be replicable e.g.
standardised procedures, correlational analysis, meta-analysis
Quantitative data can highlight trends and patterns which is useful when researchers wish to apply general laws of behaviour
Limitations
Quantitative data can reveal the what behind a behaviour but not the why
This means that it lacks explanatory power
Thus it is low in validity
Quantitative data tends to over-simplify the complex, multi-faceted nature of human behaviour and experience
This limits its usefulness as a means of gaining insight into people's motives, dreams, fears etc.
Qualitative data
Qualitative data is data in the form of words or images e.g.
thoughts and feelings expressed in a diary or journal
feelings, attitudes/ideas/beliefs discussed in an interview
a painting created to express inner turmoil/conflict/anxiety
a focus group interview on the impact of social media on body image
Qualitative research methods/techniques include
interviews (individual or focus group)
diary entries
naturalistic observations
open-ended questions
Qualitative data can be analysed using content analysis or thematic analysis which generates both quantitative and qualitative findings respectively
Evaluation of qualitative data
Strengths
Qualitative data allows researchers to gain insight into the nature of individual experience and meaning
This makes it high in ecological validity
Qualitative data can be used to expand on and deepen knowledge of complex behaviours e.g.
The case of HM involved a man with extreme memory loss
The interviews and observations of HM shed light on and helped to confirm the quantitative results e.g. memory tests
Limitations
Qualitative techniques tend to use small sample sizes
This means that the results are difficult to generalise to a wider population
The subjective nature of qualitative methods does not embrace the features of science (e.g. a lack of objectivity and control)
This means that qualitative data lacks reliability
Primary data
Primary data is collected at the source e.g.
a researcher collects two sets of scores (from condition 1 and condition 2) after running an experiment
a researcher conducts a questionnaire from which they are able to analyse a range of responses
Primary data refers specifically to the research aim e.g.
Loftus & Palmer (1974) collected data in the form of speed estimates based on their manipulation of key verbs to test the reliability of eyewitness testimony
Primary data has not been previously published
Evaluation of primary data
Strengths
Primary data may be more reliable and valid than secondary data as the researcher has full control over how the data is collected
Primary data may be more trustworthy than secondary data
The researcher knows that their research will be subjected to a peer review which, if negative, would harm their reputation
Thus it makes sense for the researcher to take the necessary care to present the best-designed and delivered study possible
Limitations
Primary data is derived from a single study compared to secondary data which can amass huge samples
This limits the potential statistical power of the primary data
Primary research is expensive and time-consuming compared to the use of secondary data which can be gathered very quickly
If the researcher does not find a significant result then they may feel that the time and money spent on the research was wasted
Secondary data
Secondary data consists of any research findings/results which are pre-existing
They have not been collected at source; it is not original data
Secondary data is that which has been obtained by other researchers who will each have been working to achieve their specific aim
Secondary data has been previously published
Secondary data allows a non-interested researcher (meaning they were not involved in the original research process) to gain a clear overview of the topic
Secondary data is derived from multiple sources e.g.
a meta-analysis consists of the quantitative findings of a range of research studies on the same topic e.g.
Smith & Bond (1996) conducted a meta-analysis of cross-cultural replications of Asch's conformity study
Evaluation of secondary data
Strengths
The research studies used in secondary data techniques such as meta-analysis have already been peer-reviewed and the significance of each study has already been established
This means that time and money have not been wasted and the researchers can have confidence in the data
Secondary data may provide new insight into existing theories and research
As several studies on the same topic are analysed this allows the researcher to see patterns, trends or interesting features that are unlikely to emerge with the analysis of just one study
Limitations
Secondary data may not directly address the aim or the topic of the research
The researcher's lack of familiarity with the data means that they misinterpret some aspects of the original research
This would affect the validity of the secondary data
As the researcher has not run the original studies themselves they do not know the degree of control and rigour exercised by the original researcher
This lack of control affects the reliability of the data
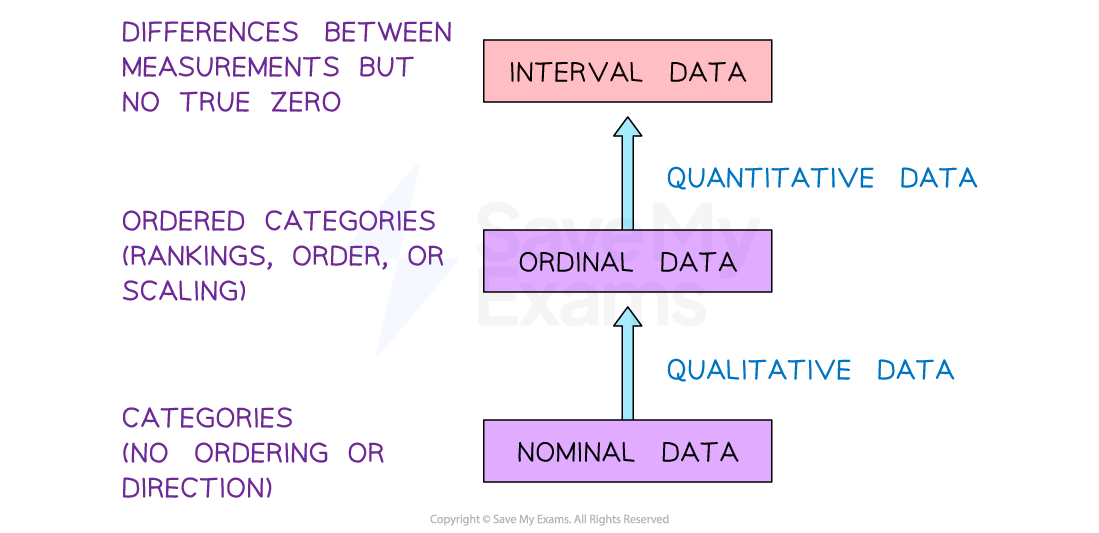
Nominal, ordinal & interval
When carrying out research, psychologists collect data
Much research in psychology generates quantitative data
The data collected varies in how precise it is
Levels of measurement (LOM) refer to these differences in precision
It is important to assess the level of measurement of a particular set of data because this will determine how it can be analysed statistically
Nominal data
Nominal data is the most basic LOM
It is used when data is put into categories; for this reason it is sometimes referred to as categoric data e.g.
number of people who chose a high-fat snack/people who chose a low-fat snack
Nominal data provides very little detailed information or insight as it is a head-count
It only tells the researcher how many people are in a group or how many times a specific behaviour occurred
Tally chart as an example of the use of nominal data to define specific behavioural categories in an observation:
Behaviour | Tally |
|---|---|
Clenches fist |
|
Frowns |
|
Crosses arms |
|
Raises eyebrows |
|
Ordinal data
Ordinal data is used when participant scores can be arranged in order e.g.
1st 2nd, 3rd in terms of the ranking of scores e.g.
the highest score was 18 out of 20 (this is given the rank of 1); the second highest score was 15 (this is given the rank of 2) etc
Ordinal data refers to quantities that make sense in terms of who is in the group when the test was conducted or the choices were made e.g.
the ranking of favourite films, people's places in a queue, the finishing order of runners in a marathon, the choice of item on a rating scale from 1 to 7
Ordinal data provides no certainty as to the intervals between each value
The units of measurement between each score (the intervals) are not of equal, definable size e.g.
the highest score was 18, followed by 15 (an interval of 3), followed by 14 (an interval of 1), followed by 10 (an interval of 4) etc.
Ordinal data cannot tell the researcher what the gap is between 1st and 2nd, or between 4th and 5th rank
On a 7-point scale, the difference between 6 and 7 is not necessarily the same difference as the difference between a 2 and 3 as the rating is subjective
One person’s rating of 6 may mean something else to another person, it may be their version of a 5
Interval data
Interval data provides the most sensitive and sophisticated level of measurement
There is an equal interval between each unit of measurement e.g.
centimetres (the gap between 2 and 3 cm is the same as the gap between 10 and 11 cm)
timings (the gap between 1 and 3 seconds is exactly double the gap between 1 and 2 seconds)
Interval data can be converted to ordinal data as the interval values can then be ranked e.g.
Tuesday was the hottest day at 25o then it was Friday with 22o, then Wednesday with 21o
Temperature is interval data
Ordinal data cannot be converted to interval data as it does not assume equal intervals between scores/values
Rating scales rarely use interval data, even if the points on the scale are of equal intervals
This is because there is no absolute, agreed value to each score due to the subjective nature of scoring a rating scale
The value zero does not mean 'nothing' in terms of interval data, it is just another measurement on the scale e.g.
0oC does not mean that there is no temperature, it refers to the freezing point
Zero does not figure as a measurement when using ordinal data as it means 'nothing' i.e. 'did not place/rank/do anything'
Summary
Nominal data is arranged into categories
Ordinal data is can be ranked without each value being equal in measurement
Interval data has equal intervals between each value

Unlock more, it's free!
Join the 100,000+ Students that ❤️ Save My Exams
the (exam) results speak for themselves:

Was this revision note helpful?