Syllabus Edition
First teaching 2015
Last exams 2025
Measures of Central Tendency (AQA AS Psychology): Revision Note
Exam code: 7181

Mean
Measures of central tendency describe the central or typical value of a data set
Measures of central tendency are used to summarise large amounts of data into typical mid-point scores
There are three measures of central tendency
the mean
the median
the mode
The mean calculates the average score of a data set
The mean indicates what a researcher would expect to find (as the average score) if they were to replicate the procedure of a given study
The mean is calculated using the total score of all the values in the data set divided by the number of values in that set
Example of the mean
To calculate the mean of 4, 6, 7, 9 add up the values and then divide this total by the number of values
4 + 6 + 7 + 9 = 26
26 ÷ 4 = 6.5
mean = 6.5
Evaluation of the mean
Strengths
The mean is the most sensitive measure of central tendency as it takes all scores in the data set into account
The mean is more likely than other measures of central tendency to provide a representative score
This means that it is the most reliable measure of central tendency
Limitations
The mean is sensitive to extreme scores (outliers) so it can only be used when the scores are reasonably close
This means that it would not be a suitable measure for some data sets
The mean score may not be represented in the data set itself
In the example provided above, the mean is 6.5 which does not appear in the original data set itself
Median
The median calculates the middle value of a data set (the positional average)
The data has to be arranged into numerical order first (with the lowest score at the beginning of the list),
Example of the median
For an odd number of values
To calculate the median of 20, 43, 56, 78, 92, 67, 48 take the halfway point as the data set has an odd number of scores (7)
20, 43, 56, 78, 92, 67, 48 is ordered into 20, 43, 48, 56, 67,78, 92
Median = 56 as this is the value at the halfway point in the set
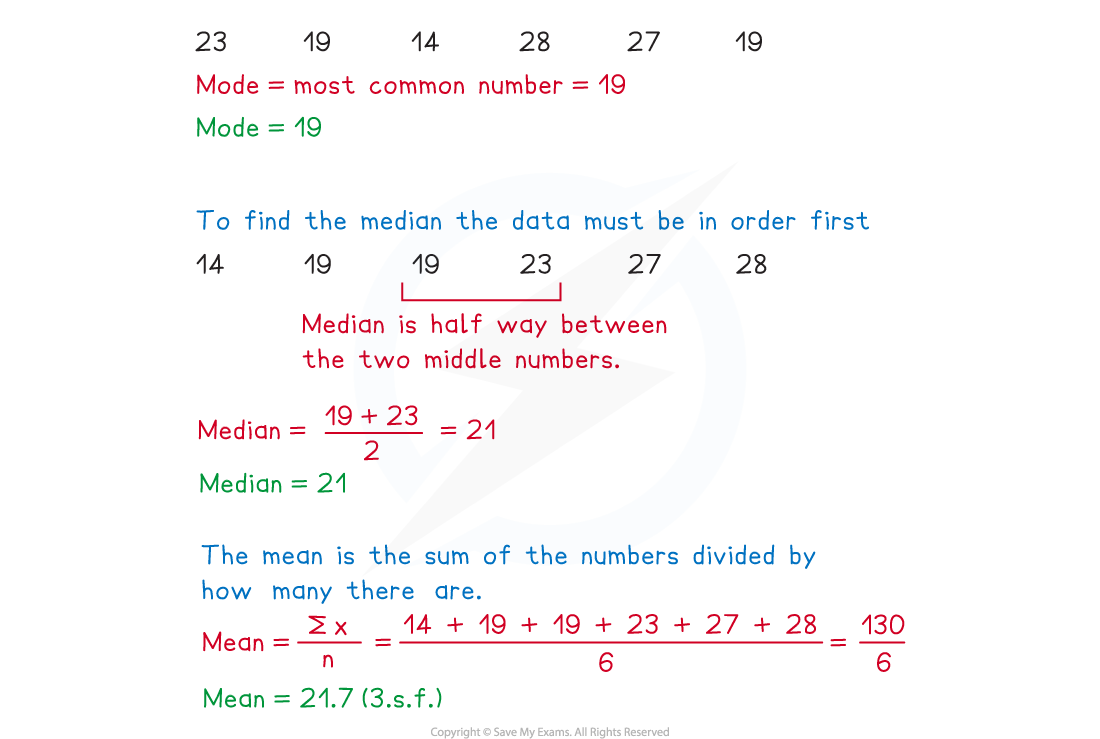
For an even number of values, there are two values at the halfway point
E.g. 15, 16, 18, 19, 22, 24
The halfway point is between 18 and 19
Add the two middle values (18 + 19 = 37)
Divide the total by 2 (37 divided by 2 = 18.5)
Thus, the median = 18.5
Evaluation of the median
Strengths
The median is not affected by extreme scores
This means that it can be used on data sets with anomalous scores
The median is the best measure of central tendency when dealing with qualitative data where ranking of categories or themes is used instead of measurement or counting
Limitations
The median does not necessarily represent a typical average as it does not include all of the data in its calculation
It does not account for extreme scores making it less reliable than the mean
Arranging the data in ascending or descending order is time-consuming
This makes the median more problematic in dealing with large data sets
Mode
The mode calculates the most frequently occurring score in a data set
Mode means most often
The mode identifies the most common score(s) in a data set
Some data sets may have:
no mode
two modes (known as bi-modal)
more than two modes (known as multi-modal)
The mode is used when the researcher cannot use the mean or the median e.g.
a researcher wishes to measure how many times litter is dropped in a naturalistic observation
The only measure of central tendency applicable to this research is the mode as it measures frequency rather than average score or middle value
Example of the mode
To calculate the mode of 3, 3, 3, 4, 4, 5, 6, 6, 6, 6, 7, 8 count the number of times each score appears in the data set
The most frequently occurring number is 6
Thus, the mode = 6
Evaluation of the mode
Strengths
The mode is not affected by extreme values
The mode is often useful for the analysis of qualitative data
This type of data may require frequencies of theme to be analysed
Limitations
A data set may include two modes or more which blurs the meaning of the data, making it difficult for the researcher to form conclusions
This means that the mode is the least reliable of the measures of central tendency
The mode is likely to be of little use on small data sets as it may provide an unrepresentative central measure e.g.
A data set may include a mode of 73 when in fact the average score in that set is 55
This means that the mode may lack validity
Examiner Tips and Tricks
You might be asked what the values of a specific measure of central tendency suggest e.g.
'What do the mean values in this data set suggest about the effectiveness of anti-depressant drugs in reducing depression?' [2 marks]
In the case of a question such as this one, you would have to justify your answer in terms of the topic e.g.
'The mean values in this data set suggest that anti-depressant drugs are less effective than CBT in reducing depression'. [1 mark]
You would also have to provide an accurate justification for the difference in the mean scores e.g.
'The mean score for CBT is 34 whereas the mean score for anti-depressants is 28, which highlights the difference in effectiveness of each therapy.' [1 mark]

You've read 0 of your 5 free revision notes this week
Unlock more, it's free!
Did this page help you?