Displacement & Velocity-Time Graphs (OCR AS Physics): Revision Note
Exam code: H156

Displacement-Time Graphs
Displacement-time graphs show the changing position of an object in motion
They also show whether an object is moving forward (positive displacement) or backwards (negative displacement)
velocity = gradient of a displacement-time graph
The greater the slope, the greater the velocity
A negative gradient = a negative velocity (the object is moving backwards)
Worked Example
A car driver sees a hazard ahead and applies the brakes to bring the car to a stop.

What does the displacement-time graph look like?
Answer:
When the velocity-time graph is a horizontal line, this means constant velocity
This is a straight, diagonal line on a displacement-time graph
When the velocity-time graph is a diagonal line towards, this means decreasing velocity (deceleration)
This is a curve with a decreasing gradient on a displacement-time graph

Examiner Tips and Tricks
Don’t forget that velocity is a vector quantity; it has a size and a direction. If velocity is initially positive and then becomes negative, then the object has changed direction.
Velocity-Time Graphs
Velocity-time graphs show the speed and direction of an object in motion over a specific period of time
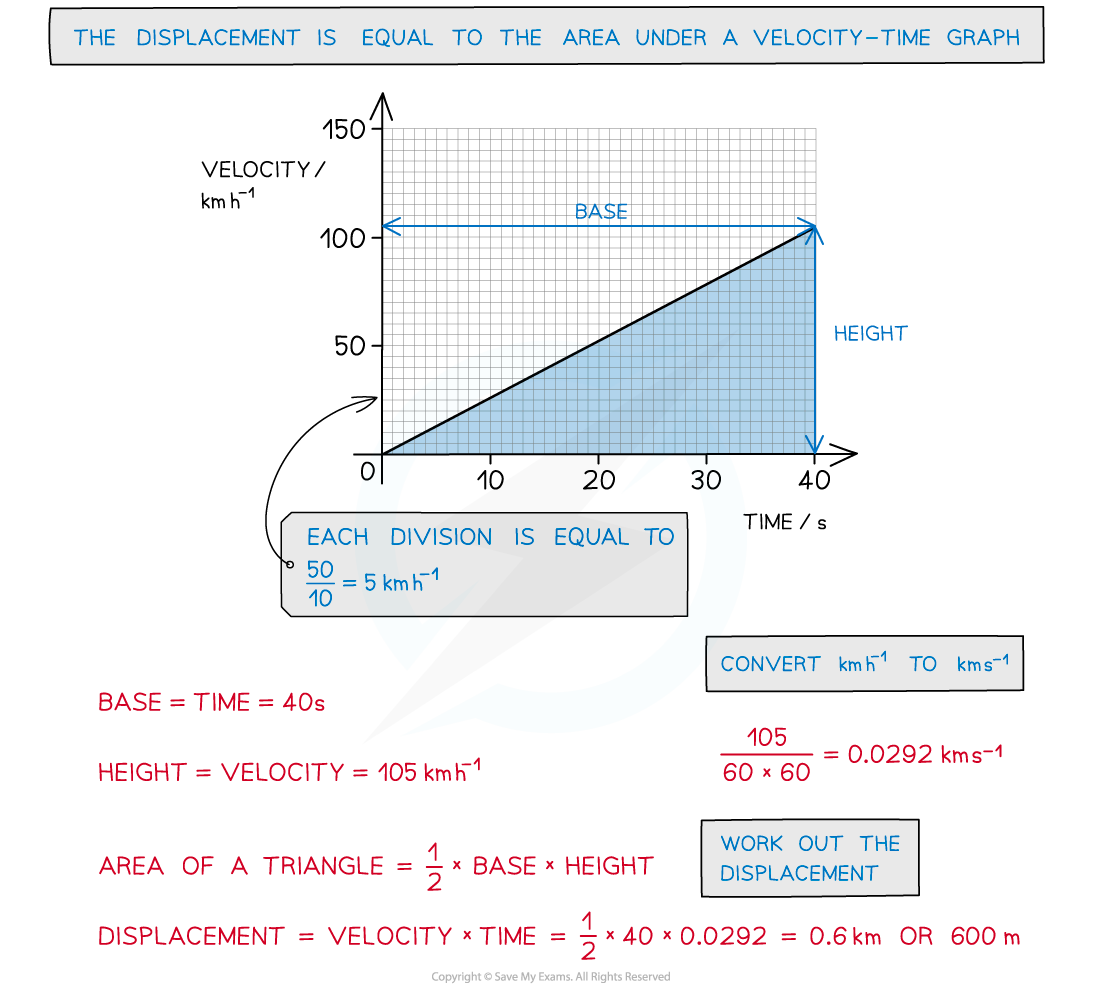
The area under a velocity-time graph is equal to the displacement of a moving object
displacement = area under a velocity-time graph
Acceleration is any change in the velocity of an object in a given time
As velocity is a vector quantity, this means that if the speed of an object changes, or its direction changes, then it is accelerating
An object that slows down tends to be described as ‘decelerating’
acceleration = gradient of a velocity-time graph
Motion of a bouncing ball
For a bouncing ball, the acceleration due to gravity is always in the same direction (in a uniform gravitational field such as the Earth's surface)
This is assuming there are no other forces on the ball, such as air resistance
Since the ball changes its direction when it reaches its highest and lowest point, the direction of the velocity will change at these points
The vector nature of velocity means the ball will sometimes have a:
positive velocity if it is travelling in the positive direction
negative velocity if it is travelling in the negative direction
An example could be a ball bouncing from the ground back upwards and back down again
The positive direction is taken as upwards
This will be either stated in the question or can be chosen, as long as the direction is consistent throughout
Ignoring the effect of air resistance, the ball will reach the same height every time before bouncing from the ground again
When the ball is travelling upwards, it has a positive velocity which slowly decreases (decelerates) until it reaches its highest point
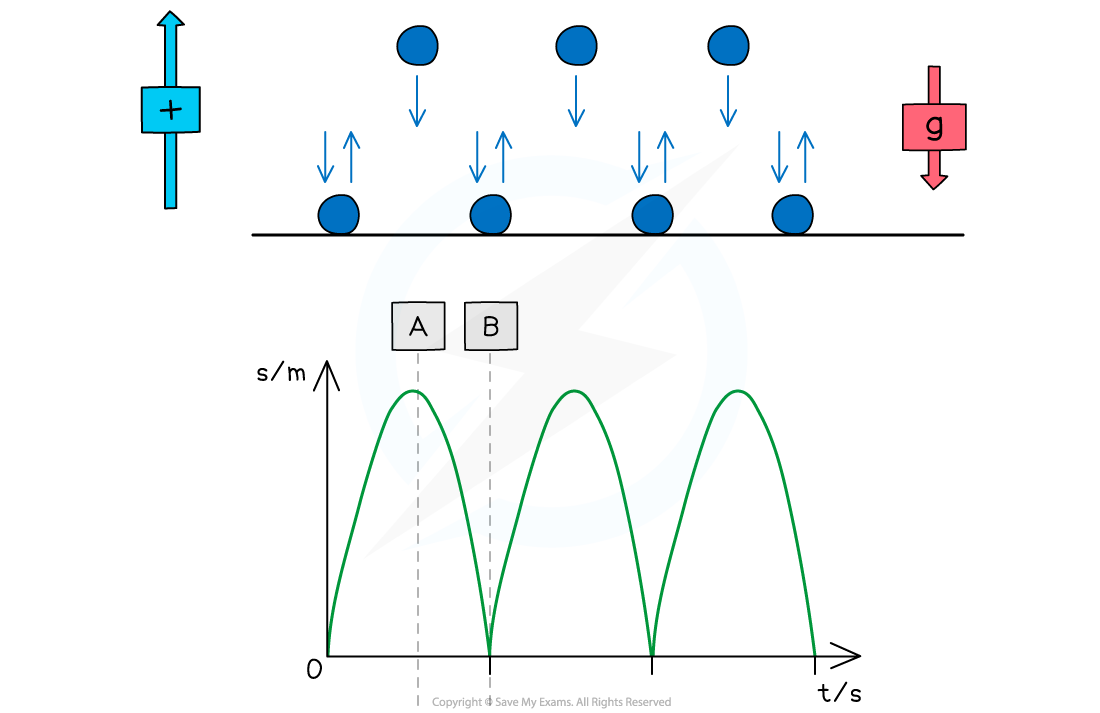
At point A (the highest point):
The ball is at its maximum displacement
The ball momentarily has zero velocity
The velocity changes from positive to negative as the ball changes direction
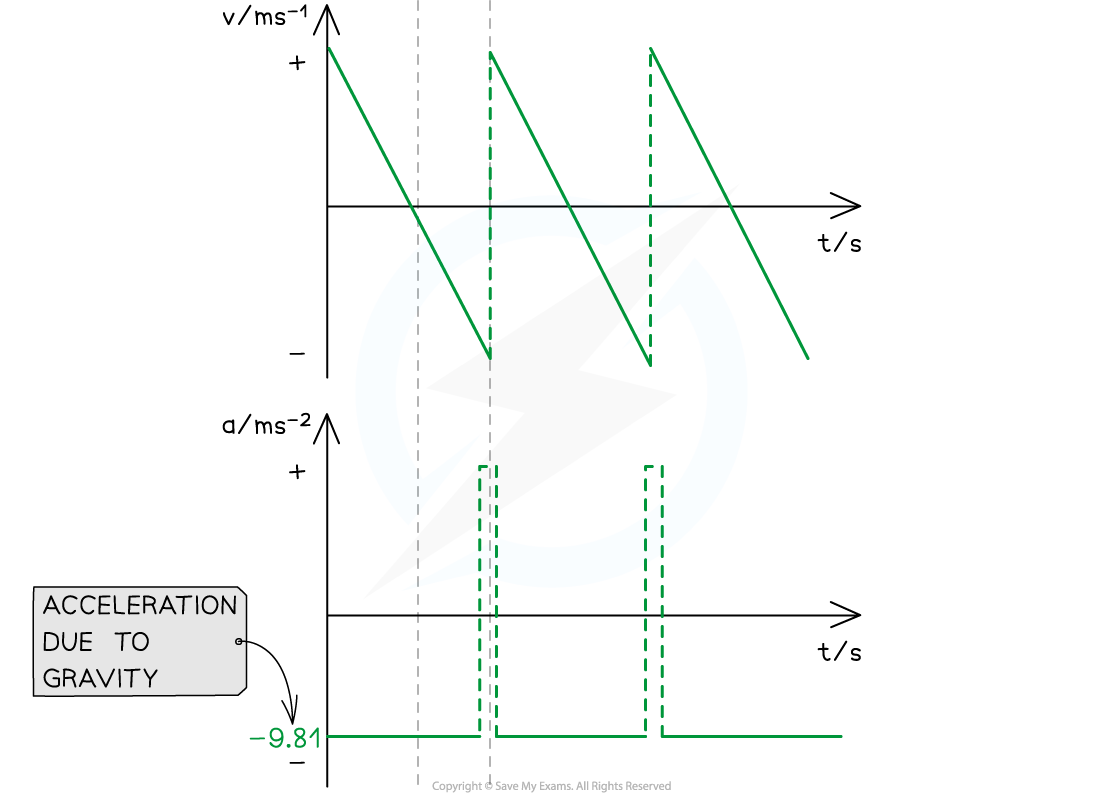
The acceleration, g, is still constant and directed vertically downwards
At point B (the lowest point):
The ball is at its minimum displacement (on the ground)
Its velocity changes instantaneously from negative to positive, but its speed (magnitude) remains the same
The change in direction causes a momentary acceleration (since acceleration = change in velocity / time)
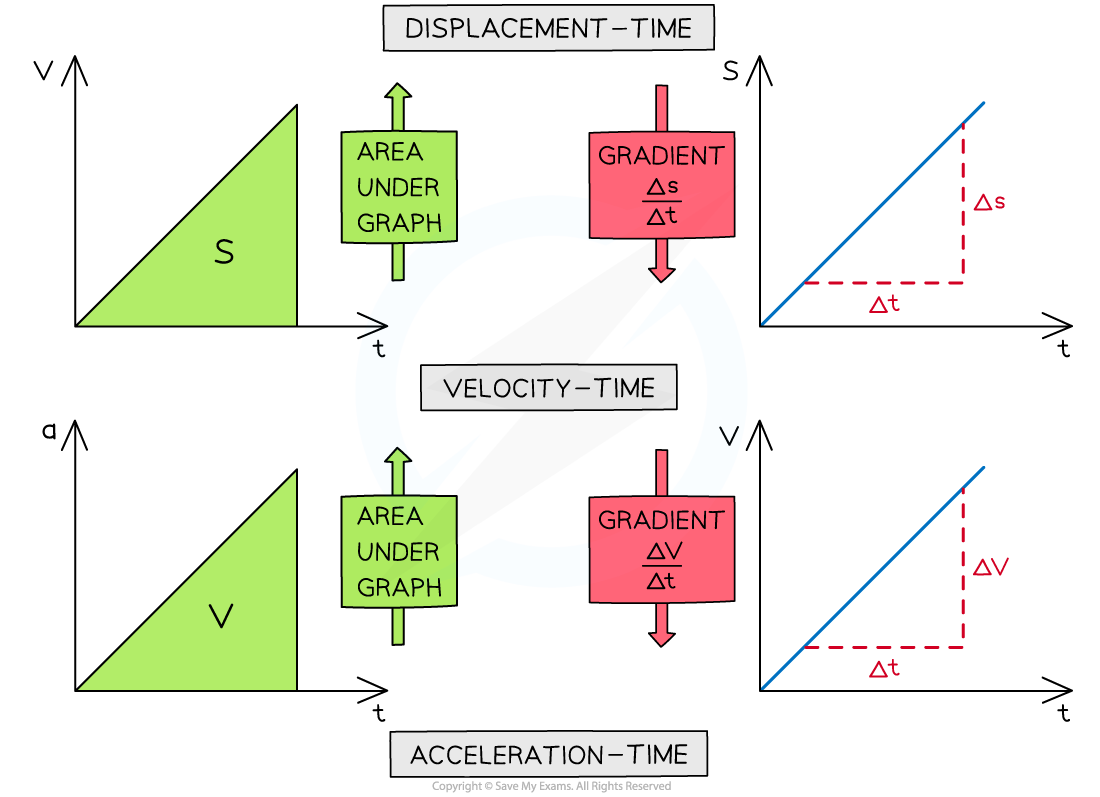
Summary of Gradients & Areas
The gradient of a displacement-time graph is the velocity
The gradient of a velocity-time graph is the acceleration
The area under a velocity-time graph is the displacement
The area under an acceleration-time graph is the velocity
Worked Example
The velocity-time graph of a vehicle travelling with uniform acceleration is shown in the diagram below.
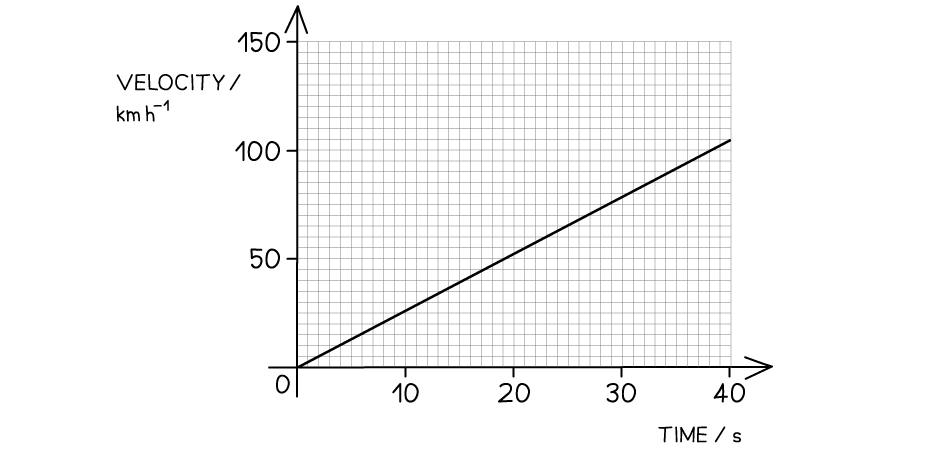
Calculate the displacement of the vehicle at 40 s.
Answer:
Examiner Tips and Tricks
Always check the values given on the y-axis of a motion graph - students often confuse displacement-time graphs and velocity-time graphs. The area under the graph can often be broken down into triangles, squares and rectangles, so make sure you are comfortable with calculating area!

Unlock more, it's free!
Join the 100,000+ Students that ❤️ Save My Exams
the (exam) results speak for themselves:

Was this revision note helpful?
Build on this topic