Evaluating Results & Drawing Conclusions (OCR AS Physics): Revision Note
Exam code: H156

Evaluating Results & Drawing Conclusions
Evaluating experimental results and drawing conclusions from them are two very important skills
Evaluation of results is a different skill from evaluation of the experimental procedure used to obtain those results
Conclusions can only be drawn from the results once they have been properly evaluated
For example, during the planning of an experiment, potential limitations of the experimental procedure should have already been identified
Before drawing conclusions, the impact that these limitations could theoretically have had (or may actually have had) on the data collected should be evaluated
If this evaluation shows these potential impacts to be negligible, a conclusion can more likely be drawn from the results
If it is decided that the limitations could have had a significant impact on the data, then it is much harder to draw a conclusion and it should be recognised that any conclusions drawn have a greater chance of being incorrect
Identifying Anomalies
Experimental errors (also known as operator errors or ‘one off’ errors) will affect the results of an experiment and can produce anomalies
These anomalies should be identified during the evaluation of results and before drawing conclusions
Anomalies can be identified by looking for results or data points on a graph that do not fit with the trend or with other replicates carried out during the experiment
These anomalous results will show a larger difference from the mean than the rest of the results (a result is often taken to be anomalous if it differs from the mean result by more than 10%)
The results or ‘data’ collected from an experiment can be made more reliable if the experiment is repeated several times and anomalies are removed
This, in turn, allows more valid conclusions to be drawn
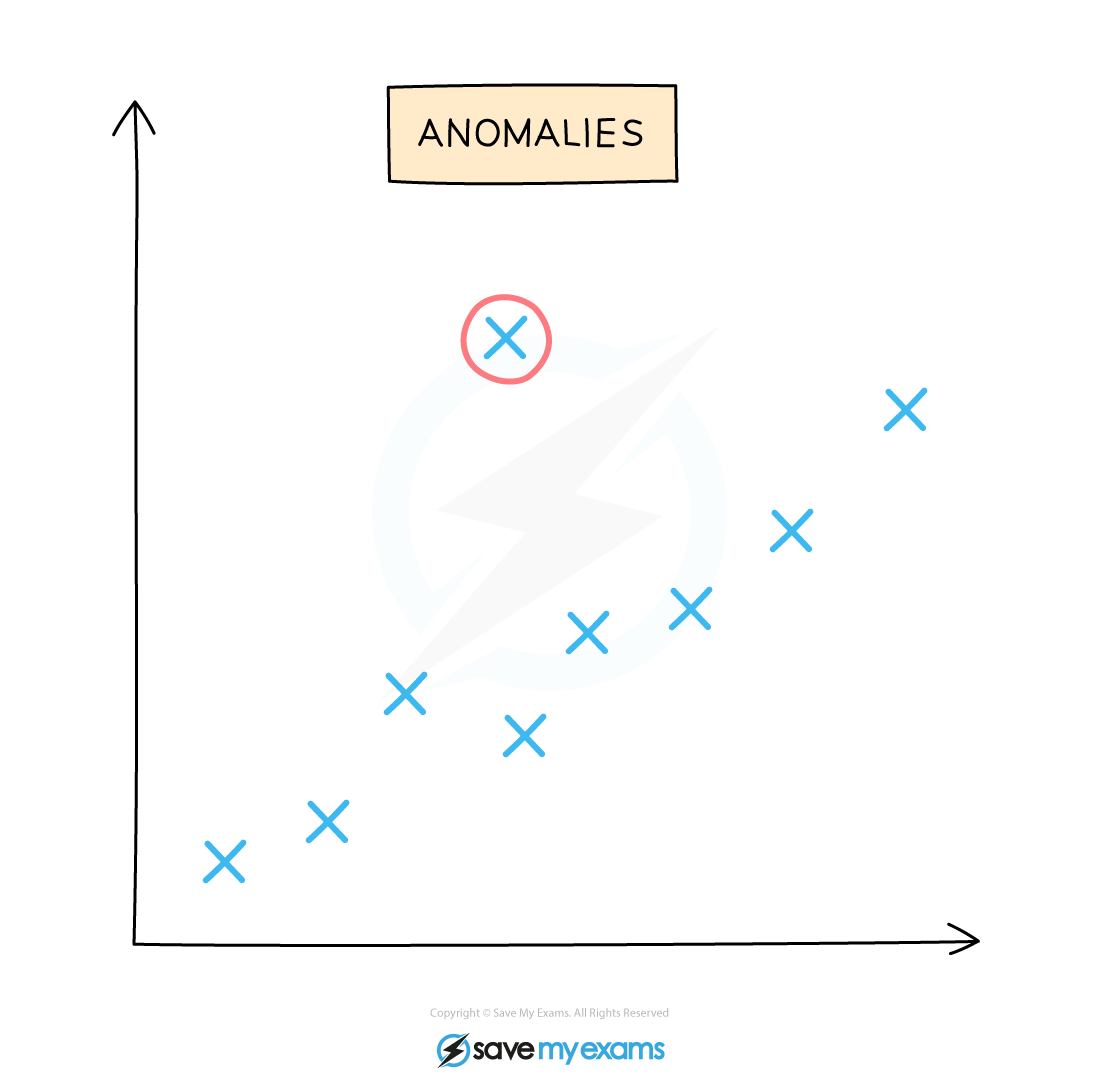
Identifying an anomalous result from a graph
If an anomaly occurs in the experiment:
Ignore this value when calculating the mean
Repeat this measurement

Unlock more, it's free!
Join the 100,000+ Students that ❤️ Save My Exams
the (exam) results speak for themselves:

Was this revision note helpful?
Build on this topic