Area under a Velocity-Time Graph (Cambridge (CIE) AS Physics): Revision Note
Exam code: 9702
Area under a velocity-time graph
Velocity-time graphs show the speed and direction of an object in motion over a specific period of time
The area under a velocity-time graph is equal to the displacement of a moving object
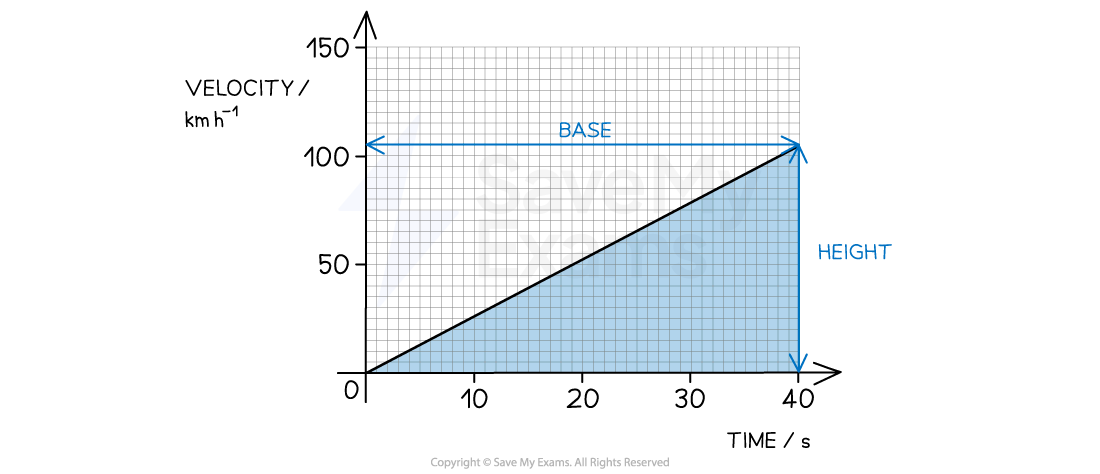
The area under a graph can be sectioned into triangles and rectangles to make the calculations easier
The area of a triangle can be found with the following formula:
The area of a rectangle can be found with the following formula:
Where:
= area
= length of base
= height
Worked Example
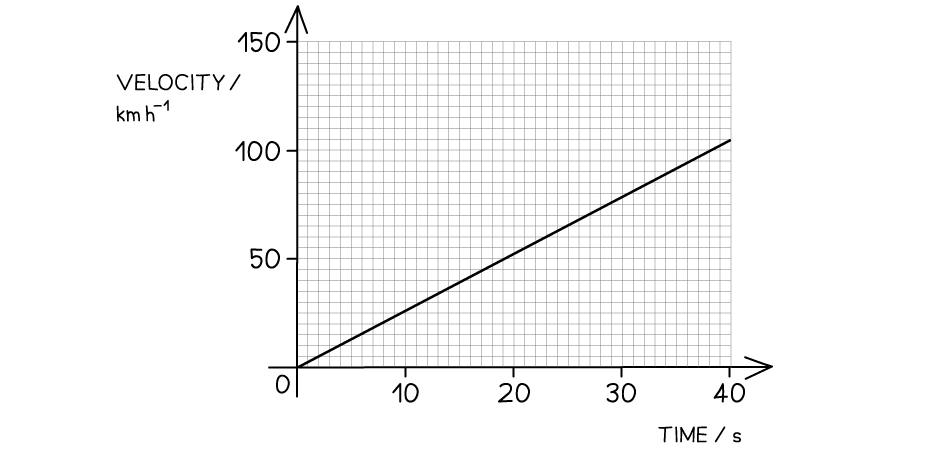
The velocity-time graph of a vehicle travelling with uniform acceleration is shown in the diagram below.

Calculate the displacement of the vehicle at 40 s.
Answer:
Step 1: State how to determine the displacement
The displacement is equal to the area under a velocity-time graph
Step 2: Determine the scale on the graph
Each division is

Step 3: Determine the base and height of the graph
Time = base = 40 s
Velocity = height = 105 km h–1
Step 4: Convert km h-1 into km s–1
Step 5: Calculate the area under the graph
Area of a right-angled triangle =
Examiner Tips and Tricks
Always check the values given on the y-axis of a motion graph - students often confuse displacement-time graphs and velocity-time graphs.

Unlock more, it's free!
Did this page help you?