Limitation of Physical Measurements (AQA AS Physics)

Exam Questions

3 hours44 questions
1a3 marks

State clearly the definition of: 

            (i)         A random error

             (ii)        A systematic error

             (iii)       An anomalous result  

1b2 marks

Figure 1 shows part of a thermometer.

Figure 1

1-2-s-q--q1b-easy-aqa-a-level-physics

Determine the correct reading on the thermometer with its absolute uncertainty.


1c1 mark

A student measures the time taken for water at 0 ºC to boil to 100 ºC. Figure 2 shows the graph of the temperature against time.

Figure 2
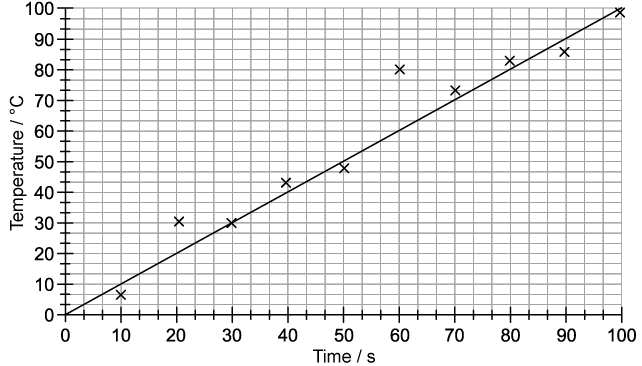
1-2-s-q--q1c-easy-aqa-a-level-physicsCircle the anomalous result on graph in Figure 2.

1d3 marks

State and explain whether the graph in Figure 2 demonstrate systematic or random errors. Suggest one way to reduce this type of error.

Did this page help you?

2a2 marks

State which two measurements a micrometer screw gauge would be used to measure:

  • The diameter of a thin wire (wire gauge)
  • The length of a pencil
  • The thickness of a sheet of paper
  • The thickness of a water pipe
2b3 marks

A student records 5 repeat readings using a micrometer screw gauge in mm shown in Table 1.

Table 1

1.24

1.23

1.27

1.19

1.20

Calculate the average of the readings in Table 1. Give your answer to an appropriate number of significant figures.

2c2 marks

Give two reasons why taking repeat readings provides more accurate data.

2d3 marks

Another student repeats the same experiment using a micrometer screw gauge and obtains an average value of 1.53 ± 0.03 mm.

Calculate the percentage uncertainty in this student’s average to the appropriate number of significant figures.

Did this page help you?

3a2 marks

Figure 3 shows part of an ammeter.

Figure 3

1-2-s-q--q3a--answer-easy-aqa-a-level-physics

Determine the correct reading on the ammeter in Figure 3 with its absolute uncertainty.


3b2 marks

An experiment is set up to check whether a particular resistor obeys Ohm’s Law.

A student uses a variable digital voltmeter of precision of 0.1 V and an analogue ammeter of precision 0.01 A.

They vary the potential difference through the circuit and record the ammeter reading. The resistance is calculated from the ratio of potential difference and current.

The table of results is shown in Table 1.

Table 1

V / V

A / A

R / Ω

0.5

0.05

10

1.0

0.1

10

1.5

0.15

10

2.0

0.2

10

2.5

0.25

10

3.0

0.3

10


State the independent and dependent variable of this experiment. 


3c3 marks

Correct the errors in the way the ammeter readings have been recorded.

3d2 marks

State precautions the student should take to reduce the effect of systematic and random errors in this experiment.

Did this page help you?

4a2 marks

State clearly the difference between precise and accurate measurements.

4b1 mark

Define the resolution of a measuring instrument.   

4c5 marks

A student uses a stopwatch to measure the time taken for one complete swing of a pendulum.

 They determine the time taken for 10 complete swings to be 8.4 ± 0.1 s.

Calculate the mean time for one complete swing with its absolute uncertainty and a percentage uncertainty.

Give your answer to an appropriate number of significant figures.

4d1 mark

There are some occasions where the resolution of an instrument is not the limiting factor of uncertainty in a measurement.

State one another limiting factor that affects the uncertainty in the time measured from a stopwatch.


Did this page help you?

5a5 marks

A vernier calliper has a systematic zero error of + 0.10 mm.

A student uses the vernier calliper to measure the length of a wire under various loads and records the data in a table shown in Table 1. 

Table 1

Load / N

Length / mm

1.00

3.00

1.50

3.54

2.00

4.02

2.50

4.61

3.00

4.99


Determine the correct readings of the length of wire in mm for each load.


5b2 marks

The student specifically wants to determine the extension of the wire after each load is applied.

 A portion of the results table is shown in Table 2.

                  Table 2

Load / N

Length / mm

1.00

3.00

1.50

3.54


The vernier calliper scales have an uncertainty of ± 0.01 mm

Calculate the extension of the wire and its absolute uncertainty from the data shown in Figure 2.


5c3 marks

Another student decides to use a ruler to measure the length of the wire for each load and records the data in a table shown in Table 3.

                Table 3

Load / N

Length / mm

1.00

3.00

1.50

4.00

2.00

4.00

2.50

5.00

3.00

5.00


The ruler has an uncertainty of ± 1.00 mm.

Calculate the percentage uncertainty in the length of the wire using a ruler when a load of 2.50 N is applied.


5d2 marks

The student using the vernier calliper to measure the length of the wire obtained a length of 4.61 ± 0.01mm when a load 2.50 N was applied

They state the percentage uncertainly in this length is 0.22 %.

State and explain whether or not the student is correct.

Did this page help you?

1a4 marks

Figure 1 shows the reading on a micrometer screw gauge.

Figure 1

q1a-limitation-of-physical-measurements-medium-a-level-aqa-physics

Determine the full reading on the micrometer with its absolute uncertainty.


1b3 marks

A student measures and records 10 repeat readings of the diameter of a wire using a micrometer screw gauge in mm shown in Table 1.

                              Table 1

1.24

1.23

1.25

1.19

1.20

1.22

1.24

1.20

1.23

1.19


Determine the mean diameter of the wire and its absolute uncertainty.
1c2 marks

Determine the percentage uncertainty in the result the student obtains for the diameter of the wire.

 Give your answer to an appropriate number of significant figures.

1d3 marks

For the experiment, the student requires the cross-sectional area of the wire.

Determine the cross-sectional area of the wire in mm2 and its percentage uncertainty.


Did this page help you?

2a4 marks

Figure 1 shows the reading on a vernier calliper.

Figure 1

ZAWX4kON_1-2-s-q--q2a-medium-aqa-a-level-physics

Determine the full reading of the vernier calliper with its absolute uncertainty. 
2b3 marks

The reading from part (a) is taken after a mass has been added to a copper wire of length L and the wire extends.

 The original length of the wire L­ was 14.9 ± 0.05 mm.

Calculate the extension ∆L of the copper wire after the mass has been added with its absolute uncertainty.      
2c4 marks

Tensile strain is defined as the ratio between the extension of the wire and its original length.

Hence, or otherwise, determine the tensile strain of the copper wire and its percentage uncertainty.


2d1 mark

Suggest one way to improve the experiment to make the value of the wire extension more accurate.

Did this page help you?

3a4 marks

A student participates in an experiment to measure the Earth’s gravitational field strength g. This is done using a simple pendulum.  

The student suggests the period of oscillation T is related to length of the pendulum L and by the equation:

             T = 2πsquare root of L over g end root

They measure length L to be 11.2 cm and measure the period T ten times. The results are recorded in Table 1

                          Table 1

0.67

0.66

0.67

0.68

0.69

0.64

0.66

0.65

0.68

0.65

Determine the mean period of oscillation and its percentage uncertainty.
   
3b1 mark

State one way the student could reduce the uncertainty in their value of T.

3c4 marks

The student estimates the uncertainty on the measurement of L to be ± 15 mm.

Hence, or otherwise, use your answer from part (a) to determine the percentage uncertainty in the value of g.


3d3 marks

Hence, or otherwise, use your answer from part (c) to determine the value and absolute uncertainty in the value of g.

Give your answer to an appropriate unit and number of significant figures.

Did this page help you?

4a4 marks

Rearrange the following currents according to decreasing percentage uncertainty:

   4.1 ± 0.2 A,     5 ± 1 mA,        7.30 ± 0.23 A,      0.5 ± 0.05 mA

4b2 marks

A circuit is set up to measure the resistance R of a resistor. The potential difference (p.d) V across the resistor and the current I are measured.

 The readings for the p. d V and the corresponding current I are obtained. These are shown in Figure 1.

Figure 1

1-2-s-q--q4b-medium-aqa-a-level-physics

Explain how Figure 1 indicates that the readings are subject to a systematic uncertainty and random uncertainties.

4c2 marks

State one way a systematic error could have occurred in this experiment and how this type of error can be fixed.

4d4 marks

In another experiment, the resistance of the resistor R is determined using the following data:     

         Current, I = 0.74 ± 0.01 A 

      Potential difference, V = 6.5 ± 0.2 V

Calculate the value of R, together with its percentage uncertainty. Give your answer to an appropriate number of significant figures.

Did this page help you?

5a2 marks

A student has a diffraction grating that is marked 2.9 × 103 lines per m.

Calculate the percentage uncertainty in the number of lines per metre suggested by this marking. 

Give your answer to an appropriate number of significant figures.

5b3 marks

Determine the grating spacing and its absolute uncertainty in mm.

5c3 marks

Figure 1 shows part of another diffraction grating. A scale is given below.

Figure 1

1-2-s-q--q5c-medium-aqa-a-level-physics

c)

Use Figure 1 to calculate the grating spacing of this diffraction grating. 

State an appropriate absolute uncertainty and calculate the percentage uncertainty.

5d1 mark

Hence, or otherwise, calculate the number of lines per metre on the grating.

Did this page help you?

1a3 marks

An object falls off a cliff which is at a height, h, above the ground. The object takes 13.8 seconds to hit the ground.

 It is estimated that there is a percentage uncertainty of ±5% in measuring this time interval. A guidebook of the local area states the height of the cliff is 940 ± 10 m.

Calculate the acceleration of free-fall of the object and its absolute uncertainty to an appropriate number of significant figures.


1b4 marks

The only instrument used in this experiment was a stopwatch.

Suggest one possible source of systematic error and one source of random error in this investigation and explain how these errors could influence the value of acceleration of free-fall of the object determined in part (a).


1c4 marks

The experiment is repeated in a lab and the time is measured electronically. A student performs an experiment to find the acceleration due to gravity.

 The time t for a spherical object to fall freely through measured vertical distances s is measured. The results are shown in Table 1. 

Table 1

s / m

t1 / s

t2 / s

t3 / s

mean time
t / s

t2 / s2

0.100

0.141

0.138

0.144


0.200

0.201

0.205

0.209


0.300

0.240

0.246

0.250

0.245

0.0600

0.400

0.285

0.288

0.284

0.286

0.0818

0.500

0.315

0.319

0.323

0.319

0.102

0.600

0.345

0.349

0.354

0.349

0.122

0.700

0.376

0.379

0.382

0.379

0.144

0.800

0.399

0.405

0.407


0.900

0.426

0.428

0.432


Complete the missing data in Table 1 and plot the data on Figure 1 below, including error bars and a line of best fit.

Figure 1


1-2-s-q--q1c-hard-aqa-a-level-physics
1d6 marks

The uncertainty in each value of s is ± 0.002 m.

d)
Hence, or otherwise, calculate the value of g for this experiment and its percentage uncertainty.


Did this page help you?

2a2 marks

A microwave transmitter MT and a receiver MR are arranged on a line marked on the bench.

A metal sheet M is placed on the marked line perpendicular to the bench surface.

 Figure 1 shows side and plan views of the arrangement.

 The circuit connected to MT and the ammeter connected to MR are only shown in the plan view.

1-2-s-q--q2a-hard-aqa-a-level-physics

The distance y between MT and MR is recorded.

 MT is switched on and the output from MT is adjusted so a reading is produced on the ammeter.

 M is kept parallel to the marked line and moved slowly away. The perpendicular distance x between the marked line and M is recorded.

Describe one method of reducing systematic errors in the measurement of x. 
 
You may wish to include a sketch with your answer.
2b3 marks

At the first minimum position, a student labels the minimum n = 1 and records the value of x. The next minimum position is labelled n = 2 and the new value of x is recorded. Several positions of maxima and minima are produced.

It can be shown that the relationship between positions of the maxima and minima, n, the wavelength of the microwaves, λ, and the distances x and y, as defined in Figure 1, is equal to:

          nλ square root of 4 x squared plus y squared end root minus y

 The student plots the graph shown in Figure 2.

 The student estimates the uncertainty in each value of square root of 4 x squared plus y squared end root to be 0.025 m and adds error bars to the graph.

1-2-s-q--q3b-hard-aqa-a-level-physics

b)

Using Figure 2, determine the maximum and minimum possible values of λ.

2c4 marks

Hence, determine λ and the percentage uncertainty in the value of λ.

2d2 marks

Another student conducted a similar experiment but determined the uncertainty in each value square root of 4 x squared plus y squared end rootof  to be 0.010 m.

Using Figure 2, explain the effect this would have on the uncertainty in λ.


Did this page help you?

3a2 marks

An object of mass 1.000 g is placed on four different balances. For each balance the reading is taken five times, as shown in Table 1. 

Table 1

Balance

Mass Reading / g

1st

2nd

3rd

4th

5th

1

1.000

1.000

1.002

1.001

1.002

2

1.011

0.999

1.001

0.989

0.995

3

1.012

1.013

1.012

1.014

1.014

4

0.993

0.987

1.002

1.000

0.983


Analyze the data and conclude which sets of readings are accurate, precise or neither.
3b3 marks

In an experiment to measure the density of steel, a steel sphere was used. The diameter of the steel sphere was found to be 0.60 cm ± 0.01 mm. 

The object used in part (a) was the steel sphere. The mass of the sphere was measured using balance 2 shown in Table 1.

Determine the density of the sphere and its associated percentage uncertainty.


3c3 marks

The experimenter repeats the experiment to measure the density of steel, but this time with a cylindrical container made from steel.

 The volume of the cylinder was found by measuring its diameter and height to within 0.01 and 0.03 fractional uncertainty respectively.

 The measurements obtained were as follows: 

Mass Reading / g

1st

2nd

3rd

4th

5th

726

720

723

729

722


Diameter of the cylinder = 2.2 cm

Height of the cylinder = 25.0 cm

Determine the density of the cylinder and its associated percentage uncertainty. 

3d4 marks

The true value of the density of the steel used in both the cylinder and the sphere was found to be 8.10 g cm–3. 

A student assumes that the percentage difference between the density of the steel cylinder and the true value is due only to the uncertainty in the volume, and the uncertainty in the mass.

Assess the validity of this assumption.

Did this page help you?

4a3 marks

The period of oscillation of a pendulum is given by the equation: 

            T  = 2πbegin mathsize 14px style square root of L over g end root end style

Where the length of the pendulum L is measured with an accuracy of 1.8 % and the acceleration due to free-fall g is measured with an accuracy of 1.6 %.

If the time for the pendulum to complete 20 oscillations is 18.4 s, determine the time period for one oscillation and the absolute uncertainty in this value. 

4b2 marks

Measurements of time periods for different lengths of pendula were taken using a stopwatch and plotted on a graph, as shown in Figure 1.

Figure 1

1-2-s-q--q4b-hard-aqa-a-level-physics 

The graph was expected to pass through the origin.

Suggest a plausible explanation for the non-zero intercept.


4c2 marks

The period T for a mass m hanging on a spring performing simple harmonic motion is given by the equation: 

               T  = 2πbegin mathsize 16px style m over k end style

Such a system is used to determine the spring constant k. The fractional error in the measurement of the period T is α and the fractional error in the measurement of the mass m is β.

Determine the fractional error in the calculated value of k in terms of α and β.

4d6 marks

The spring constant of a spring may be determined by finding the extension of the spring and the load applied using the apparatus shown in Figure 2.

1-2-s-q--q4d-hard-aqa-a-level-physics

Readings of the position of the lower end of the spring are made using a metre rule.

Assess the precision and accuracy of this experiment.


In your answer you should make reference to:

  • Possible sources of random and systematic errors
  • Methods for keeping errors in the readings to a minimum

Did this page help you?

5a2 marks

The decay of a radioactive substance can be represented by the equation

              A equals A subscript 0 e to the power of negative lambda t end exponent 

where A is the activity of the sample at time tA0 is the initial activity at time t = 0 and λ is the decay constant.

 The half-life, t½ of the radioactive substance is given by

              t subscript bevelled 1 half end subscript equals fraction numerator iota n l n 2 over denominator lambda end fraction


An experiment was performed to determine the half-life of a radioactive substance which was a beta emitter. The radioactive source was placed close to a detector.

 The total count for exactly 5 minutes was recorded. This was repeated at 15 minute intervals. The results are shown in Table 1.

 Table 1

Time, t /
minutes

Total count,
recorded in
5 minutes

Count rate /
counts minute–1

Corrected count
rate, C /
counts minute–1

ln (C / minute–1)

0

1016

203

183

5.21

15

920

184

164

5.10

30

835

167

147

4.99

45

758

152

132

4.88

60

665

133

113

4.73

75

623

125

105

4.65

90

568

114

94

4.54

105

520

104

84

4.43

120

476

95

75

4.32

135

437

87

67

4.21

It can be shown that the uncertainty in the corrected count rate, C, is given by 

            ΔC = ± √C

Use this information to calculate the uncertainty in each value of ln C.


5b3 marks

On Figure 1, draw a line of best fit and error bars for each point.

1-2-s-q--q5b-hard-aqa-a-level-physics

5c3 marks

Hence, determine the half-life of the sample and its associated absolute uncertainty.

5d2 marks

Another student performed the same experiment with identical equipment but took total counts over a 1-minute period rather than a 5-minute period. The total count, C, at 140 minutes was equal to 54 counts.

Estimate the percentage uncertainty in this total count, and hence explain the advantage of using a larger time.


Did this page help you?