Determining Uncertainties from Graphs (AQA AS Physics) : Revision Note
Did this video help you?
Using Error Bars
The uncertainty in a measurement can be shown on a graph as an error bar
This bar is drawn above and below the point (or from side to side) and shows the uncertainty in that measurement
Error bars are plotted on graphs to show the absolute uncertainty of values plotted
Usually, error bars will be in the vertical direction, for y-values, but can also be plotted horizontally, for x-values
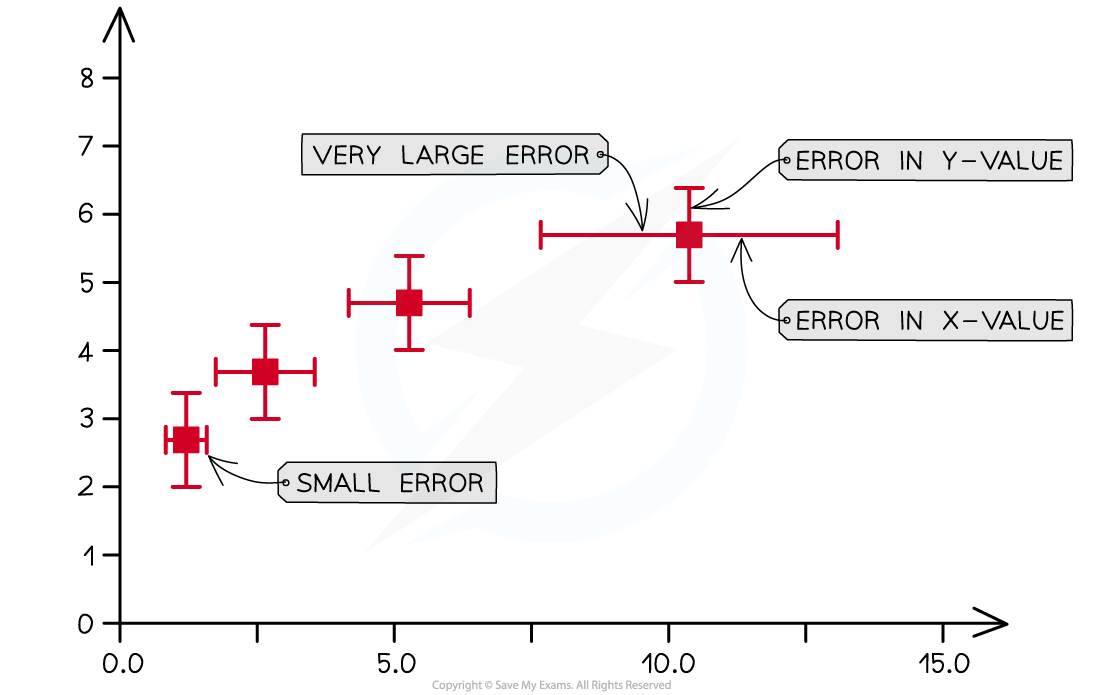
Representing error bars on a graph
Determining Uncertainties from Graphs
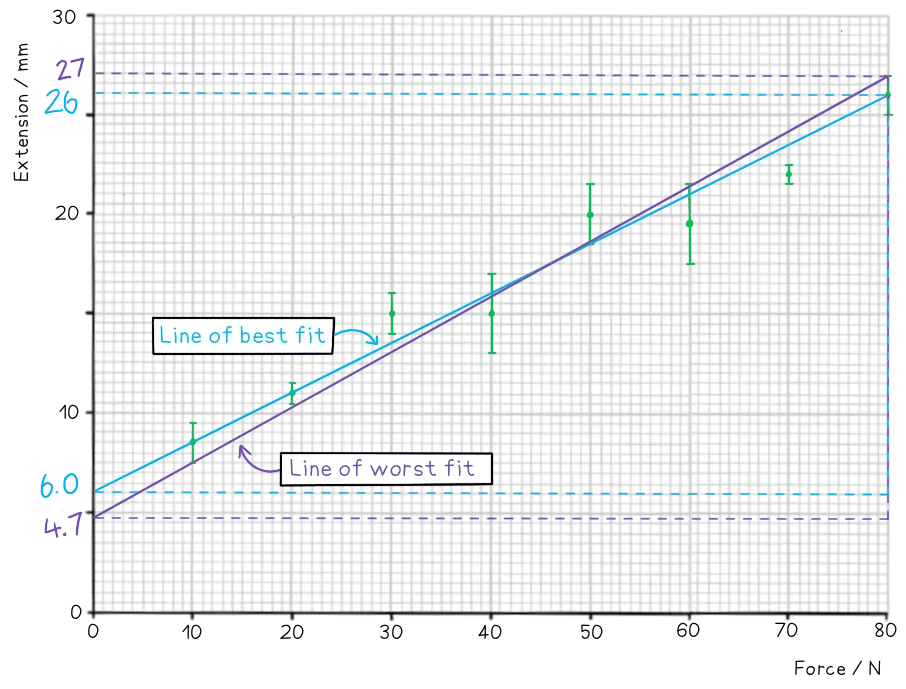
To calculate the uncertainty in a gradient, two lines of best fit should be drawn on the graph:
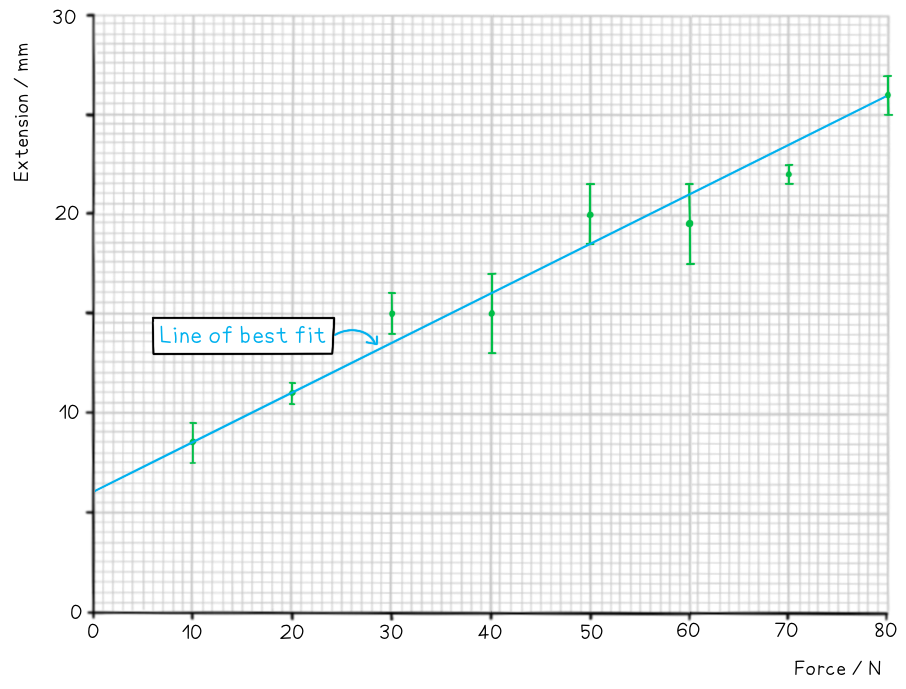
The ‘best’ line of best fit, which passes as close to the points as possible
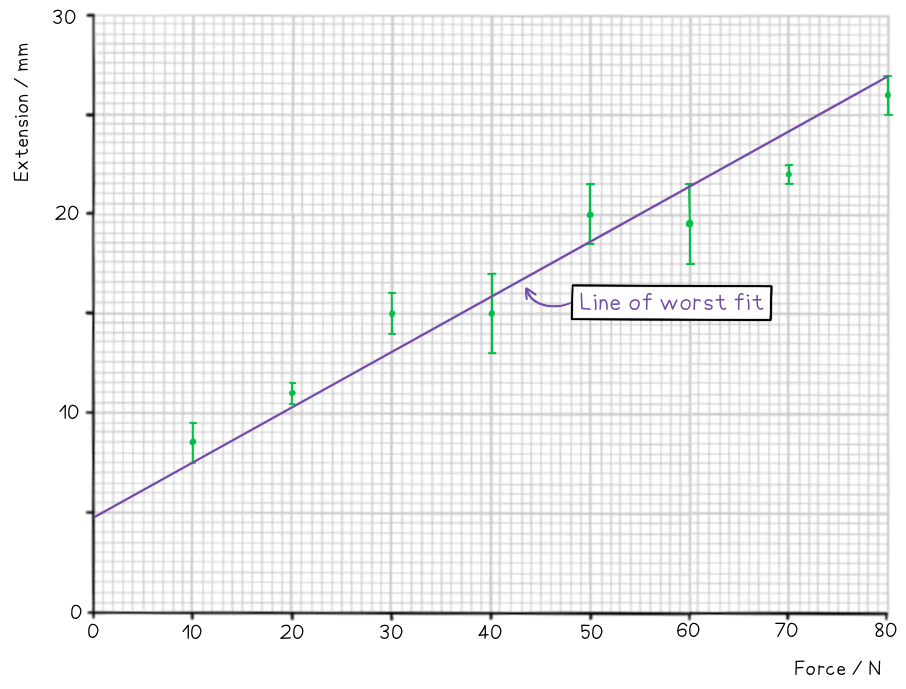
The ‘worst’ line of best fit, either the steepest possible or the shallowest possible line which fits within all the error bars
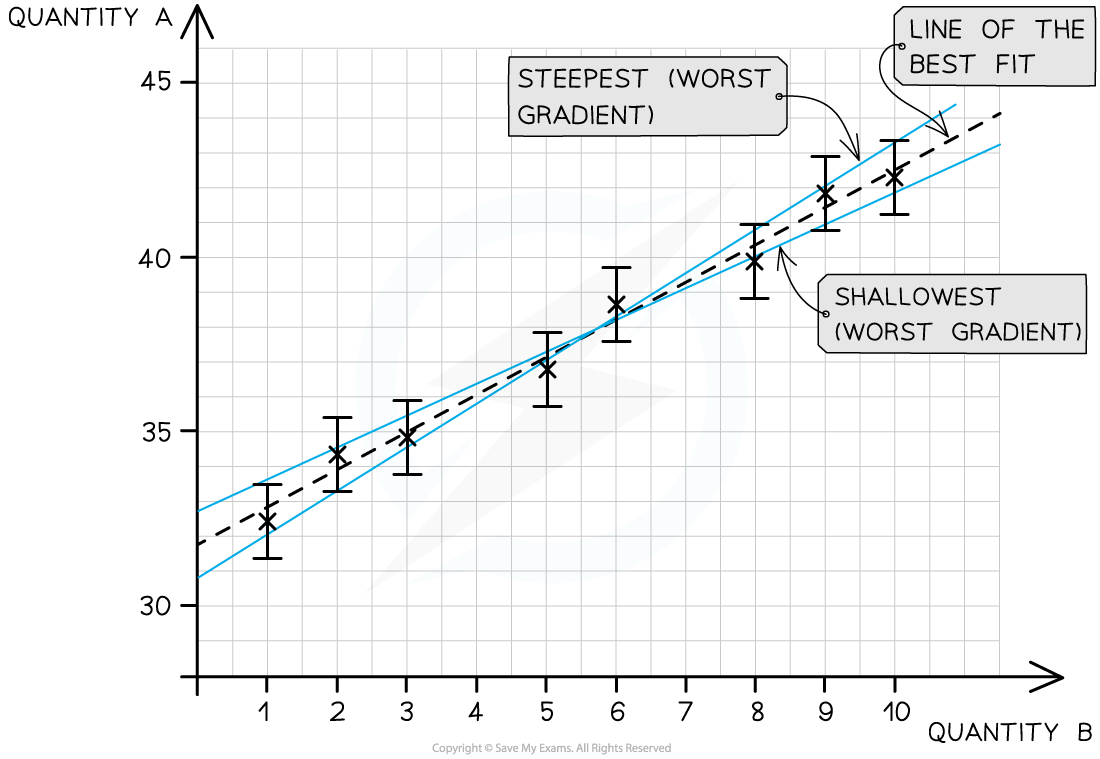
The line of best fit passes as close as possible to all the points. The steepest and shallowest lines are known as the worst fit
The percentage uncertainty in the gradient can be found using:

The percentage uncertainty in the y-intercept can be found using:

Worked Example
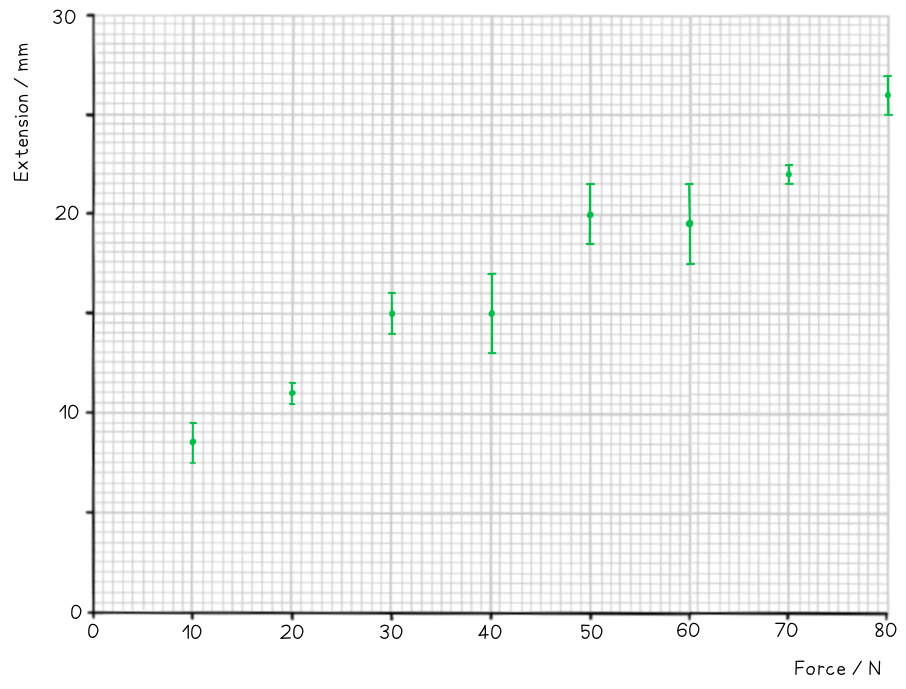
On the axes provided, plot the graph for the following data and draw error bars and lines of best and worst fit.

Find the percentage uncertainty in the gradient from your graph.
Answer:
Step 1: Draw sensible scales on the axes and plot the data
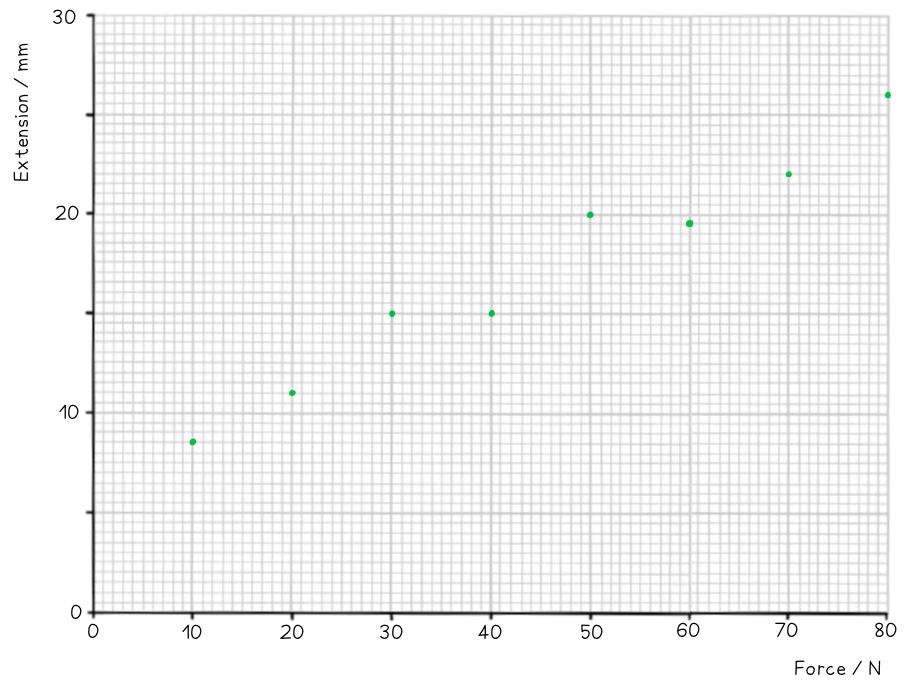
Step 2: Draw the errors bars for each point
Step 3: Draw the line of best fit
Step 4: Draw the line of worst fit
Step 5: Work out the gradient of each line and calculate the percentage uncertainty
Examiner Tips and Tricks
When drawing graphs make sure to follow these rules to gain full marks:
Ensure the scale is sensible and takes up as much paper as possible
Label the axes with a quantity and a unit
Precisely plot the points to within 0.5 squares
Leave a roughly equal number of points above and below the best fit line
Draw the error bars accurately

You've read 0 of your 5 free revision notes this week
Unlock more, it's free!
Did this page help you?

