Proportional Relationships (Edexcel AS Maths) : Revision Note
Did this video help you?
Proportional Relationships
Proportional relationships
Proportional relationships describe a proportional connection between two variables
This can happen in two ways
Direct proportion
one variable increases or decreases the other does the same
Inverse proportion
one variable increases the other decreases and vice versa
Proportional relationships use the symbol
which means is proportional to

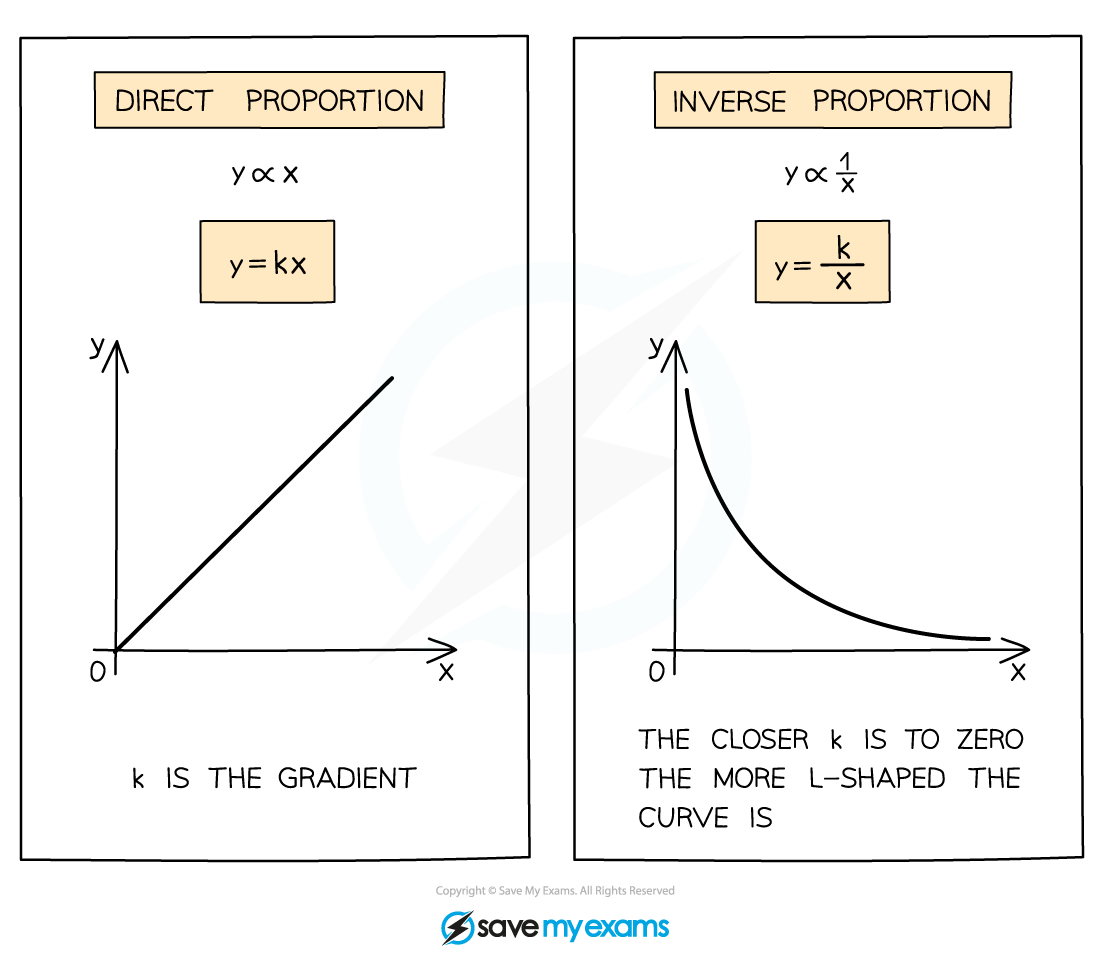
Both direct and inverse proportion can be represented graphically
Direct proportion creates a linear graph where k is the gradient
Inverse proportion creates a reciprocal graph
Direct proportion
means y is proportional to x
y increases as x does, k determines the rate (gradient)
by changing this to the equation
we can substitute in given values and solve to find k
Note that this means the ratio of x and y is constant k = y / x

Inverse proportion
means y is proportional to
or y is inversely proportional to x
y decreases as x increases and vice versa, k determines the rate
by changing this to the equation
we can substitute in given values and solve to find k
Note that this means the product of x and y is constant k = xy

How do I work with proportional relationships?

Set up your proportional relationship using
then change to = k
Be clear about what y is proportional to …
“… the square of x” (x2)
“… x plus four” (x + 4)
Calculate or deduce the value of k from the information given or a graph
Once you've found k sub it back in to your original proportion equation
You can now find any values using this proportional relationship
y = mx + c rearranges to y – c = mx so (y - c) is directly proportional to x
Proportional relationships are often used in modelling
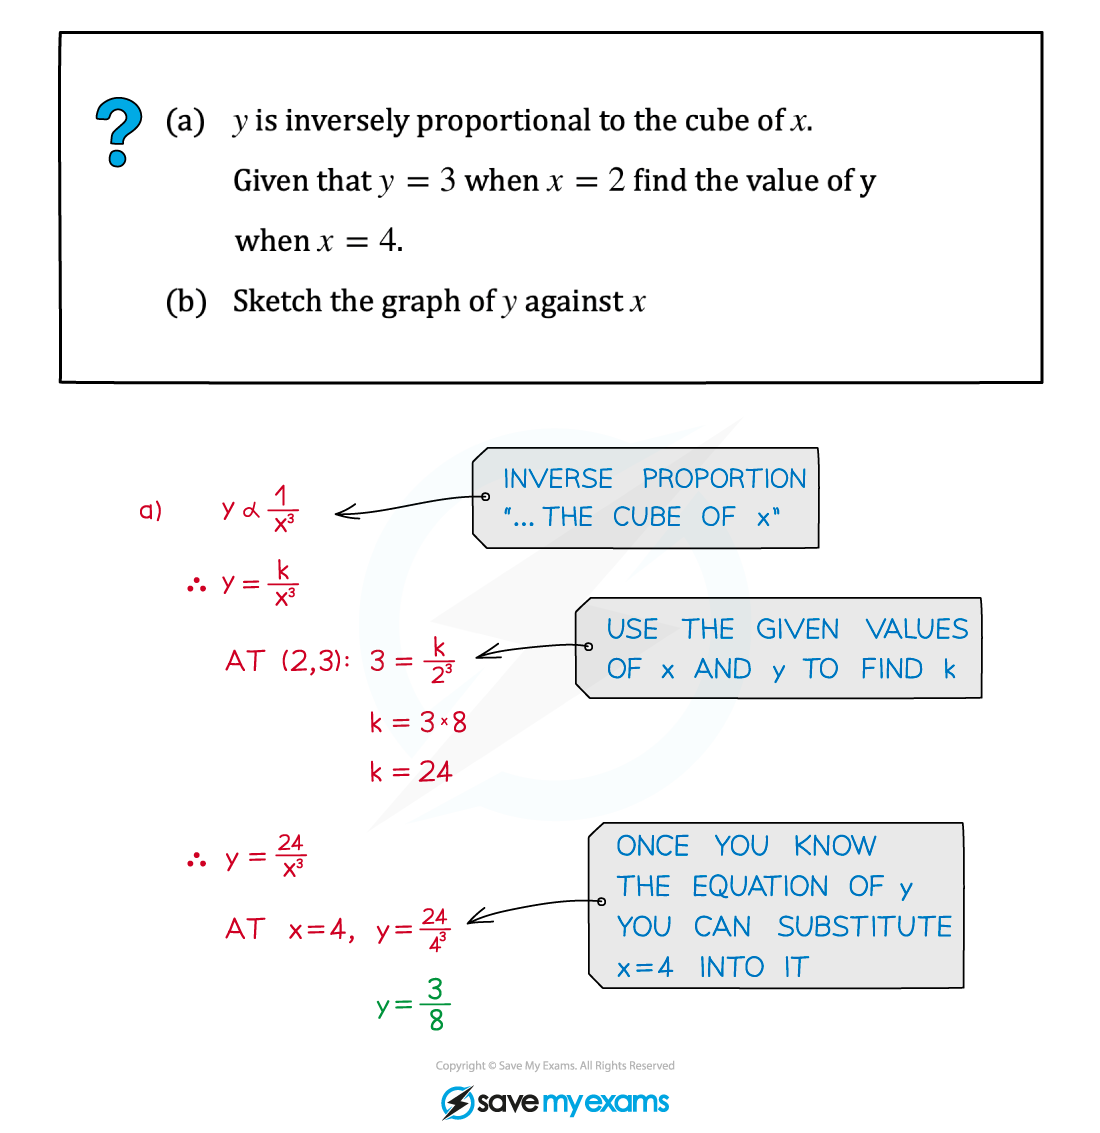
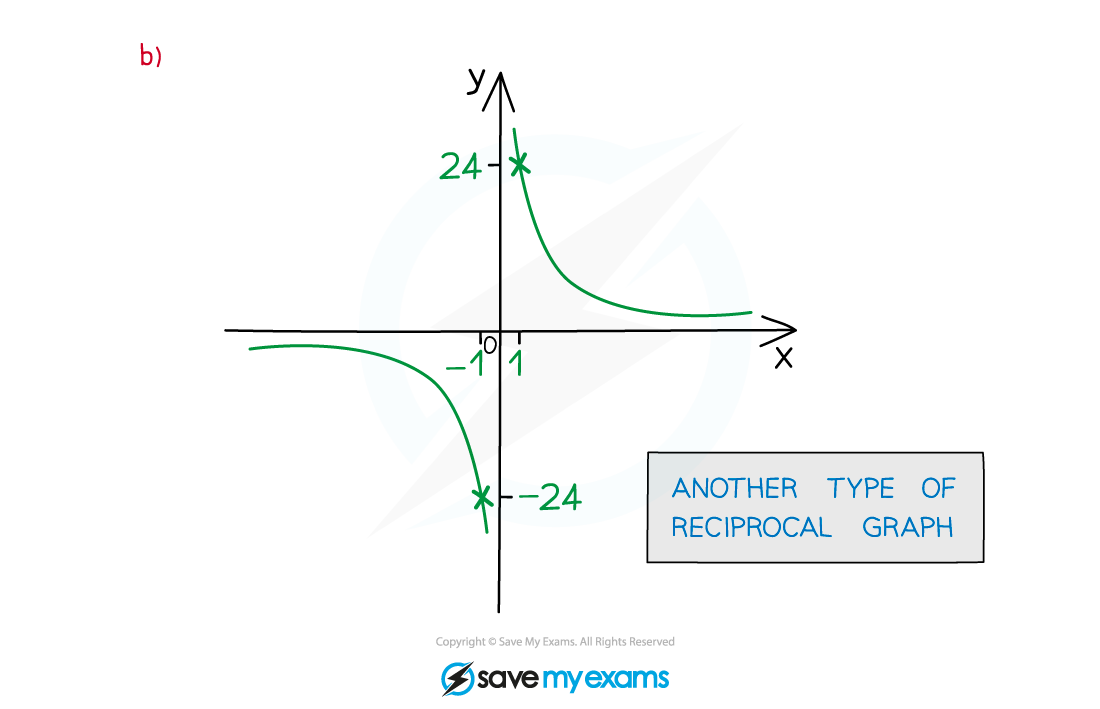
Worked Example


You've read 0 of your 5 free revision notes this week
Sign up now. It’s free!
Did this page help you?
