Did this video help you?
Displacement-Time Graphs (OCR AS Maths: Mechanics)
Revision Note
Displacement-Time Graphs
What is a displacement-time graph?
- Displacement-time graphs show the displacement of an object from a fixed origin as it moves in a straight line
- They show displacement (on the vertical axis) against time (on the horizontal axis)
- Displacement-time graphs can go below the horizontal axis whereas distance-time graphs can not
- Distance can not be negative whereas displacement can be
What are the key features of a displacement-time graph?
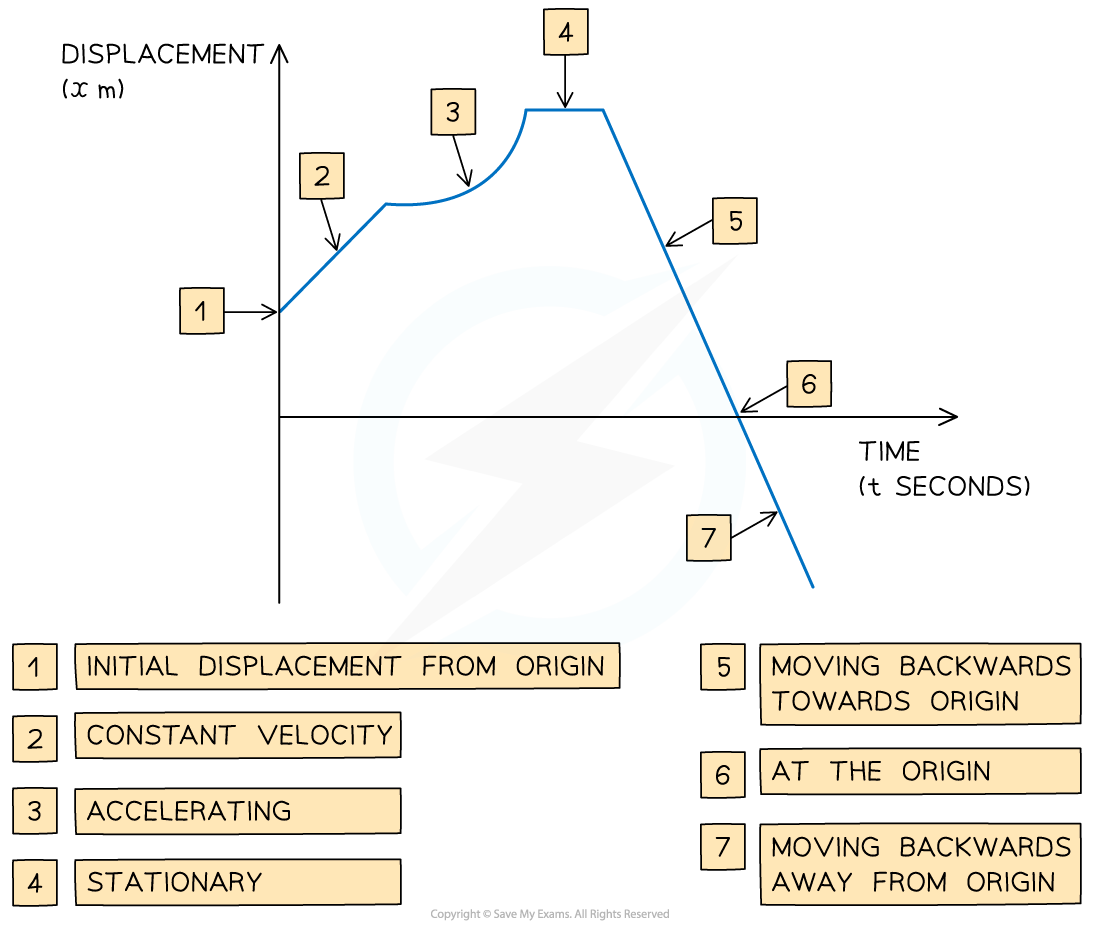
- The gradient of the graph equals the velocity of the object
- A positive gradient means the object is travelling forwards
- A negative gradient means that the object is travelling backwards
- The steeper the line, the greater the speed
- A straight line shows that the object is moving at a constant velocity
- A curved line shows that the object is accelerating or decelerating
- A horizontal line shows that the object is stationary
- If the graph touches the x-axis, then the object is at the origin at that time

How do I find the average speed and the average velocity of a journey?
- The average speed can not be negative as speed is a scalar quantity and can only take a positive value
- The average velocity is a vector quantity and can be positive, zero or negative
Worked example

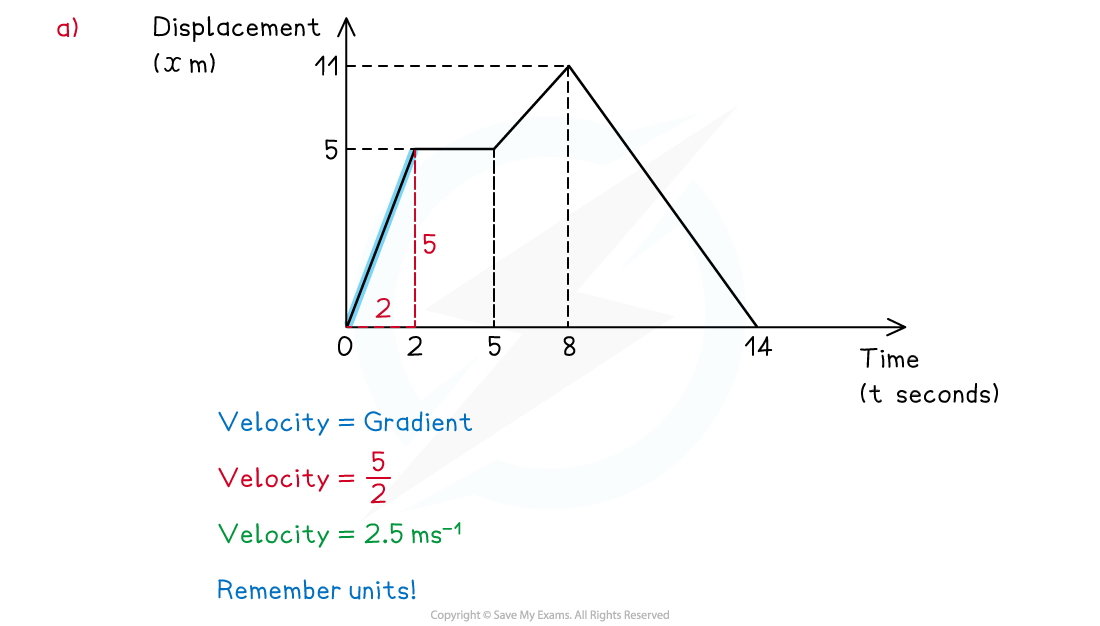
(a) Calculate the velocity of the athlete during the first 2 seconds.

(b) Describe the motion of the athlete between the times of 2 seconds and 5 seconds.

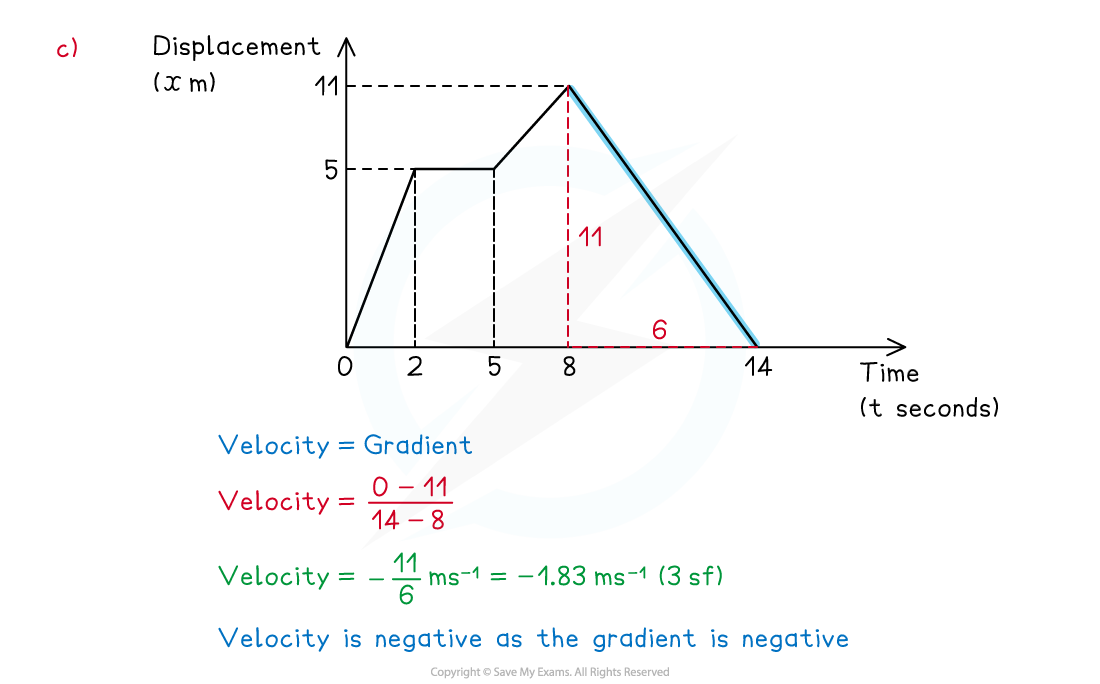
(c) Calculate the velocity of the athlete at 10 seconds.

(d) Find the total distanced travelled by the athlete during the 14 seconds.

Examiner Tip
- Be careful to spot if you are working with a displacement-time graph or a velocity-time graph.
- Be careful to spot if you are working with a displacement-time graph or a distance-time graph
- Check where the graph starts from on the y-axis, the object does not have to start at 0. For example, if the graph starts at 100, the scenario could be a student on a walk starting 100 m from their house.
- Distance is a scalar so it can not be negative whereas displacement from a starting point can be.
- Think about the units when calculating, make sure they are consistent.

You've read 0 of your 5 free revision notes this week
Sign up now. It’s free!
Did this page help you?
