Frequency Tables (Edexcel AS Maths): Revision Note
Exam code: 8MA0

Written by: Amber
Updated on
Did this video help you?
Ungrouped data
A frequency table for ungrouped data shows the frequency of individual data values
Why use a frequency table for ungrouped data?
When collecting large amounts of raw data, it is quicker to use a tally system and then collate the results into a frequency table
Ungrouped frequency tables are normally used for numerical, discrete data
Organising data into a frequency table makes it easier to work with
Calculating averages, ranges and summary statistics can be done much quicker from a frequency table than from raw data
It gives a clear pattern of the data
It is easy to quickly see where most of the data are and to see extreme values
A frequency table for ungrouped data keeps all of the original data values
It is still possible to calculate the actual averages, ranges and summary statistics
How are the mean, median and mode calculated from an ungrouped frequency table?
You should already be familiar with finding the mean, median and mode from raw, ungrouped data
The mode is the value that occurs most often in a data set
In an ungrouped frequency table the data value with the highest frequency will be the mode
The median is the middle value when the data is in order of size
To find the median from an ungrouped frequency table, add the frequencies together until you reach the value that is half of the total
For a data set of values, calculate
format('truetype')%3Bfont-weight%3Anormal%3Bfont-style%3Anormal%3B%7D%3C%2Fstyle%3E%3C%2Fdefs%3E%3Cline%20stroke%3D%22%23000%22%20stroke-linecap%3D%22square%22%20stroke-width%3D%221%22%20x1%3D%222.5%22%20x2%3D%2232.5%22%20y1%3D%2219.5%22%20y2%3D%2219.5%22%2F%3E%3Ctext%20font-family%3D%22Times%20New%20Roman%22%20font-size%3D%2214%22%20font-style%3D%22italic%22%20text-anchor%3D%22middle%22%20x%3D%226.5%22%20y%3D%2214%22%3En%3C%2Ftext%3E%3Ctext%20font-family%3D%22math117e62166fc8586dfa4d1bc0e17%22%20font-size%3D%2214%22%20text-anchor%3D%22middle%22%20x%3D%2218.5%22%20y%3D%2214%22%3E%2B%3C%2Ftext%3E%3Ctext%20font-family%3D%22Times%20New%20Roman%22%20font-size%3D%2214%22%20text-anchor%3D%22middle%22%20x%3D%2228.5%22%20y%3D%2214%22%3E1%3C%2Ftext%3E%3Ctext%20font-family%3D%22Times%20New%20Roman%22%20font-size%3D%2214%22%20text-anchor%3D%22middle%22%20x%3D%2217.5%22%20y%3D%2234%22%3E2%3C%2Ftext%3E%3C%2Fsvg%3E) and the median will be whichever data value corresponds with this frequency
and the median will be whichever data value corresponds with this frequency
The mean is the sum of all the values divided by the number of values in the data set
To find the mean, multiply each data value by its corresponding frequency, find the sum of these values and then divide by the total frequency
The notation for the sum of the values is

The formula for the mean from a frequency table is

Worked Example
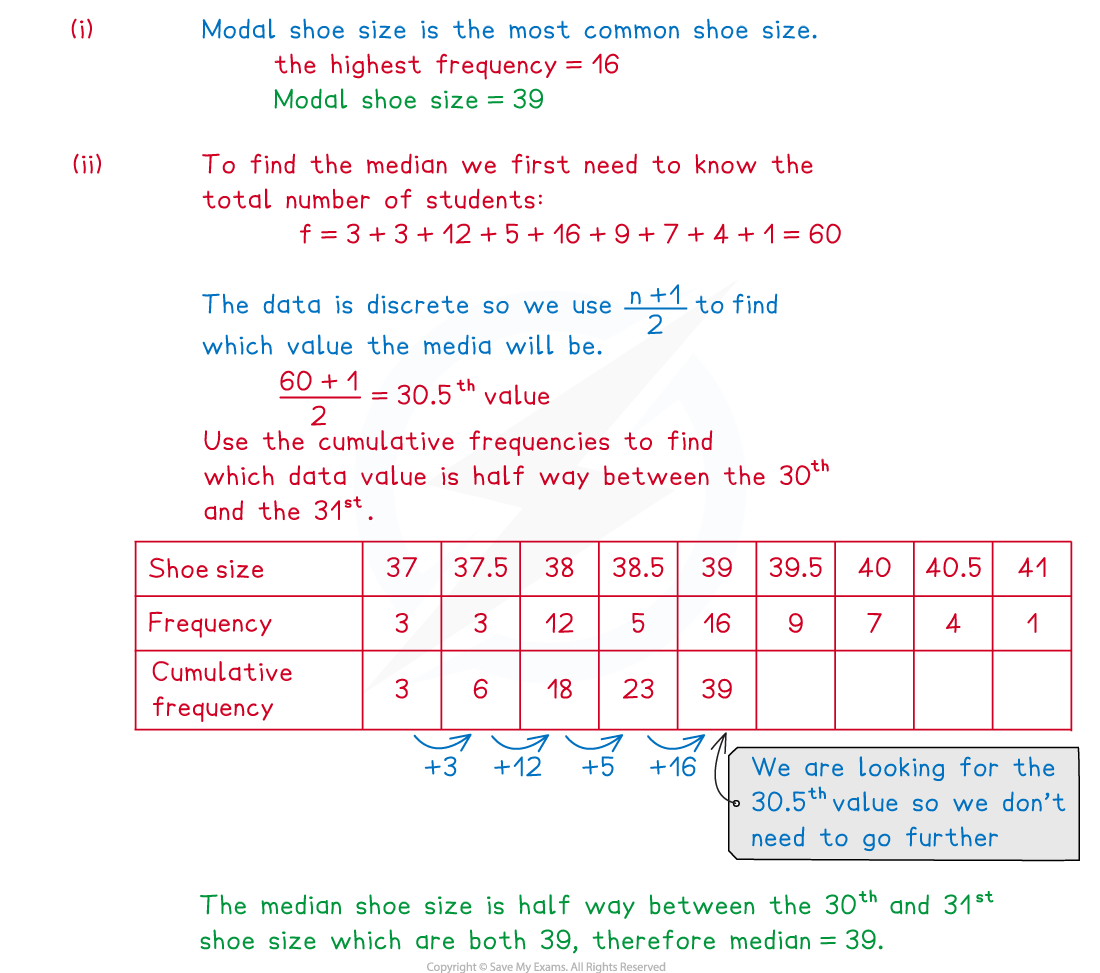
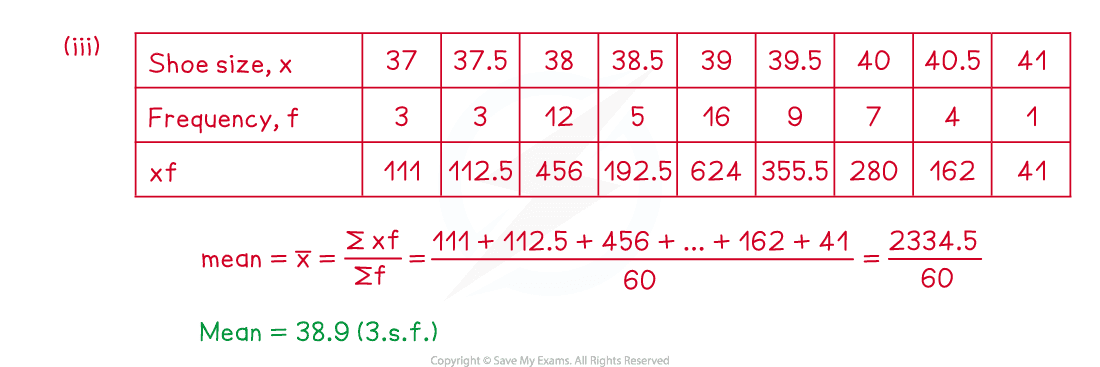
The frequency table below gives information about the shoe size of a group of year 12 students.
Shoe Size | 37 | 37.5 | 38 | 38.5 | 39 | 39.5 | 40 | 40.5 | 41 |
Frequency | 3 | 3 | 12 | 5 | 16 | 9 | 7 | 4 | 1 |
(i) Write down the modal shoe size.
(ii) Explain how you know that the median shoe size is 39.
(iii) Calculate the mean shoe size.
Answer:
Examiner Tips and Tricks
Use common sense when checking your answers, is your mean within the range of the data? Does is seem right? A mean of 140 for example could not be correct if the data is about ages of students taking an exam at university.
Did this video help you?
Grouped data
A frequency table for grouped data is usually used for large amounts of continuous data
They show the frequency of data values that are within a particular group or class
What are the advantages and disadvantages of grouping data?
Grouping data is especially useful when data can take a large range of different values
Trends and patterns can be easily spotted when data has been grouped
Calculations are much quicker with data that has been grouped
It is important to be aware, however, that grouped frequency tables also have some negatives
The actual data values are lost when data is grouped
It is only possible to calculate estimated averages, ranges and summary statistics
What notation is used for grouped frequency tables?
When grouping data, it is important to be clear about which group or class any data value should be entered into
A group entry of 10 – 20 followed by 20 – 30 would be unclear because the number 20 could be entered into both groups
If the data are discrete, this could be written as 10 – 19 and 20 – 29
For continuous data, this could be changed to 10 – and 20 –
This would most likely be represented as
format('truetype')%3Bfont-weight%3Anormal%3Bfont-style%3Anormal%3B%7D%3C%2Fstyle%3E%3C%2Fdefs%3E%3Ctext%20font-family%3D%22Times%20New%20Roman%22%20font-size%3D%2216%22%20text-anchor%3D%22middle%22%20x%3D%228.5%22%20y%3D%2215%22%3E10%3C%2Ftext%3E%3Ctext%20font-family%3D%22math1d3114856d6c6df443e3168d768%22%20font-size%3D%2214%22%20text-anchor%3D%22middle%22%20x%3D%2223.5%22%20y%3D%2215%22%3E%26%23x2264%3B%3C%2Ftext%3E%3Ctext%20font-family%3D%22Times%20New%20Roman%22%20font-size%3D%2216%22%20font-style%3D%22italic%22%20text-anchor%3D%22middle%22%20x%3D%2235.5%22%20y%3D%2215%22%3Ex%3C%2Ftext%3E%3Ctext%20font-family%3D%22math1d3114856d6c6df443e3168d768%22%20font-size%3D%2214%22%20text-anchor%3D%22middle%22%20x%3D%2247.5%22%20y%3D%2215%22%3E%26lt%3B%3C%2Ftext%3E%3Ctext%20font-family%3D%22Times%20New%20Roman%22%20font-size%3D%2216%22%20text-anchor%3D%22middle%22%20x%3D%2263.5%22%20y%3D%2215%22%3E20%3C%2Ftext%3E%3C%2Fsvg%3E) and
and format('truetype')%3Bfont-weight%3Anormal%3Bfont-style%3Anormal%3B%7D%3C%2Fstyle%3E%3C%2Fdefs%3E%3Ctext%20font-family%3D%22Times%20New%20Roman%22%20font-size%3D%2216%22%20text-anchor%3D%22middle%22%20x%3D%228.5%22%20y%3D%2215%22%3E20%3C%2Ftext%3E%3Ctext%20font-family%3D%22math1d3114856d6c6df443e3168d768%22%20font-size%3D%2214%22%20text-anchor%3D%22middle%22%20x%3D%2223.5%22%20y%3D%2215%22%3E%26%23x2264%3B%3C%2Ftext%3E%3Ctext%20font-family%3D%22Times%20New%20Roman%22%20font-size%3D%2216%22%20font-style%3D%22italic%22%20text-anchor%3D%22middle%22%20x%3D%2235.5%22%20y%3D%2215%22%3Ex%3C%2Ftext%3E%3Ctext%20font-family%3D%22math1d3114856d6c6df443e3168d768%22%20font-size%3D%2214%22%20text-anchor%3D%22middle%22%20x%3D%2247.5%22%20y%3D%2215%22%3E%26lt%3B%3C%2Ftext%3E%3Ctext%20font-family%3D%22Times%20New%20Roman%22%20font-size%3D%2216%22%20text-anchor%3D%22middle%22%20x%3D%2263.5%22%20y%3D%2215%22%3E30%3C%2Ftext%3E%3C%2Fsvg%3E)
Most commonly inequalities are used to group continuous data as they leave no ambiguity
If the data are continuous, always check that there are no gaps between upper boundary of a class and the lower boundary of the next class
If there are gaps you will need to close these gaps by changing the boundaries before carrying out any calculations
For example, the groups
format('truetype')%3Bfont-weight%3Anormal%3Bfont-style%3Anormal%3B%7D%3C%2Fstyle%3E%3C%2Fdefs%3E%3Ctext%20font-family%3D%22Times%20New%20Roman%22%20font-size%3D%2216%22%20text-anchor%3D%22middle%22%20x%3D%228.5%22%20y%3D%2215%22%3E10%3C%2Ftext%3E%3Ctext%20font-family%3D%22math1a36adbc35e69b22acbf9f834a0%22%20font-size%3D%2214%22%20text-anchor%3D%22middle%22%20x%3D%2223.5%22%20y%3D%2215%22%3E%26%23x2264%3B%3C%2Ftext%3E%3Ctext%20font-family%3D%22Times%20New%20Roman%22%20font-size%3D%2216%22%20font-style%3D%22italic%22%20text-anchor%3D%22middle%22%20x%3D%2235.5%22%20y%3D%2215%22%3Ex%3C%2Ftext%3E%3Ctext%20font-family%3D%22math1a36adbc35e69b22acbf9f834a0%22%20font-size%3D%2214%22%20text-anchor%3D%22middle%22%20x%3D%2247.5%22%20y%3D%2215%22%3E%26%23x2264%3B%3C%2Ftext%3E%3Ctext%20font-family%3D%22Times%20New%20Roman%22%20font-size%3D%2216%22%20text-anchor%3D%22middle%22%20x%3D%2263.5%22%20y%3D%2215%22%3E19%3C%2Ftext%3E%3C%2Fsvg%3E) followed by
followed by format('truetype')%3Bfont-weight%3Anormal%3Bfont-style%3Anormal%3B%7D%3C%2Fstyle%3E%3C%2Fdefs%3E%3Ctext%20font-family%3D%22Times%20New%20Roman%22%20font-size%3D%2216%22%20text-anchor%3D%22middle%22%20x%3D%228.5%22%20y%3D%2215%22%3E20%3C%2Ftext%3E%3Ctext%20font-family%3D%22math1a36adbc35e69b22acbf9f834a0%22%20font-size%3D%2214%22%20text-anchor%3D%22middle%22%20x%3D%2223.5%22%20y%3D%2215%22%3E%26%23x2264%3B%3C%2Ftext%3E%3Ctext%20font-family%3D%22Times%20New%20Roman%22%20font-size%3D%2216%22%20font-style%3D%22italic%22%20text-anchor%3D%22middle%22%20x%3D%2235.5%22%20y%3D%2215%22%3Ex%3C%2Ftext%3E%3Ctext%20font-family%3D%22math1a36adbc35e69b22acbf9f834a0%22%20font-size%3D%2214%22%20text-anchor%3D%22middle%22%20x%3D%2247.5%22%20y%3D%2215%22%3E%26%23x2264%3B%3C%2Ftext%3E%3Ctext%20font-family%3D%22Times%20New%20Roman%22%20font-size%3D%2216%22%20text-anchor%3D%22middle%22%20x%3D%2263.5%22%20y%3D%2215%22%3E29%3C%2Ftext%3E%3C%2Fsvg%3E) will become
will become format('truetype')%3Bfont-weight%3Anormal%3Bfont-style%3Anormal%3B%7D%3C%2Fstyle%3E%3C%2Fdefs%3E%3Ctext%20font-family%3D%22Times%20New%20Roman%22%20font-size%3D%2216%22%20text-anchor%3D%22middle%22%20x%3D%224.5%22%20y%3D%2215%22%3E9%3C%2Ftext%3E%3Ctext%20font-family%3D%22math13c77c15c4fe11b8bc39cad3c3a%22%20font-size%3D%2214%22%20text-anchor%3D%22middle%22%20x%3D%2210.5%22%20y%3D%2215%22%3E.%3C%2Ftext%3E%3Ctext%20font-family%3D%22Times%20New%20Roman%22%20font-size%3D%2216%22%20text-anchor%3D%22middle%22%20x%3D%2217.5%22%20y%3D%2215%22%3E5%3C%2Ftext%3E%3Ctext%20font-family%3D%22math13c77c15c4fe11b8bc39cad3c3a%22%20font-size%3D%2214%22%20text-anchor%3D%22middle%22%20x%3D%2228.5%22%20y%3D%2215%22%3E%26%23x2264%3B%3C%2Ftext%3E%3Ctext%20font-family%3D%22Times%20New%20Roman%22%20font-size%3D%2216%22%20font-style%3D%22italic%22%20text-anchor%3D%22middle%22%20x%3D%2240.5%22%20y%3D%2215%22%3Ex%3C%2Ftext%3E%3Ctext%20font-family%3D%22math13c77c15c4fe11b8bc39cad3c3a%22%20font-size%3D%2214%22%20text-anchor%3D%22middle%22%20x%3D%2252.5%22%20y%3D%2215%22%3E%26lt%3B%3C%2Ftext%3E%3Ctext%20font-family%3D%22Times%20New%20Roman%22%20font-size%3D%2216%22%20text-anchor%3D%22middle%22%20x%3D%2268.5%22%20y%3D%2215%22%3E19%3C%2Ftext%3E%3Ctext%20font-family%3D%22math13c77c15c4fe11b8bc39cad3c3a%22%20font-size%3D%2214%22%20text-anchor%3D%22middle%22%20x%3D%2278.5%22%20y%3D%2215%22%3E.%3C%2Ftext%3E%3Ctext%20font-family%3D%22Times%20New%20Roman%22%20font-size%3D%2216%22%20text-anchor%3D%22middle%22%20x%3D%2285.5%22%20y%3D%2215%22%3E5%3C%2Ftext%3E%3C%2Fsvg%3E) and
and format('truetype')%3Bfont-weight%3Anormal%3Bfont-style%3Anormal%3B%7D%3C%2Fstyle%3E%3C%2Fdefs%3E%3Ctext%20font-family%3D%22Times%20New%20Roman%22%20font-size%3D%2216%22%20text-anchor%3D%22middle%22%20x%3D%228.5%22%20y%3D%2215%22%3E19%3C%2Ftext%3E%3Ctext%20font-family%3D%22math13c77c15c4fe11b8bc39cad3c3a%22%20font-size%3D%2214%22%20text-anchor%3D%22middle%22%20x%3D%2218.5%22%20y%3D%2215%22%3E.%3C%2Ftext%3E%3Ctext%20font-family%3D%22Times%20New%20Roman%22%20font-size%3D%2216%22%20text-anchor%3D%22middle%22%20x%3D%2225.5%22%20y%3D%2215%22%3E5%3C%2Ftext%3E%3Ctext%20font-family%3D%22math13c77c15c4fe11b8bc39cad3c3a%22%20font-size%3D%2214%22%20text-anchor%3D%22middle%22%20x%3D%2236.5%22%20y%3D%2215%22%3E%26%23x2264%3B%3C%2Ftext%3E%3Ctext%20font-family%3D%22Times%20New%20Roman%22%20font-size%3D%2216%22%20font-style%3D%22italic%22%20text-anchor%3D%22middle%22%20x%3D%2248.5%22%20y%3D%2215%22%3Ex%3C%2Ftext%3E%3Ctext%20font-family%3D%22math13c77c15c4fe11b8bc39cad3c3a%22%20font-size%3D%2214%22%20text-anchor%3D%22middle%22%20x%3D%2260.5%22%20y%3D%2215%22%3E%26lt%3B%3C%2Ftext%3E%3Ctext%20font-family%3D%22Times%20New%20Roman%22%20font-size%3D%2216%22%20text-anchor%3D%22middle%22%20x%3D%2276.5%22%20y%3D%2215%22%3E29%3C%2Ftext%3E%3Ctext%20font-family%3D%22math13c77c15c4fe11b8bc39cad3c3a%22%20font-size%3D%2214%22%20text-anchor%3D%22middle%22%20x%3D%2286.5%22%20y%3D%2215%22%3E.%3C%2Ftext%3E%3Ctext%20font-family%3D%22Times%20New%20Roman%22%20font-size%3D%2216%22%20text-anchor%3D%22middle%22%20x%3D%2293.5%22%20y%3D%2215%22%3E5%3C%2Ftext%3E%3C%2Fsvg%3E)
Check the inequality signs carefully
Be careful when deciding what category the data falls into, taking the group
for example,if the data had been rounded it would take the form
as described aboveif the data had been truncated however, then the boundaries would become
this is most likely to happen with age, which is technically a continuous variable due to being able to take any value, however we would usually consider age by counting years
How do I find averages from grouped frequency tables?
Instead of finding the mode, when working with a grouped frequency table we instead find the modal class
This will be the class (group) with the greatest frequency
It is only possible to calculate an estimate for the mean and the median from a grouped frequency table
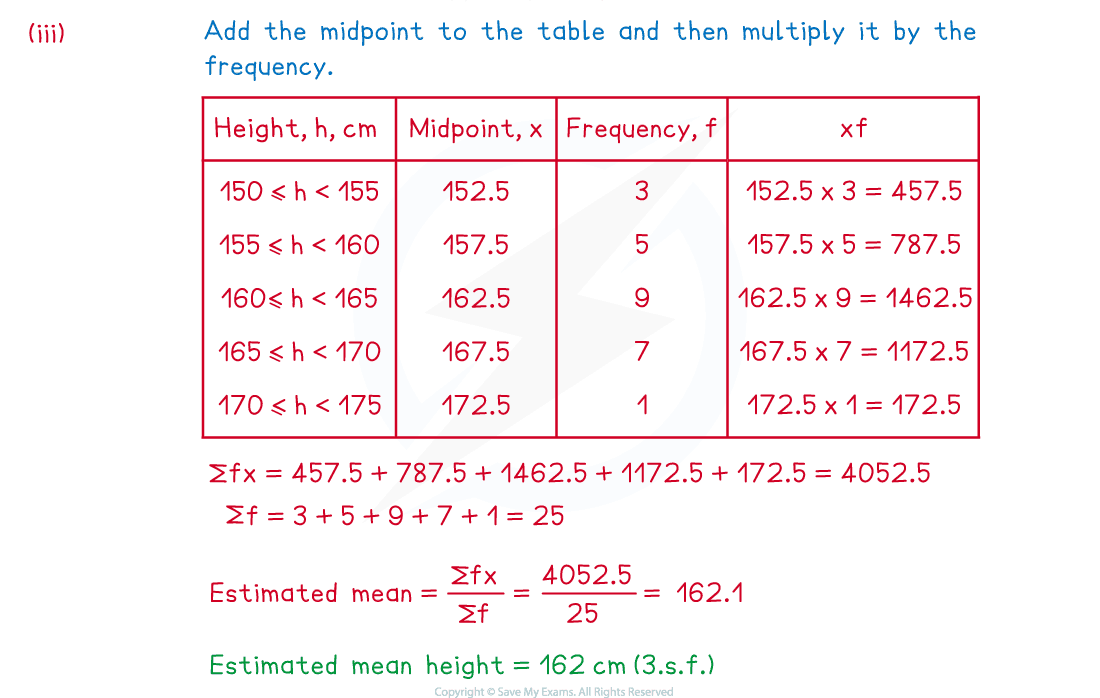
Calculating the estimated mean is the same as for ungrouped frequency tables, however you will need to find the midpoints first
the midpoint is the mean of the upper and lower values in the class boundaries
multiply the midpoint by its corresponding frequency, find the sum of these values and then divide by

Calculating the estimated median is more complicated and can involve using linear interpolation
How do I use linear interpolation on grouped data?
For grouped data, the median, quartiles and percentiles can be found using a process called linear interpolation
Interpolation uses the assumption that the data values are evenly spread throughout each class
Once you know which data value you are looking for, interpolation uses proportion to find how far through each class the data value should be
It is important to remember to add on the lower-class boundary after finding the correct data value
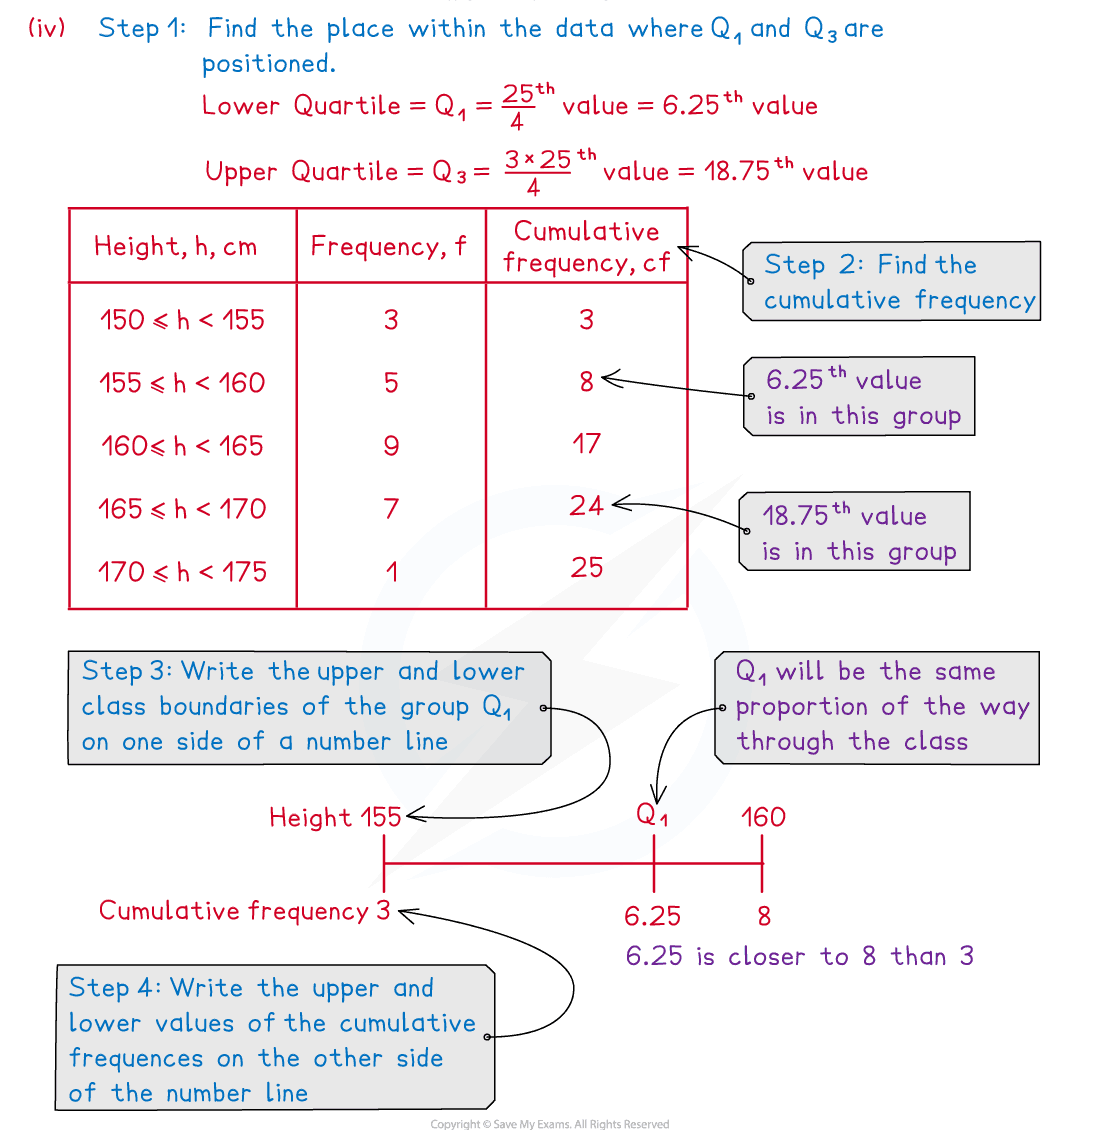
Follow these steps to use linear interpolation to find the median, quartiles or percentiles:
Step 1. Find the place within the data where the value you are looking to find is positioned, e.g. the median will be the ![]() th value
th value
Step 2. Add up the frequencies until you know which class this value will fall into (this is finding the cumulative frequency)
Step 3. Write the upper- and lower-class boundaries of this group on the upper side of a simple number line
Step 4. On the other side of the same number line add the lower and upper values of the cumulative frequency for this group to the ends of the line
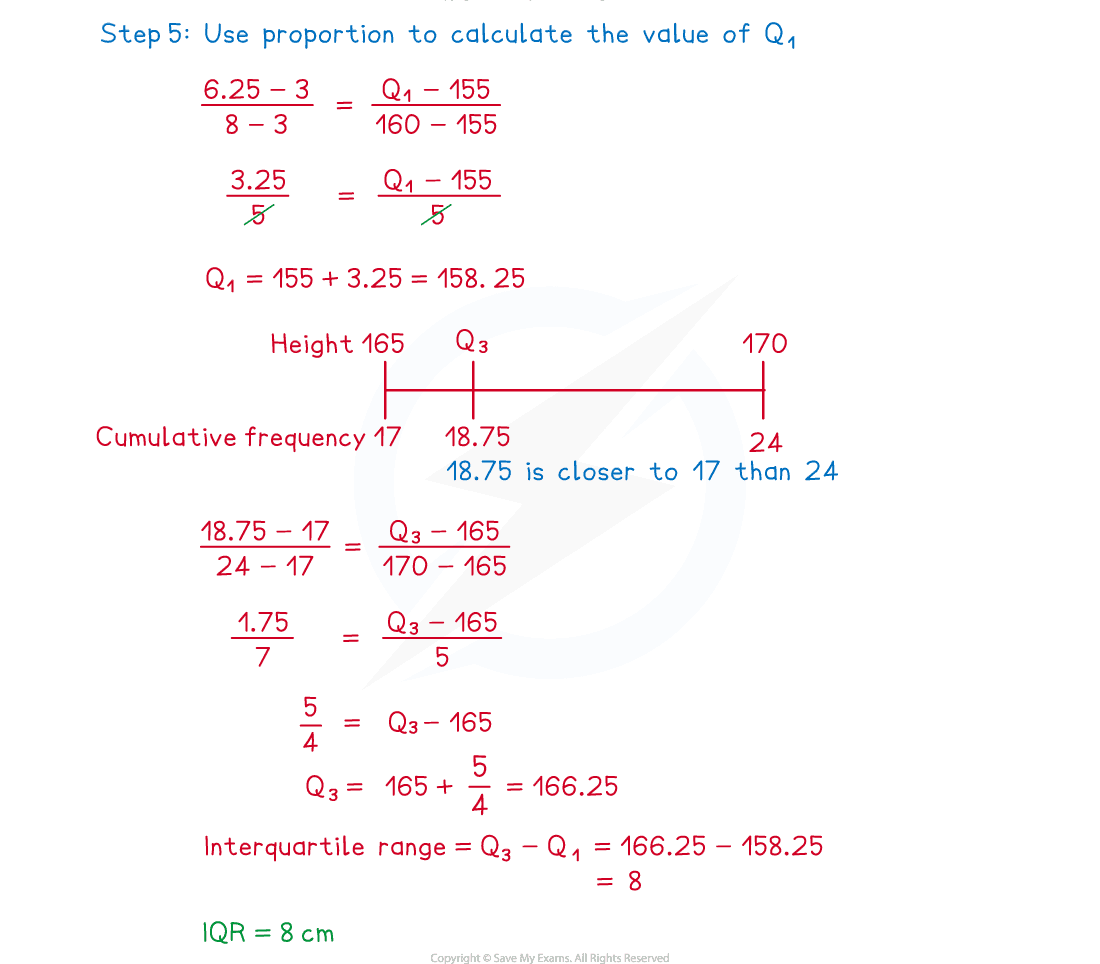
Step 5. Use proportion to calculate the data value that is the same fraction of the way through the group on the upper side of the number line as where the value you are looking for would sit on the lower side of the number line
To see these steps in action, go to part (iv) of the worked example
This method can be used to find any percentile, for example the 81st percentile will be the value that is
 ths of the way through the data
Worked Example
The table below shows the heights in cm of a group of year 12 students.
Height, | Frequency |
| 3 |
| 5 |
| 9 |
| 7 |
| 1 |
(i) Write down the class that a student of exactly 160 cm should be added to.
(ii) Write down the modal class.
(iii) Calculate the estimated mean height.
(iv) Use linear interpolation to find the interquartile range of the heights
Answer:
Examiner Tips and Tricks
There can be a lot of calculations when working with grouped frequency tables, be extra careful when using your calculators as it is easy to make small errors with these questions. Use the table and add information to the table as you go as there will be marks available for showing work within the methods. Make sure you know how to use your calculator to find all of the summary statistics as this can save time and reduce errors.

Unlock more, it's free!
Join the 100,000+ Students that ❤️ Save My Exams
the (exam) results speak for themselves:

Was this revision note helpful?