Histograms (Edexcel AS Maths) : Revision Note

Did this video help you?
Histograms
What is a histogram?
A histogram is similar to a bar chart but with some key differences
A histogram is for displaying grouped continuous data whereas a bar chart is for discrete or qualitative data
There will never be any gaps between the bars of adjacent groups in a histogram
Whilst in a bar chart the frequency is read from the height of the bar, in a histogram the height of the bar is the frequency density
On a histogram frequency density is plotted on the y – axis
This allows a histogram to be plotted for unequal class intervals
It is particularly useful if data is spread out at either or both ends
The area of each bar on a histogram will be proportional to the frequency in that class
What are the key features of a histogram?
You will not be asked to draw a histogram but you may have to add information to one so you should make sure you are familiar with the process for drawing one
Step 1. Always check that there are no gaps between the upper boundary of a class and the lower boundary of the next class
If there are gaps you will need to close them by changing the boundaries before carrying out any calculations
Consider whether the values are rounded or truncated before closing the gaps
Step 2. Find the class width of each group by subtracting the lower boundary from the upper boundary
Step 3. Calculate the frequency density for each group using the formula:
![]()
Step 4. The histogram will be drawn with the data values on the x – axis and frequency density on the y – axis
Remember that the scale on both axes must be even, although the class widths may be uneven
Both axes should be clearly labelled and units included on the x – axis
Most often, the bars will have different widths
Occasionally you will be asked to add a frequency polygon to the histogram
This is done by joining up the midpoints at the top of each bar
You should not join up the first or last midpoint to the x – axis (it is not really a polygon!)
How do we interpret a histogram?
It is important to remember that the y – axis does not tell us the frequency of each bar in the histogram
The area of the bar gives information about the frequency
Most of the time, the frequency will be the area of the bar and is found by multiplying the class width by the frequency density
Occasionally, the frequency will be proportional to the area of the bar
Frequency =
format('truetype')%3Bfont-weight%3Anormal%3Bfont-style%3Anormal%3B%7D%3C%2Fstyle%3E%3C%2Fdefs%3E%3Ctext%20font-family%3D%22Times%20New%20Roman%22%20font-size%3D%2218%22%20font-style%3D%22italic%22%20text-anchor%3D%22middle%22%20x%3D%224.5%22%20y%3D%2216%22%3Ek%3C%2Ftext%3E%3Ctext%20font-family%3D%22math13b8a614226a953a8cd9526fca6%22%20font-size%3D%2216%22%20text-anchor%3D%22middle%22%20x%3D%2222.5%22%20y%3D%2216%22%3E%26%23xD7%3B%3C%2Ftext%3E%3Ctext%20font-family%3D%22Times%20New%20Roman%22%20font-size%3D%2218%22%20text-anchor%3D%22middle%22%20x%3D%2250.5%22%20y%3D%2216%22%3Earea%3C%2Ftext%3E%3C%2Fsvg%3E)
In these cases more information will be given to help you find the value of k
You may be asked to find the frequency of part of a bar within a histogram
Find the area of that section of the bar using any information you have already found out
You will need to have found the value of k first
What are frequency polygons?
Frequency polygons are a very simple way of showing frequencies/frequency densities for continuous, grouped data and give a quick guide to how frequencies change from one class to the next
What do I need to know?
Apart from plotting and joining up points with straight lines there are 2 rules for frequency polygons:
Plot points at the MIDPOINT of class intervals
Unless one of the frequencies/densities is 0 do not join the frequency polygon to the x-axis, and do not join the first point to the last one
The result is not actually a polygon but more of an open one that ‘floats’ in mid-air!
You may be asked to draw a frequency polygon and/or use it to make comments and compare data
Worked Example
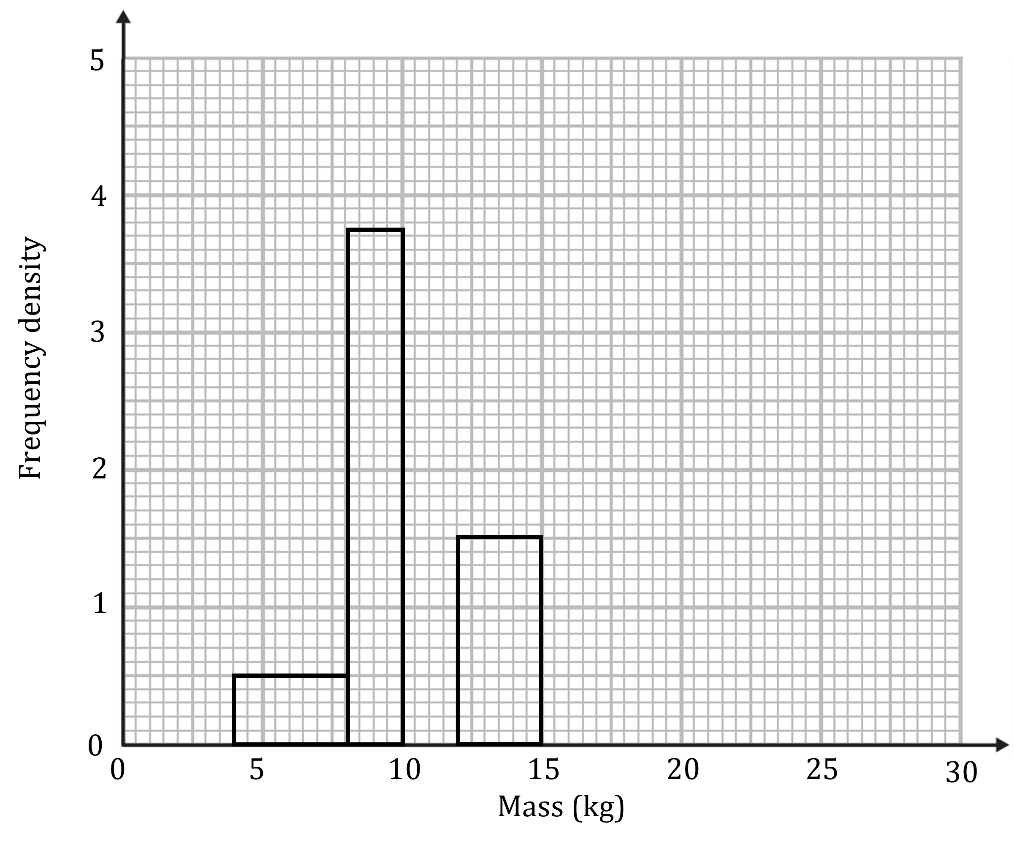
The table below and its corresponding histogram show the mass, in kg, of some new born bottlenose dolphins.
Mass, | Frequency |
| 4 |
| 15 |
| 19 |
|
|
| 6 |
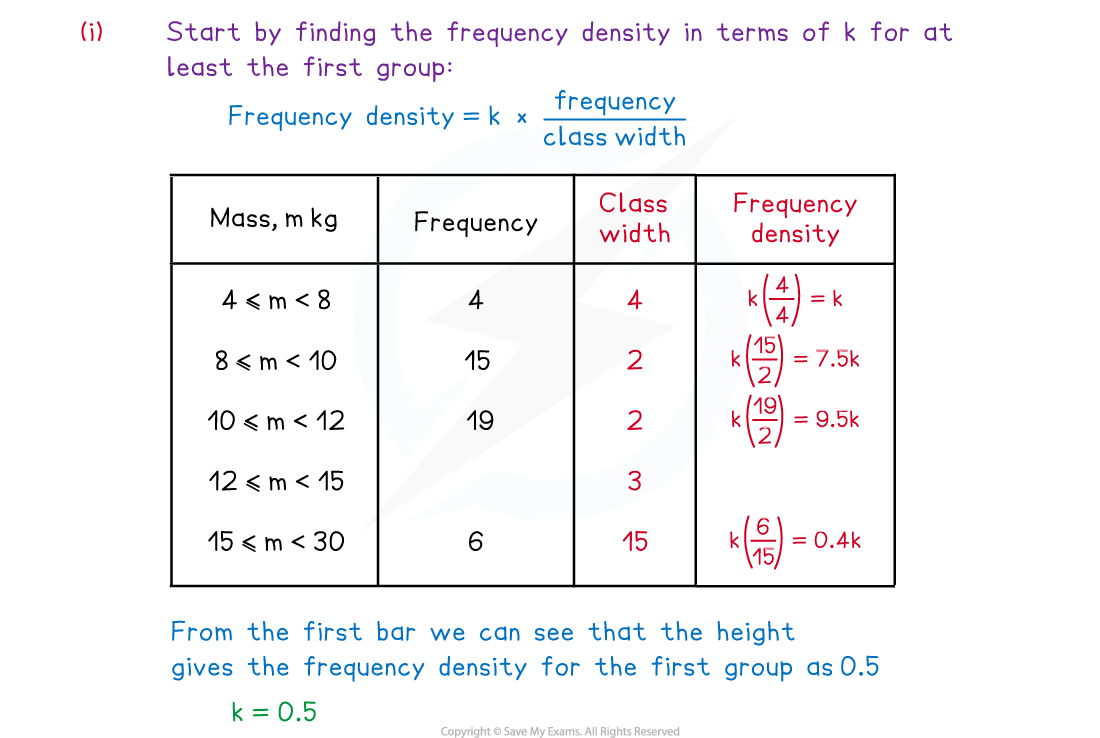
(i) Use the histogram to find the value of ![]() in the formula
in the formula ![]()
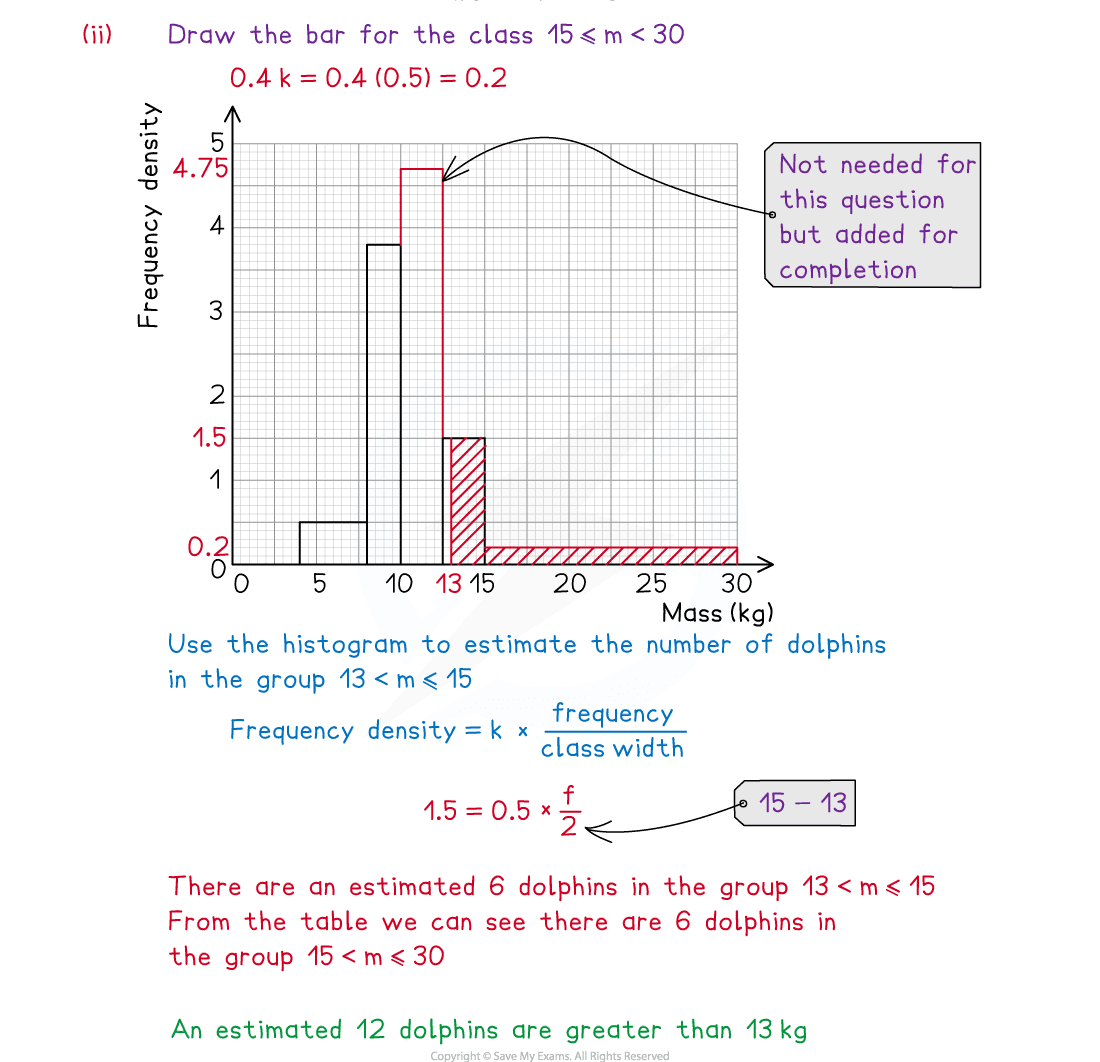
(ii) Estimate the number of dolphins whose weight is greater than 13 kg.
Examiner Tips and Tricks
Remember that the area of a bar in a histogram is not always the frequency itself but could be proportional to the frequency. Look carefully at the scales on the axes, it will rarely be a simple 1 unit to 1 square.

You've read 0 of your 5 free revision notes this week
Sign up now. It’s free!
Did this page help you?