Logarithmic Graphs (Edexcel AS Maths): Revision Note
Did this video help you?
Using Log Graphs in Modelling
What are log graphs?
Log graphs are used when the scale of a graph increases or decreases exponentially
It can very difficult to read specific values from graphs with these scales
![6-3-3-using-log-graphs-in-modelling-notes-fig1_1](https://cdn.savemyexams.com/cdn-cgi/image/f=auto,width=3840/https://cdn.savemyexams.com/uploads/2022/07/6-3-3-using-log-graphs-in-modelling-notes-fig1_1.png)
Taking ln of both sides allows the equation to be rearranged into the form “y = mx + c”
![Using Log Graphs in Modelling Notes fig3, A Level & AS Maths: Pure revision notes](https://cdn.savemyexams.com/cdn-cgi/image/f=auto,width=3840/https://cdn.savemyexams.com/uploads/2020/07/6.3.3-Using-Log-Graphs-in-Modelling-Notes-fig3.png)
Plotting ln y against t produces a straight line
![Using Log Graphs in Modelling Notes fig2, A Level & AS Level Pure Maths Revision Notes](https://cdn.savemyexams.com/cdn-cgi/image/f=auto,width=3840/https://cdn.savemyexams.com/uploads/2020/09/6.3.3-Using-Log-Graphs-in-Modelling-Notes-fig2.png)
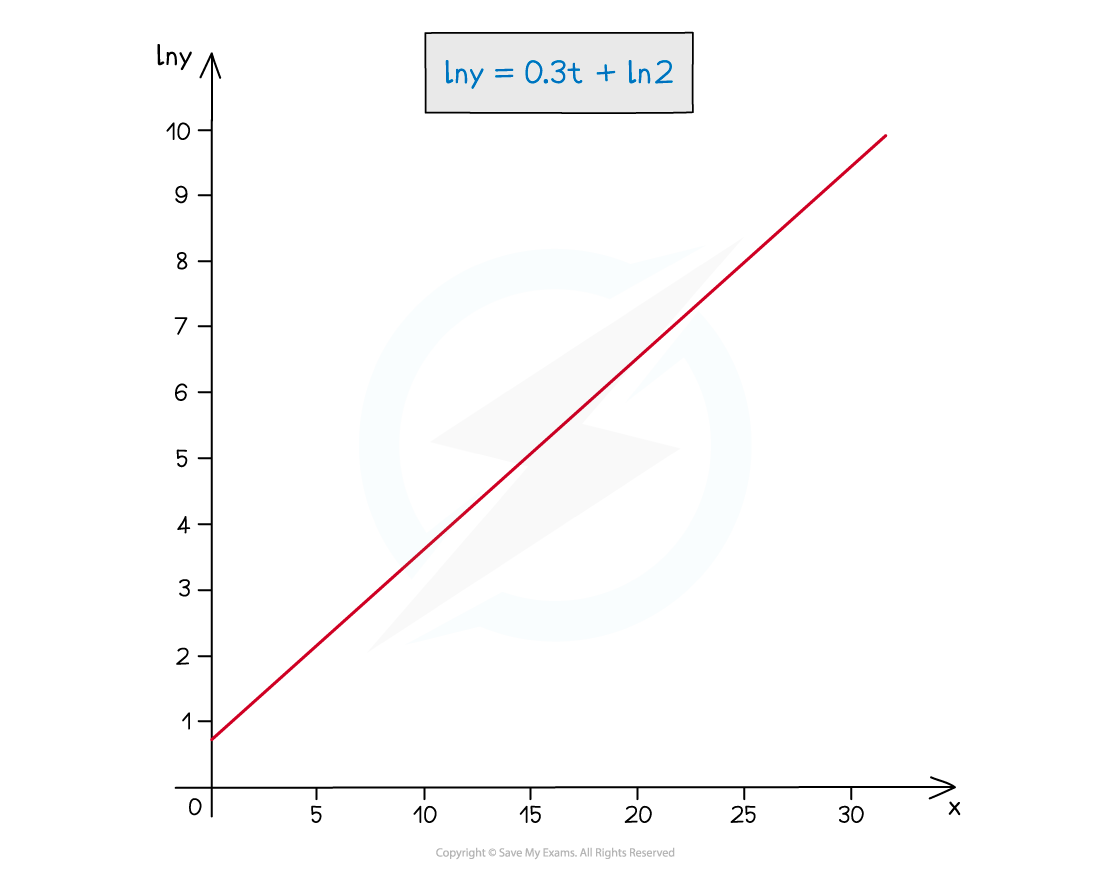
Note the second graph has ln y on the y-axis
Log graphs have at least one logarithmic axis
Reading a value for ln y at t = 20 is easier than reading the value for y
Logarithmic axes are used where a wide range of numbers can occur
it makes numbers smaller and easier to deal with
a curve can be turned into a straight line
![Using Log Graphs in Modelling Notes fig4, A Level & AS Level Pure Maths Revision Notes](https://cdn.savemyexams.com/cdn-cgi/image/f=auto,width=3840/https://cdn.savemyexams.com/uploads/2020/09/6.3.3-Using-Log-Graphs-in-Modelling-Notes-fig4.png)
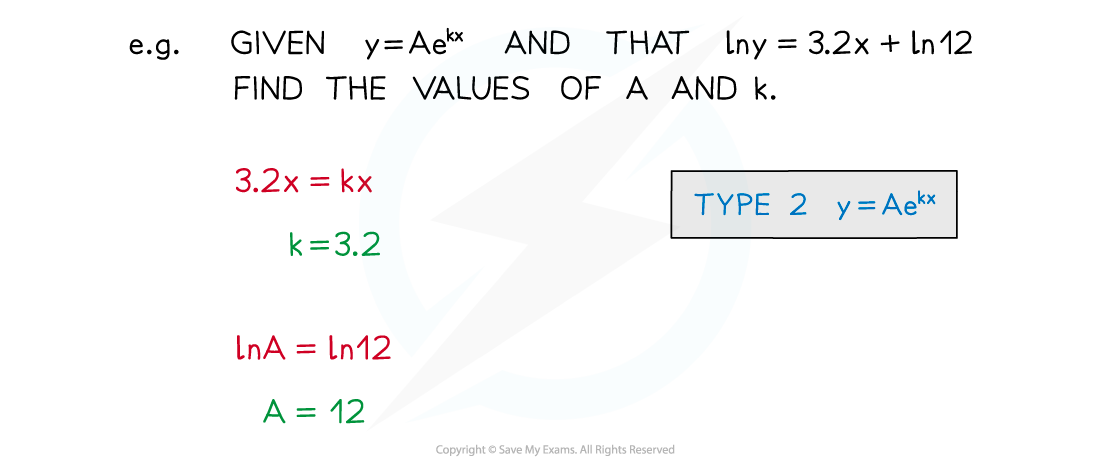
How do I use a logarithmic graph with exponential modelling?
Exponential models are of the form
y=Abkx (growth)
y=Ab-kx (decay)
To use a model to make predictions the values of A, b and k are needed
A, b and k will usually be estimated from observed data values
A may be known exactly, as it is a starting/initial value
Estimating from a straight line graph is easier than from a curve
![Using Log Graphs in Modelling Notes fig5, A Level & AS Level Pure Maths Revision Notes](https://cdn.savemyexams.com/cdn-cgi/image/f=auto,width=3840/https://cdn.savemyexams.com/uploads/2020/09/6.3.3-Using-Log-Graphs-in-Modelling-Notes-fig5.png)
![Using Log Graphs in Modelling Notes fig6, A Level & AS Maths: Pure revision notes](https://cdn.savemyexams.com/cdn-cgi/image/f=auto,width=3840/https://cdn.savemyexams.com/uploads/2020/07/6.3.3-Using-Log-Graphs-in-Modelling-Notes-fig6.png)
![Using Log Graphs in Modelling Notes fig7, A Level & AS Maths: Pure revision notes](https://cdn.savemyexams.com/cdn-cgi/image/f=auto,width=3840/https://cdn.savemyexams.com/uploads/2020/07/6.3.3-Using-Log-Graphs-in-Modelling-Notes-fig7.png)
![Using Log Graphs in Modelling Notes fig8, A Level & AS Maths: Pure revision notes](https://cdn.savemyexams.com/cdn-cgi/image/f=auto,width=3840/https://cdn.savemyexams.com/uploads/2020/07/6.3.3-Using-Log-Graphs-in-Modelling-Notes-fig8.png)
Worked Example
![Using Log Graphs in Modelling Example fig2, A Level & AS Level Pure Maths Revision Notes](https://cdn.savemyexams.com/cdn-cgi/image/f=auto,width=3840/https://cdn.savemyexams.com/uploads/2020/09/6.3.3-Using-Log-Graphs-in-Modelling-Example-fig2.png)
![Using Log Graphs in Modelling. Example fig3, A Level & AS Maths: Pure revision notes](https://cdn.savemyexams.com/cdn-cgi/image/f=auto,width=3840/https://cdn.savemyexams.com/uploads/2020/07/6.3.3-Using-Log-Graphs-in-Modelling.-Example-fig3.png)
You've read 0 of your 5 free revision notes this week
Sign up now. It’s free!
Did this page help you?