Sketching Polynomials (Edexcel AS Maths) : Revision Note

Did this video help you?
Sketching Polynomials
Sketching the graph of a polynomial
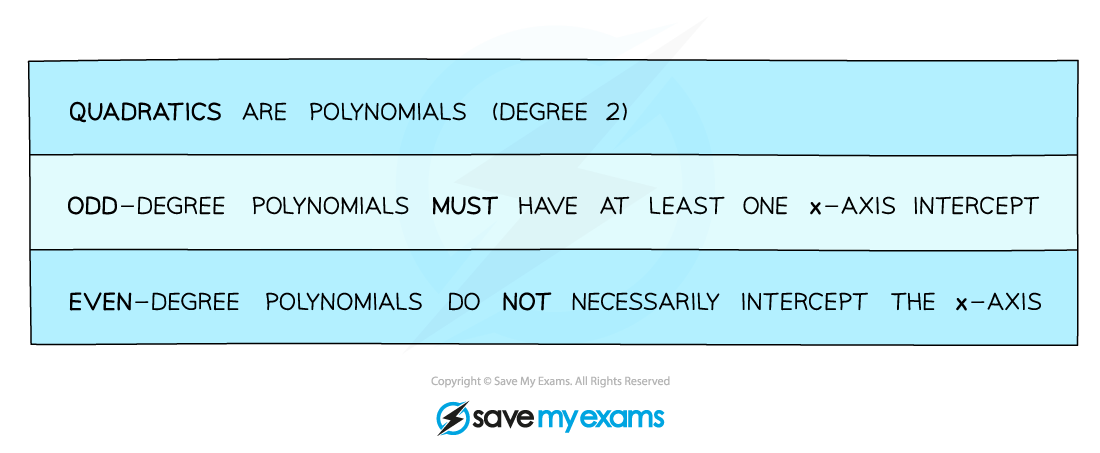
Remember a polynomial is any finite function with non-negative indices, that could mean a quadratic, cubic, quartic or higher power
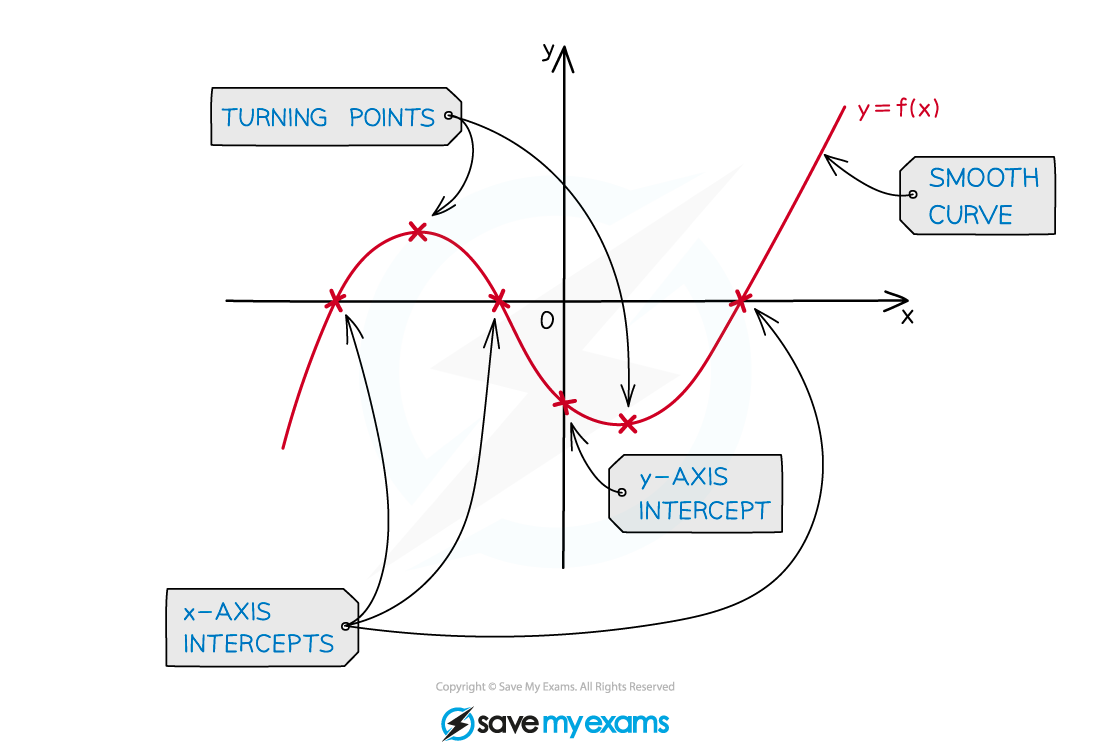
When asked to sketch a polynomial you'll need to think about the following
y-axis intercept
x-axis intercepts (roots)
turning points (maximum and/or minimum)
a smooth curve (this takes practice!)
How do I sketch a graph of a polynomial?
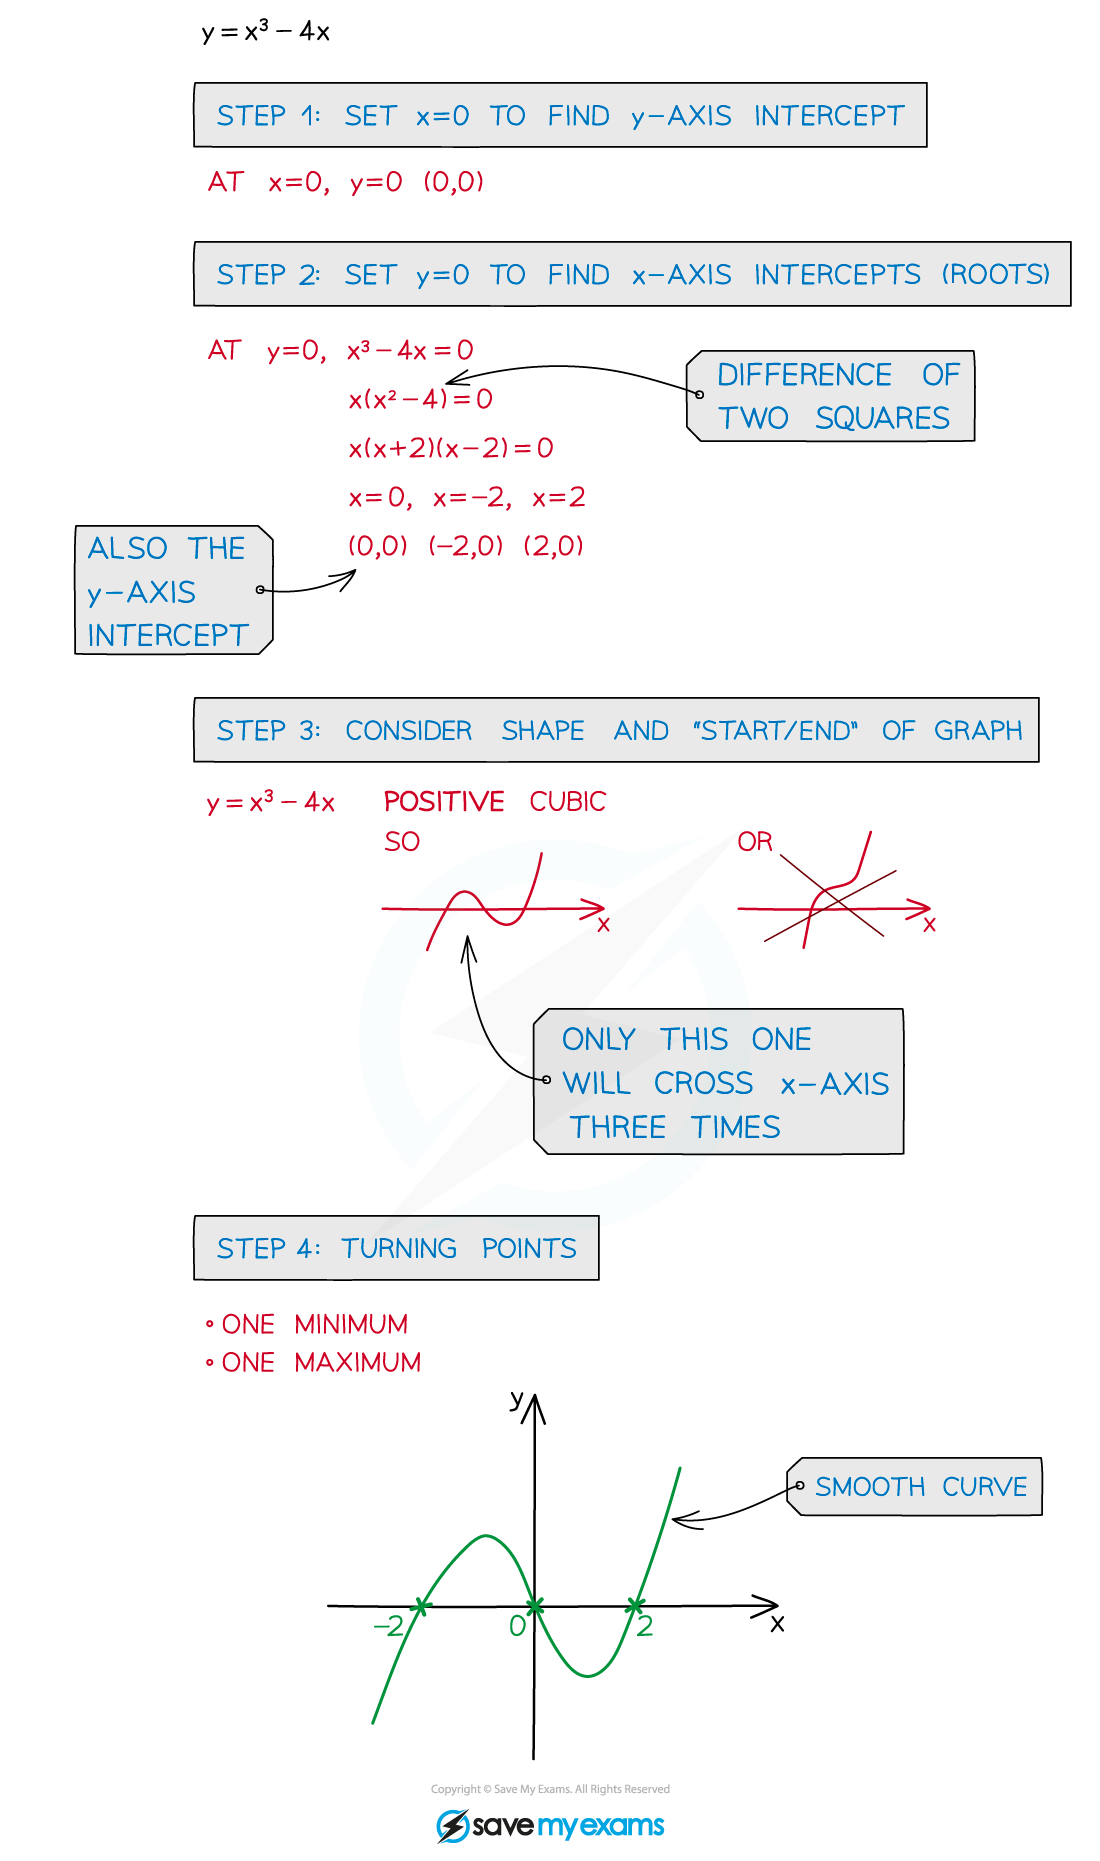
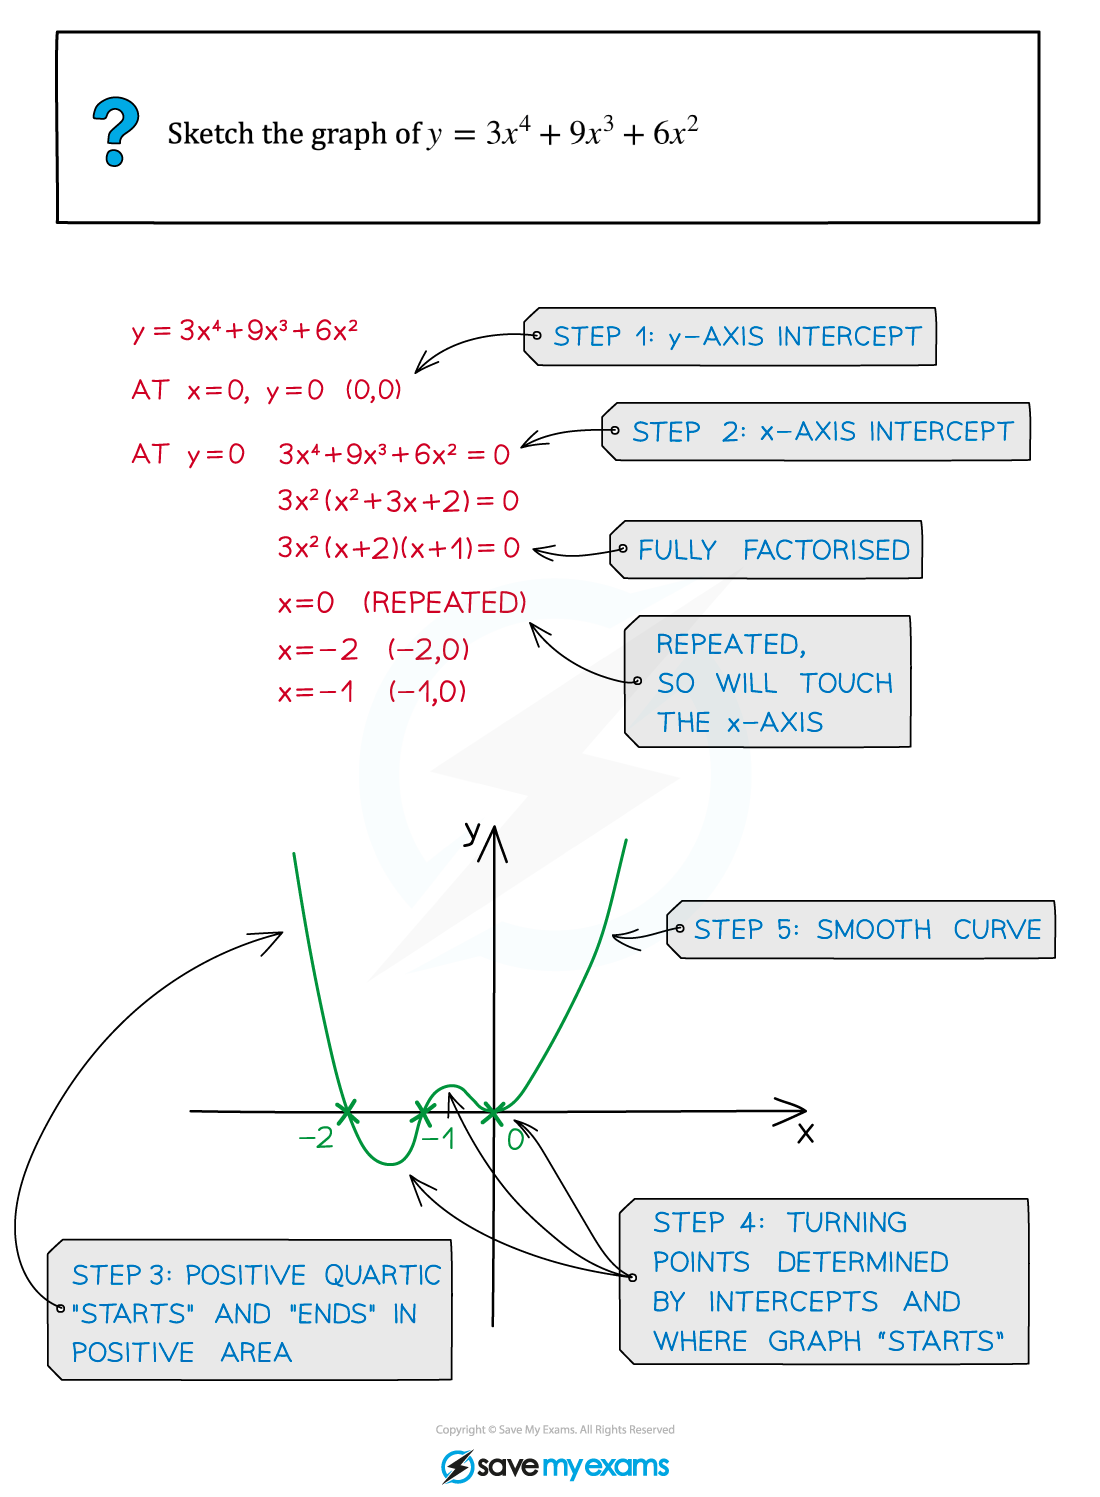
STEP 1 Find the y-axis intercept by setting x = 0
STEP 2 Find the x-axis intercepts (roots) by setting y = 0
STEP 3 Consider the shape and “start”/”end” of the graph
eg. a positive cubic graph starts in third quadrant (“bottom left”) and “ends” in first quadrant (“top right”)
STEP 4 Consider where any turning points should go
STEP 5 Draw with a smooth curve
Coordinates of turning points can be found using differentiation
Except with a point of inflection, repeated roots indicate the graph touches the x-axis
Worked Example

You've read 0 of your 5 free revision notes this week
Sign up now. It’s free!
Did this page help you?