Sketching Graphs of Modulus Functions (Cambridge (CIE) AS Maths) : Revision Note

Did this video help you?
Modulus Functions - Sketching Graphs
Modulus functions
The modulus function makes any ‘input’ positive
|x| = x if x ≥ 0 |f(x)| = f(x) if f(x) ≥ 0
|x| = -x if x < 0 |f(x)| = -f(x) if f(x) < 0
For example: |5| = 5 and |-5| = 5
Sometimes called absolute value
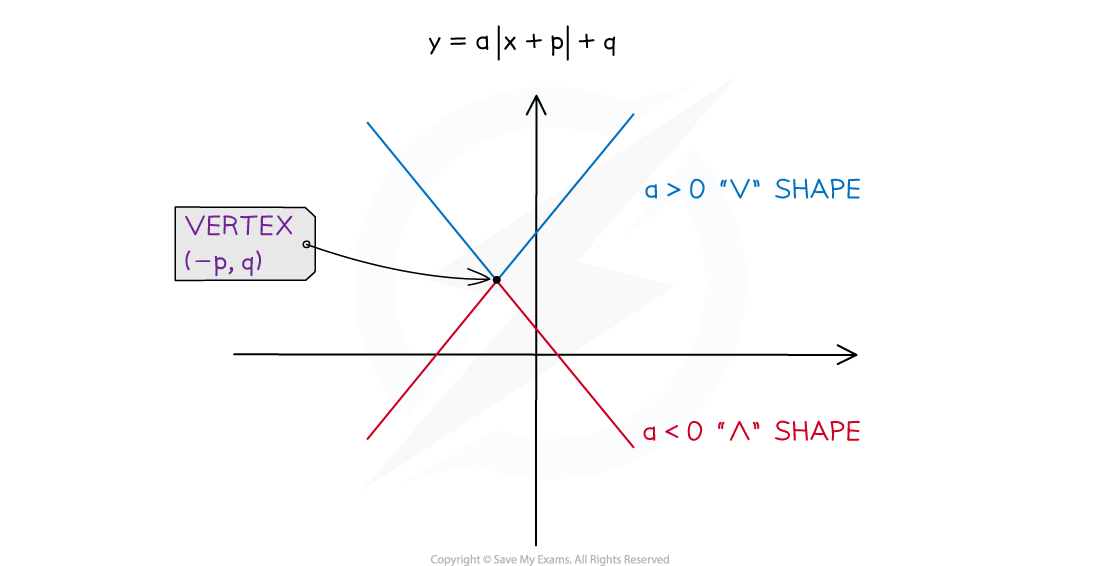
How do I sketch the graph of the modulus function: y = a |x + p| + q?
The graph will look like a “ꓦ” if a > 0 or a “ꓥ” if a < 0
There will be a vertex at the point (-p, q)
There could be 0, 1 or 2 roots
This depends on the location of the vertex and the orientation of the graph (ꓦ or ꓥ)
Compare this to the completed square form of a quadratic a(x + p)² + q
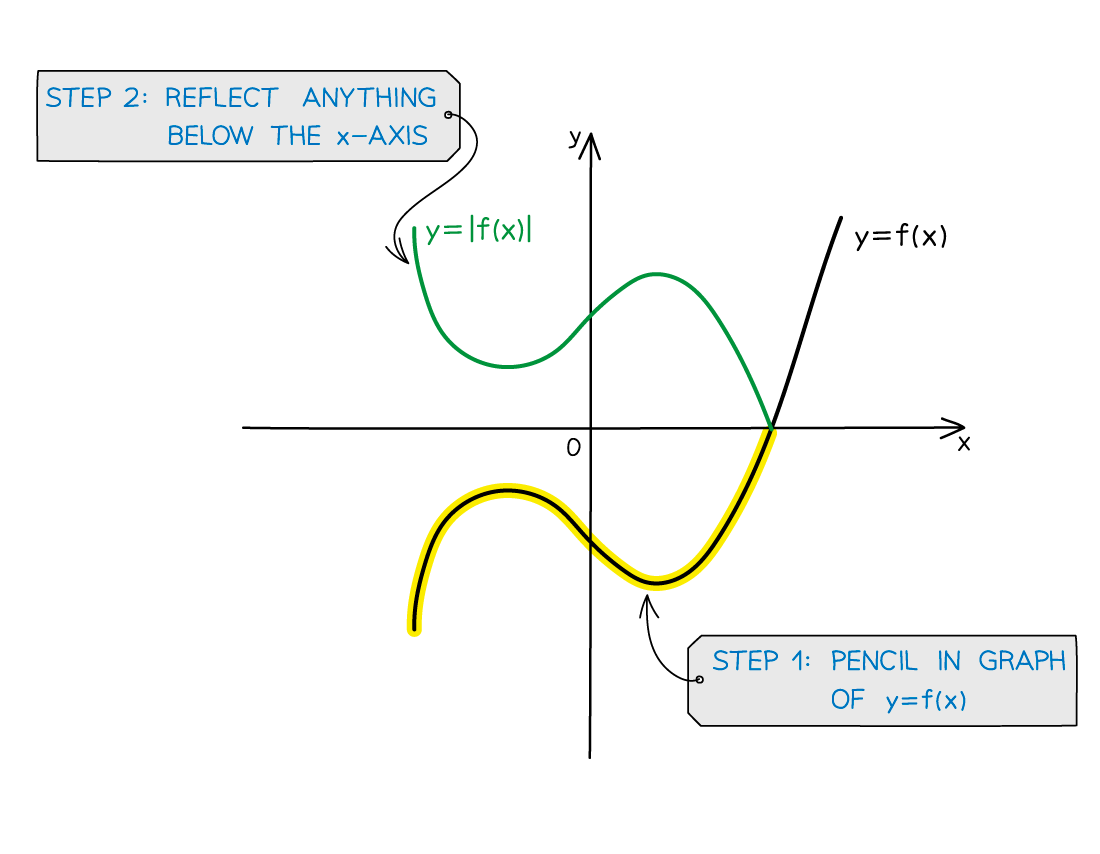
How do I sketch the graph of the modulus of a function: y = |f(x)|?
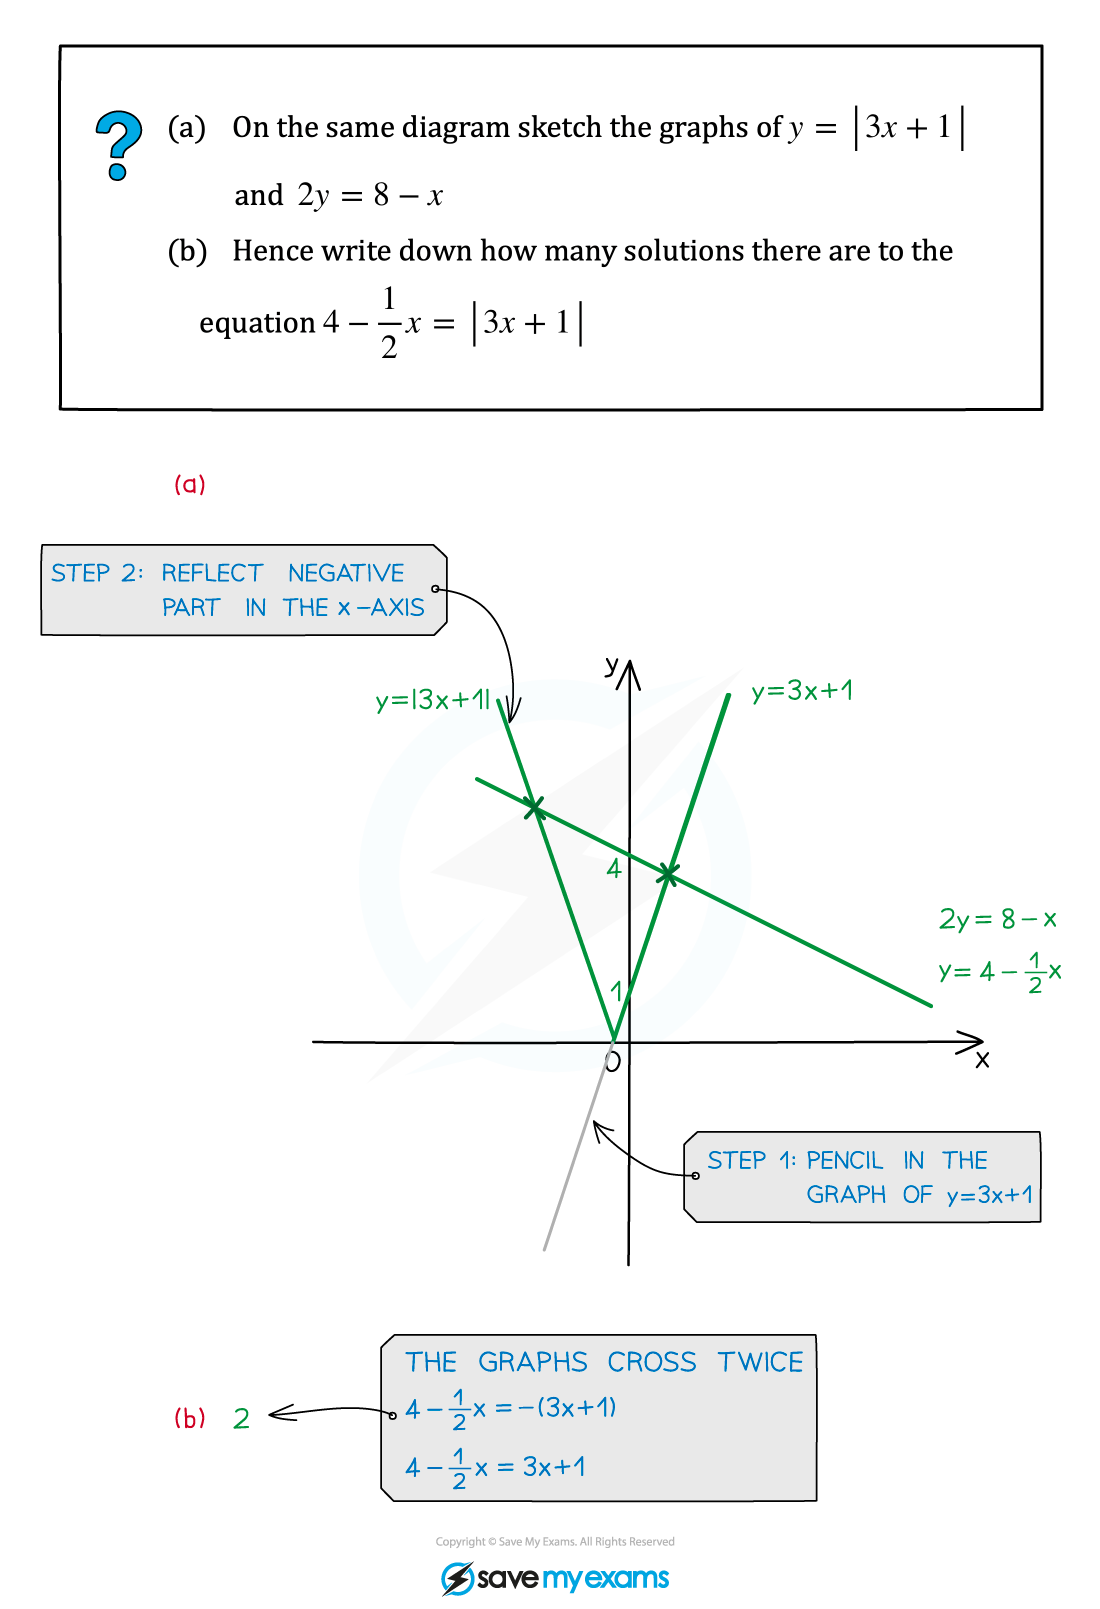
STEP 1 Pencil in the graph of y = f(x)
STEP 2 Reflect anything below the x-axis, in the x-axis, to get y = |f(x)|
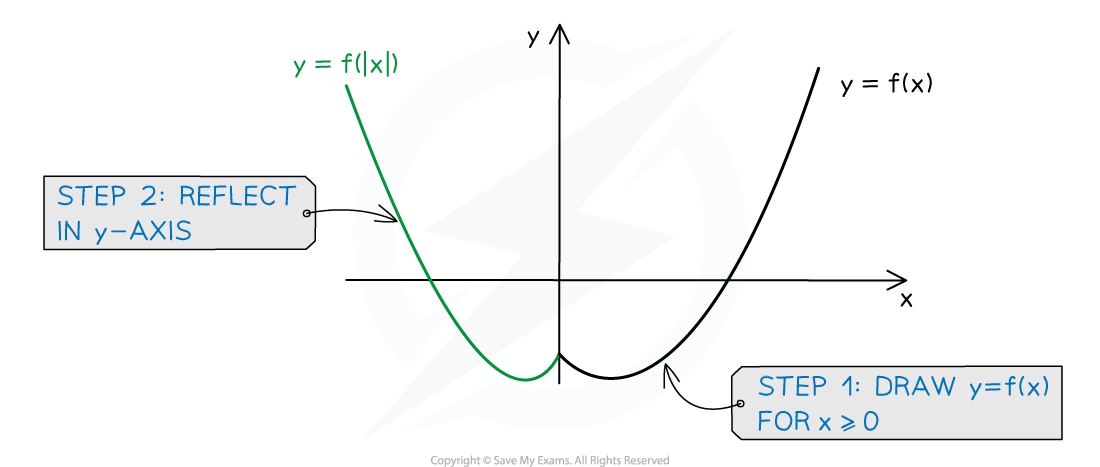
How do I sketch the graph of a function of a modulus: y = f(|x|)?
STEP 1 Sketch the graph of y = f(x) only for x ≥ 0
STEP 2 Reflect this in the y-axis
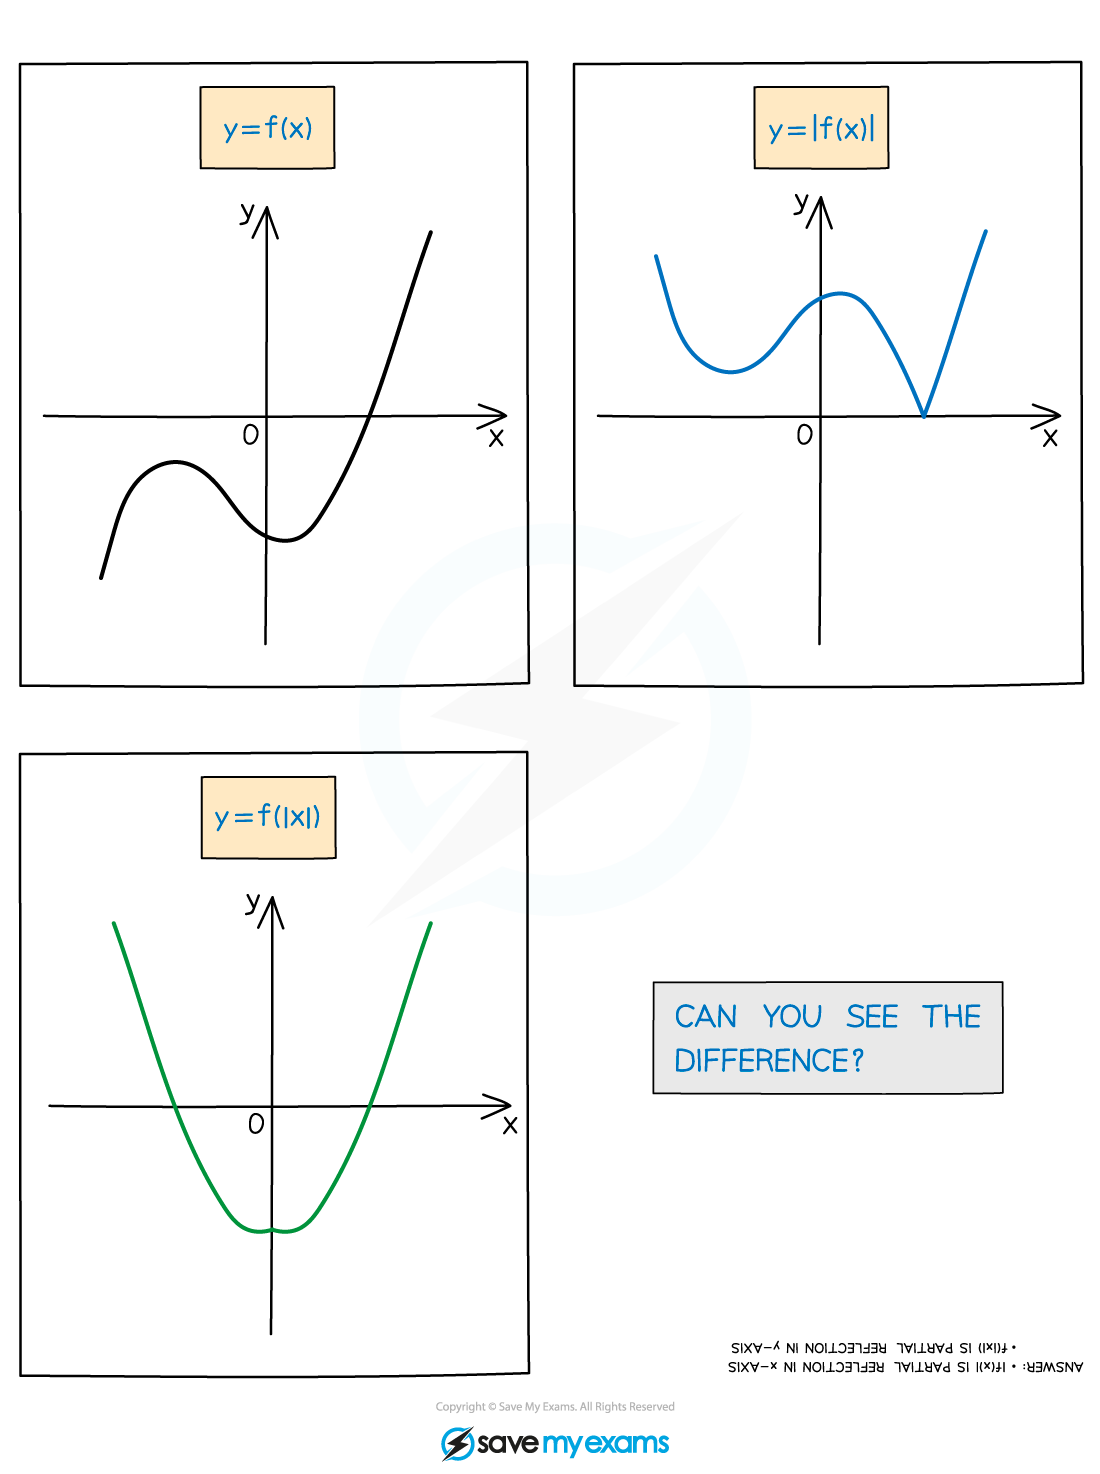
What is the difference between y = |f(x)| and y = f(|x|)?
There is a difference between y = |f(x)| and y = f(|x|)
The graph of y = |f(x)| never goes below the x-axis
It does not have to have any lines of symmetry
The graph of y = f(|x|) is always symmetrical about the y-axis
It can go below the y-axis
For the exam you will only be asked to do this when f(x) is linear
Your graphs will all look like a “ꓦ” or a “ꓥ”
You can also think of these graphs as transformations of the graph y = |x|
Worked Example

You've read 0 of your 5 free revision notes this week
Sign up now. It’s free!
Did this page help you?