The t-distribution (College Board AP® Statistics) : Study Guide
t-distribution
What is the t-distribution?
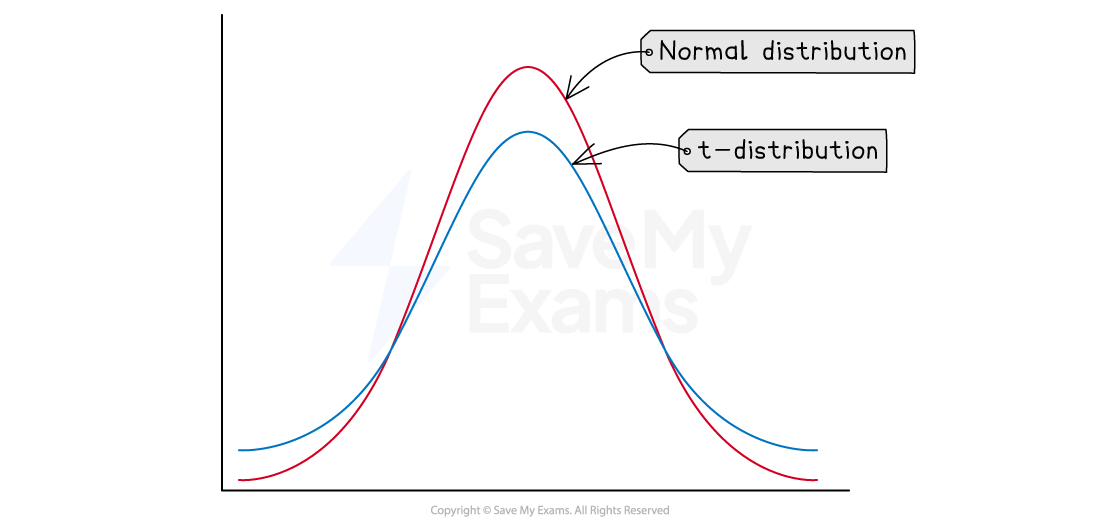
The t-distribution is a continuous probability distribution very similar to the normal distribution
If a continuous random variable follows the t-distribution, then its shape will be:
symmetrical
mound-shaped (bell-shaped)
However, the tails will be 'thicker' for the t-distribution than for the normal distribution

Thicker tails means that there is a greater chance of getting more extreme values with a t-distribution than with a normal distribution
The t-distribution is more conservative than the normal distribution
Degrees of freedom ('dof') is an additional parameter for the t-distribution curve
Increasing the degrees of freedom changes the shape of the curve, making the peak sharper and the tails thinner
The t-distribution curve approximates the standard normal curve,
, more closely as the degrees of freedom increase
The parameters of the t-distribution are similar to the standard normal distribution
The mean of the t-distribution is 0
The standard deviation of the t-distribution is greater than 1
but this gets closer to 1 as the degrees of freedom increase
When is the t-distribution used?
The t-distribution is used, rather than the normal distribution, when:
the population standard deviation,
, is unknown
and the population is approximately normally distributed
roughly symmetric
with no outliers
If
is unknown, the t-distribution can be used to
perform hypothesis tests for the population mean,
form confidence intervals for
In practice, the t-distribution tends to be used more for smaller sample sizes (
) when
is unknown
and the normal distribution is assumed for larger samples (
)
as larger samples mean a higher degree of freedom
making the t-distribution approximate the standard normal distribution
however, in theory, the t-distribution is the correct distribution whenever
is unknown, regardless of the sample size,
!
Examiner Tips and Tricks
If not specified in an exam question, you should use the normal distribution rather than the t-distribution if the population is approximately normal and either one of these is true:
The population standard deviation
is unknown and the sample size is greater than or equal to 30
or the population standard deviation,
, is known
How is a critical value found from the t-tables?
The t-tables are given to you in the exam
A critical value of t can be found from the t-tables
Find the row that corresponds to the number of degrees of freedom
Find the column that corresponds to the relevant significance level
The cell where these intersect contains the critical value of t
The very last row of the t-distribution table is called row infinity,
Row infinity is a row of
-scores from the standard normal distribution
Examiner Tips and Tricks
Don't get confused about with all the tables in the exams!
Both the t-distribution table and the critical values table have an area to the right of the boundary shaded. Also, the different shapes of the distributions are shown above each table.

You've read 0 of your 5 free study guides this week
Unlock more, it's free!
Did this page help you?

