Residual Plots (College Board AP® Statistics): Study Guide

Residual plots
What is a residual plot?
Recall that a residual is the vertical distance between a data point and the regression line
A residual plot is a graph that shows all the residuals from a scatterplot
The vertical axis shows the value of the residual
The horizontal axis shows the
 -values
What is a residual plot used for?
When using the least-squares regression line, a residual plot gives a good indication as to whether the data points follow a linear model or not
If the residuals vary randomly from positive to negative then this suggests a linear model is a good fit for the data
If the residuals do not vary randomly (i.e. they follow a curve or form a pattern) then this suggests a linear model is not a good fit for the data
In this case, a non-linear (curved) model may be more appropriate
Worked Example
A scatterplot is shown below. The equation of the least-squares regression line is ![]() , where
, where ![]() is the predicted
is the predicted ![]() -value. By constructing a residual plot, determine whether or not a linear model is appropriate for the data.
-value. By constructing a residual plot, determine whether or not a linear model is appropriate for the data.
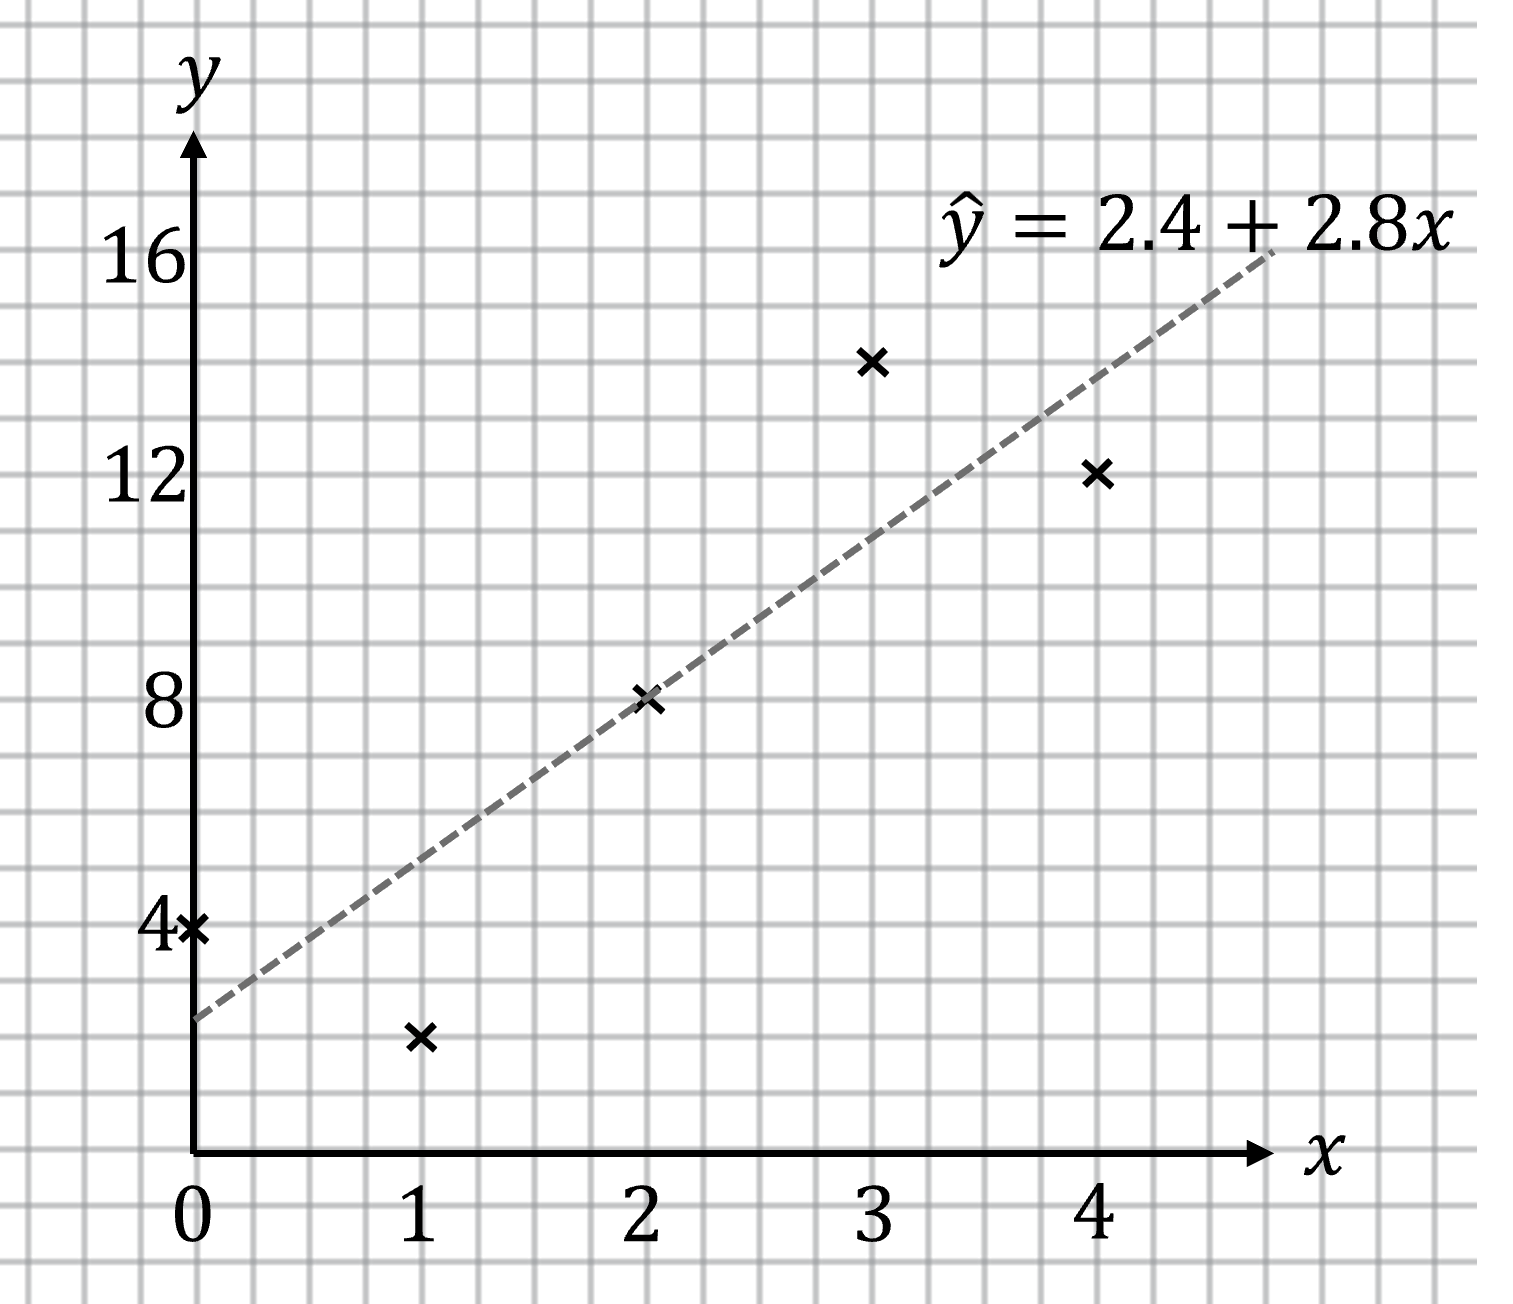
Answer:
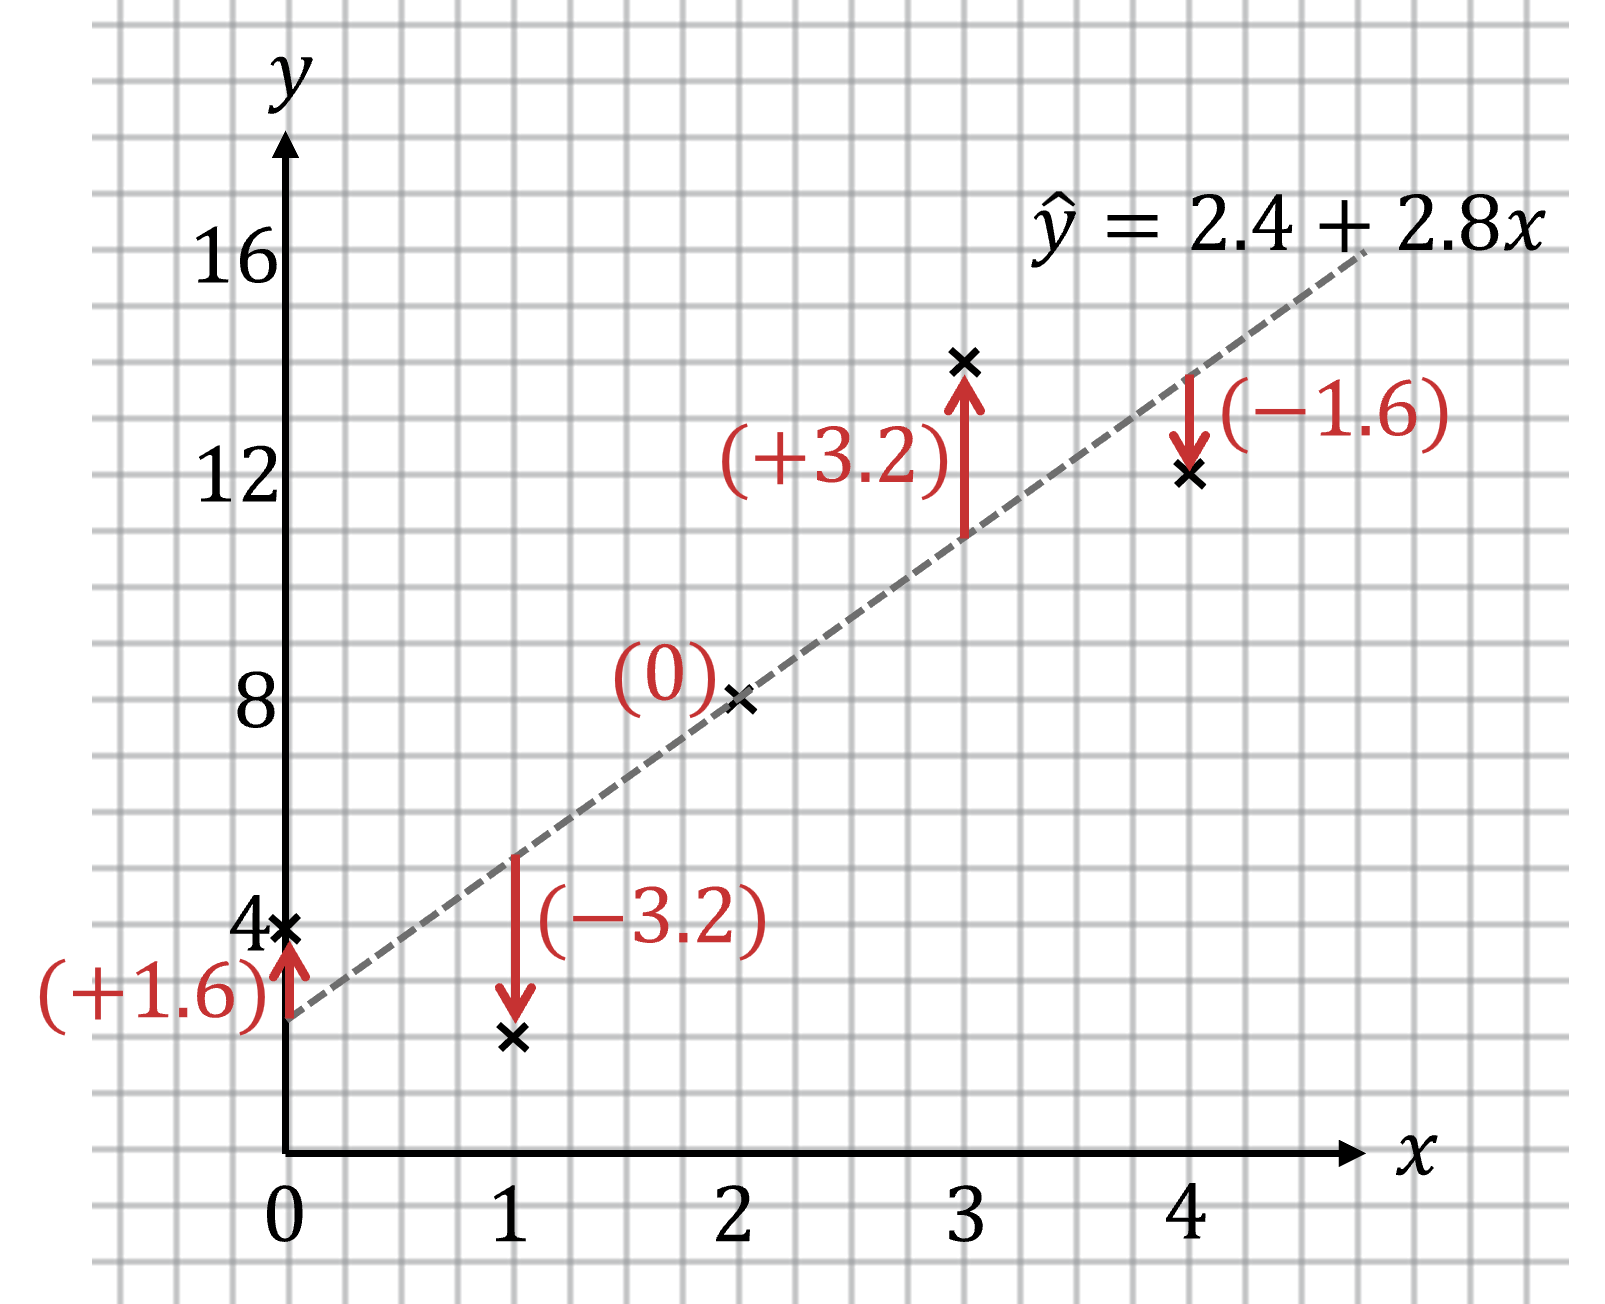
First calculate the residuals (by finding the vertical distance of each data point above or below the regression line, ![]() )
)
To find the ![]() -values from the regression line, it is more accurate to substitute the
-values from the regression line, it is more accurate to substitute the ![]() -values into the equation of the line
-values into the equation of the line ![]() , rather than read off their values from the graph
, rather than read off their values from the graph
The residual at ![]() is
is ![]()
The residual at ![]() is
is ![]() etc.
etc.
Then construct a residual plot by plotting the values of the residuals on the vertical axis and the ![]() -values on the horizontal axis
-values on the horizontal axis
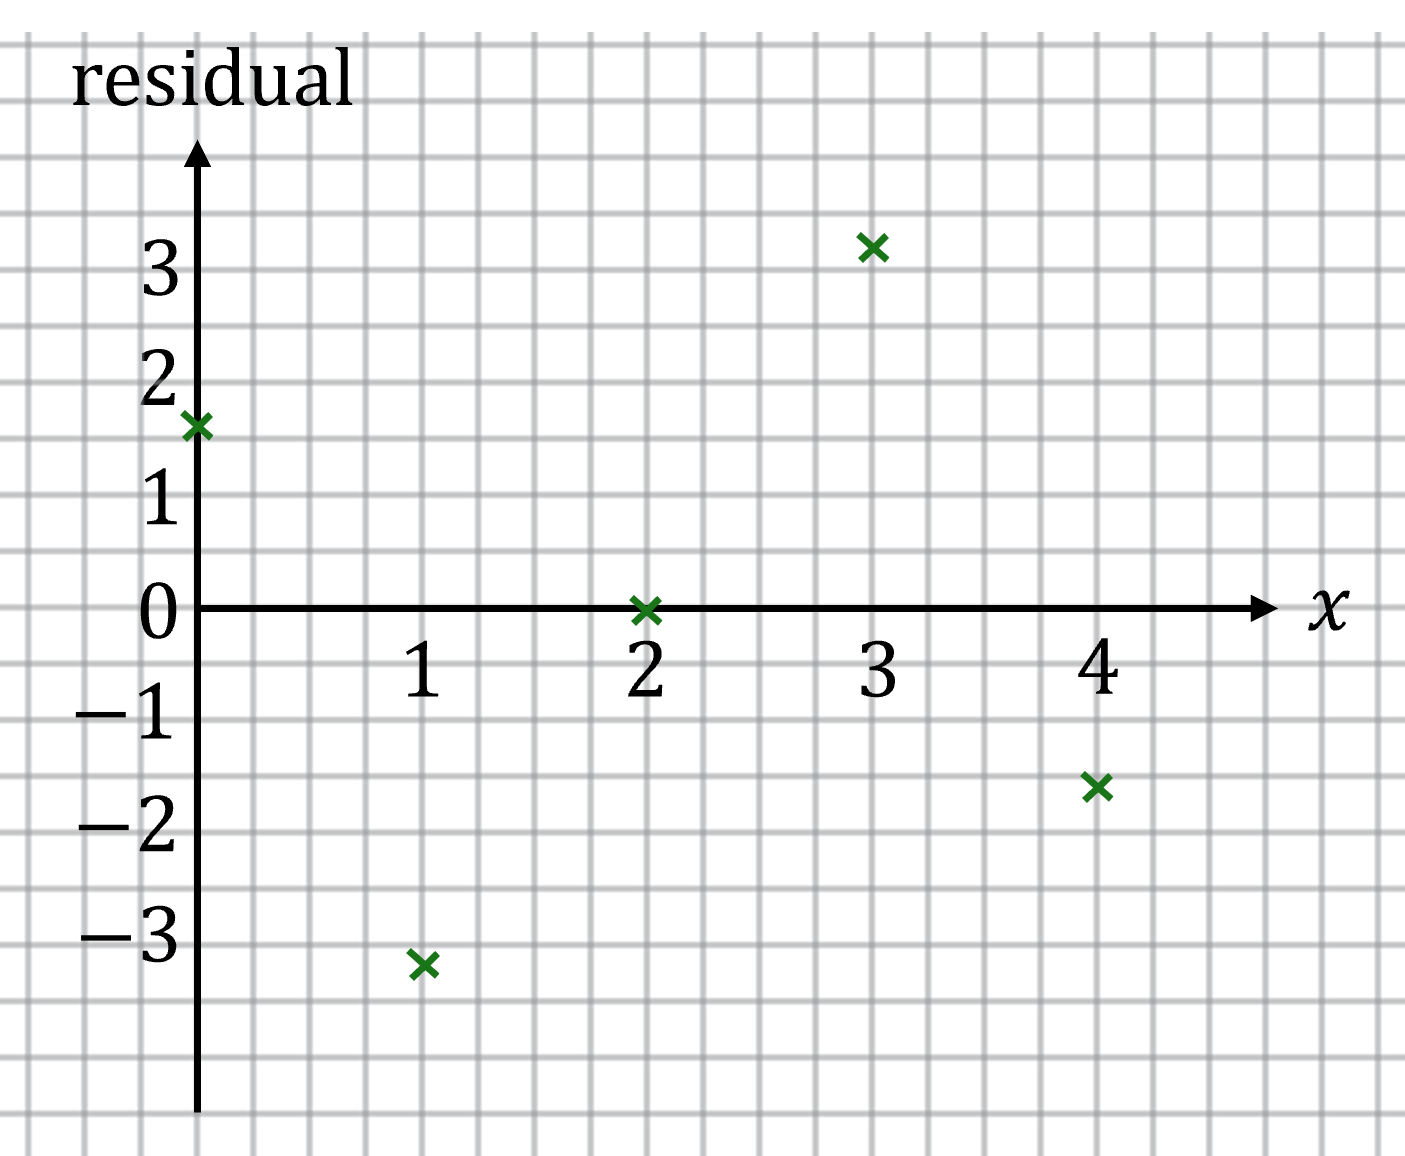
If the residual plot shows that residuals vary randomly from positive to negative (without following a curve or a pattern), then a linear model is a good fit
The residual plot shows that residuals appear to vary randomly which suggests a linear model is appropriate for the data

You've read 0 of your 5 free study guides this week
Unlock more, it's free!
Did this page help you?
